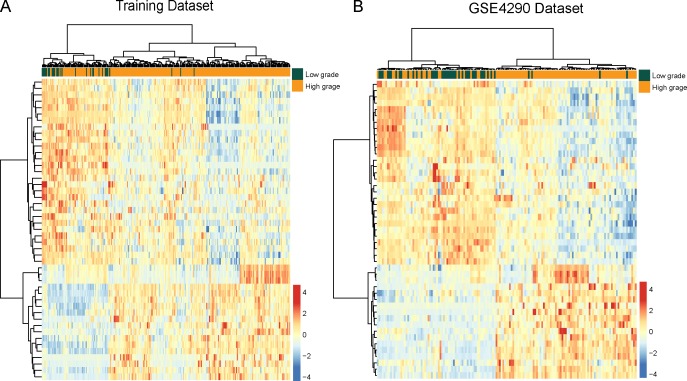
Figure 3. The heatmap of hierarchical clustering of differentially expressed lncRNAs between low-grade gliomas and high-grade gliomas.
(A) The heatmap of hierarchical clustering of differentially expressed lncRNAs between low-grade gliomas and high-grade gliomas in the training dataset. (B) The heatmap of hierarchical clustering of differentially expressed lncRNAs between glioma samples and normal brain tissues in the GSE4290 dataset.

