Abstract
Here, we used an informatics-based approach to identify novel biomarkers of overall survival and tumor progression in non-small cell lung cancer (NSCLC) patients. We determined whether nuclear-encoded genes associated with mitochondrial biogenesis and function can be used to effectively predict clinical outcome in lung cancer. This strategy allowed us to directly provide in silico validation of the prognostic value of these mitochondrial components in large, clinically-relevant, lung cancer patient populations. Towards this end, we used a group of 726 lung cancer patients, with negative surgical margins. Importantly, in this group of cancer patients, markers of cell proliferation (Ki67 and PCNA) were associated with poor overall survival, as would be expected. Similarly, key markers of inflammation (CD163 and CD68) also predicted poor clinical outcome in this patient population. Using this approach, we identified >180 new individual mitochondrial gene probes that effectively predicted significantly reduced overall survival, with hazard-ratios (HR) of up to 4.89 (p<1.0e-16). These nuclear-encoded mitochondrial genes included chaperones, membrane proteins as well as ribosomal proteins (MRPs) and components of the OXPHOS (I-V) complexes. In this analysis, HSPD1, a key marker of mitochondrial biogenesis, had the highest predictive value and was also effective in predicting tumor progression in both smokers and non-smokers alike. In fact, it had even higher predictive value in non-smokers (HR=5.9; p=3.9e-07). Based on this analysis, we conclude that mitochondrial biogenesis should be considered as a new therapeutic target, for the more effective treatment of human lung cancers. The mitochondrial biomarkers that we have identified could serve as new companion diagnostics to assist clinicians in more accurately predicting clinical outcomes in lung cancer patients, driving more personalized cancer therapy.
Keywords: lung cancer, mitochondrial biomarkers, treatment failure, relapse, recurrence
INTRODUCTION
Treatment failure is the most critical obstacle for more effective anti-cancer therapy and personalized medicine [1, 2]. As such, this still dramatically limits the efficacy of most cancer treatments, especially in lung cancer patients. As a consequence, better biomarkers are needed for the early stratification of lung cancer patients into low-risk and high-risk groups at diagnosis [1–3].
Here, we examined the hypothesis that markers of mitochondrial biogenesis and function may have significant prognostic value in the early identification of high-risk lung cancer patients, with poor overall clinical survival and tumor progression. In this context, we employed a bioinformatics approach to assess the possible utility of nuclear-encoded mitochondrial gene transcripts in predicting clinical outcome.
Our results indicate that > 180 different mitochondrial gene probes can be used individually, to predict poor overall survival in lung cancer patients. As such, we discuss the possibility that mitochondria should be therapeutically targeted, to improve the effectiveness of current lung cancer therapy and overall survival.
RESULTS
Value of proliferative and inflammatory markers in the patient population
To identify new potential biomarkers, here we used publically available transcriptional profiling data from the tumors of lung cancer patients, with negative surgical margins (Figure 1), with 10 years of follow-up. Since proliferative markers are used as primary endpoints in clinical trials, we first assessed the prognostic value of Ki67 and PCNA, in this patient population. Tables 1, 2 and Figure 2A both show the prognostic value of these markers. The hazard-ratios for Ki67 and PCNA were 4.85 and 1.82, respectively, for overall survival (OS).
Figure 1. Diagram showing our bio-informatics approach to lung cancer biomarker discovery.
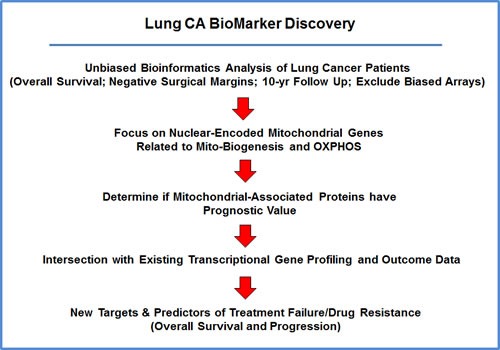
For this analysis, we chose to focus on non-small lung cancer patients, with negative surgical margins, and 10-years of follow-up data (N = 726). In this context, we evaluated the prognostic value of mitochondrial markers for predicting overall survival, time to first progression, and post-progression survival.
Table 1. Prognostic Value of KI67 in Lung Cancer.
| Gene Probe ID | Symbol | Hazard-Ratio | Log-Rank Test |
|---|---|---|---|
| 212020_s_at | MKI67 | 4.85 | 2.2e-16 |
| 212021_s_at | MKI67 | 3.11 | 3.4e-11 |
| 212023_s_at | MKI67 | 3.04 | 2.4e-12 |
| 212022_s_at | MKI67 | 2.96 | 7.4e-14 |
| Combined | 4.43 | 7.0e-14 |
Table 2. Prognostic Value of PCNA and Markers of Inflammation in Lung Cancer.
| Gene Probe ID | Symbol | Hazard-Ratio | Log-Rank Test |
|---|---|---|---|
| 217400_at | PCNA | 1.82 | 4.1e-07 |
| 216233_at | CD163 | 1.95 | 5.6e-09 |
| 215049_x_at | CD163 | 1.39 | 0.006 |
| 203645_s_at | CD163 | 1.30 | 0.03 |
| 203507_at | CD68 | 1.59 | 0.0002 |
Figure 2. Markers of proliferation and inflammation predict poor overall survival in high-risk lung cancer patients.
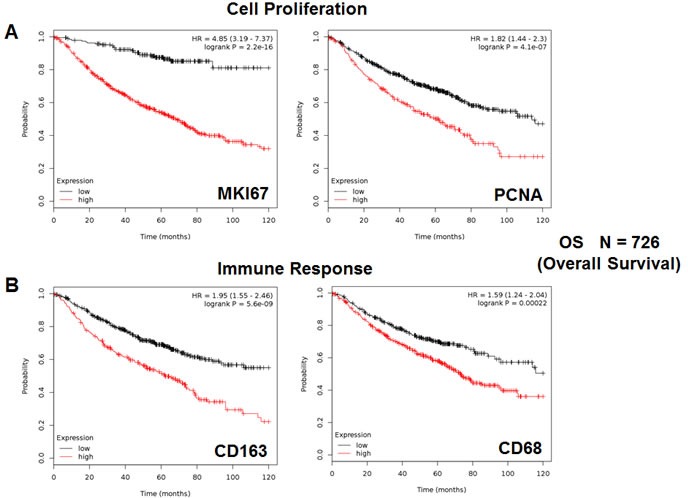
We assessed the predictive value of Ki67 and PCNA in N = 726 lung cancer patients, with negative surgical margins. A. Note that high transcript levels of Ki67 and PCNA are associated with significantly reduced overall survival. Please note that the official gene name for the Ki67 protein is MKI67. B. Note that that high transcript levels of CD163 and CD68 are associated with significantly reduced overall survival.
We also assessed the prognostic value of two macrophage-specific markers of inflammation. Table 2 and Figure 2B show that CD163 and CD68 both effectively predict overall survival, with hazard-ratios of 1.95 and 1.59, respectively. Thus, conventional markers of proliferation and inflammation can be used to predict overall survival in lung cancer patients.
Value of individual mitochondrial markers
To test our hypothesis that increased mitochondrial mass, biogenesis and function contributes towards poor overall survival in lung cancer patients, we next assessed the prognostic value of specific mitochondrial markers.
Initially, we examined the behavior of mitochondrial chaperones and mitochondrial membrane proteins. Table 3 and Figure 3 both show that HSP60 (HSPD1) has the best prognostic value, with a hazard-ratio of 4.89 (p < 1.0e-17). Members of the TIMM and TOMM gene families also had prognostic value; AKAP1 and SLC25A5 also had significant value. Similar results were also obtained with mitochondrial creatine kinase isoforms (HR = 2.88-to-1.51) and PRKDC (DNA-PK), a critical kinase that helps maintain the integrity and the copy number of the mitochondrial genome (mt-DNA) (HR = 4.69-to-1.65), which functions in the DNA damage response.
Table 3. Prognostic Value of Mitochondrial HSPs and Other Mitochondrial Proteins.
| Gene Probe ID | Symbol | Hazard-Ratio | Log-Rank Test |
|---|---|---|---|
| HSPs and Membrane Proteins (28 probes in total) | |||
| 200806_s_at | HSPD1 | 4.89 | <1.0e-16 |
| 218119_at | TIMM23 | 4.68 | 1.1e-16 |
| 218357_s_at | TIMM8B | 4.26 | 7.8e-16 |
| 203342_at | TIMM17B | 3.31 | 2.5e-11 |
| 203093_s_at | TIMM44 | 2.29 | 1.1e-09 |
| 217981_s_at | TIMM10B | 2.15 | 1.2e-06 |
| 218316_at | TIMM9 | 2.06 | 4.3e-08 |
| 201821_s_at | TIMM17A | 2.04 | 1.7e-09 |
| 218188_s_at | TIMM13 | 1.94 | 8.5e-09 |
| 218118_s_at | TIMM23 | 1.83 | 1.8e-07 |
| 218408_at | TIMM10 | 1.79 | 4e-05 |
| 202264_s_at | TOMM40 | 4.29 | 1.1e-14 |
| 217960_s_at | TOMM22 | 3.19 | 1.3e-13 |
| 201870_at | TOMM34 | 2.83 | 9.8e-12 |
| 201812_s_at | TOMM7 | 2.84 | 5.4e-13 |
| 201512_s_at | TOMM70A | 1.90 | 3.1e-08 |
| 212773_s_at | TOMM20 | 1.54 | 0.0006 |
| 217139_at | VDAC1 | 3.74 | 1.9e-14 |
| 217140_s_at | VDAC1 | 2.58 | 1.1e-16 |
| 212038_s_at | VDAC1 | 1.63 | 7.8e-05 |
| 208844_at | VDAC3 | 3.64 | 3.9e-14 |
| 211662_s_at | VDAC2 | 2.36 | 6e-14 |
| 210625_s_at | AKAP1 | 1.88 | 1.3e-06 |
| 200657_at | SLC25A5 | 1.54 | 0.0001 |
| Mitochondrial Creatine Kinase (2 probes in total) | |||
| 202712_s_at | CKMT1A | 2.88 | 7.8e-10 |
| 205295_at | CKMT2 | 1.51 | 0.0005 |
| Mitochondrial Genome Maintenance (3 probes in total) | |||
| 210543_s_at | PRKDC | 4.69 | 1.1e-16 |
| 208694_at | PRKDC | 2.23 | 4.3e-12 |
| 215757_at | PRKDC | 1.65 | 4.0e-05 |
Figure 3. HSPD1, mitochondrial membrane proteins and PRKDC are associated with poor clinical outcome in lung cancer patients.
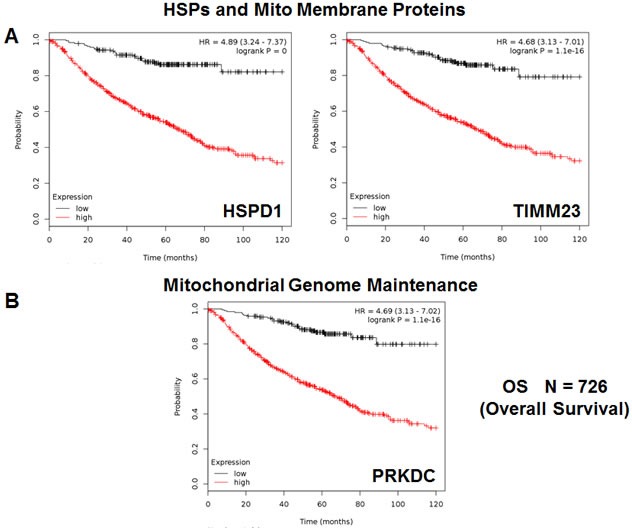
A. Note that that high transcript levels of HSPD1 and TIMM23 are associated with significantly reduced overall survival. B. Note that that high transcript levels of PRKDC are associated with significantly reduced overall survival.
Secondly, we examined the prognostic value of mitochondrial ribosomal proteins (MRPs), which contribute to the synthesis of key members of the OXPHOS-complexes, and are essential for mitochondrial biogenesis (Table 4). Twenty-one components of the large subunit (MRPLs) showed significant prognostic value, with hazard-ratios between 4.36 and 1.47. Notably, MRPL48 had the best prognostic value. Fifteen different components of the small subunit (MRPSs) showed significant prognostic value, with hazard-ratios between 4.10 and 1.27. As such, thirty-six different MRPs all predicted poor overall survival. Kaplan-Meier curves for representative examples are shown in Figure 4, panels A & B.
Table 4. Prognostic Value of Mitochondrial Ribosomal Proteins.
| Gene Probe ID | Symbol | Hazard-Ratio | Log-Rank Test |
|---|---|---|---|
| Large Ribosomal Subunit (21 probes in total) | |||
| 218281_at | MRPL48 | 4.36 | 1.9e-15 |
| 213897_s_at | MRPL23 | 3.55 | 5.4e-13 |
| 219162_s_at | MRPL11 | 3.29 | 2.5e-13 |
| 221997_s_at | MRPL52 | 3.20 | 3.6e-14 |
| 221692_s_at | MRPL34 | 3.08 | 1.6e-11 |
| 203931_s_at | MRPL12 | 2.82 | 3.3e-12 |
| 218887_at | MRPL2 | 2.81 | 4.4e-11 |
| 217919_s_at | MRPL42 | 2.54 | 1.6e-13 |
| 218270_at | MRPL24 | 2.35 | 1.8e-09 |
| 218105_s_at | MRPL4 | 2.32 | 1.6e-09 |
| 218202_x_at | MRPL44 | 2.19 | 2.5e-10 |
| 222216_s_at | MRPL17 | 2.02 | 1.4e-08 |
| 218890_x_at | MRPL35 | 1.96 | 5.7e-09 |
| 204599_s_at | MRPL28 | 1.91 | 1.4e-07 |
| 220527_at | MRPL20 | 1.84 | 9.1e-05 |
| 201717_at | MRPL49 | 1.68 | 8.7e-06 |
| 218049_s_at | MRPL13 | 1.68 | 8.1e-06 |
| 217980_s_at | MRPL16 | 1.66 | 1.5e-05 |
| 203152_at | MRPL40 | 1.62 | 0.0001 |
| 218027_at | MRPL15 | 1.59 | 0.0001 |
| 203781_at | MRPL33 | 1.47 | 0.001 |
| Small Ribosomal Subunit (19 probes in total) | |||
| 204331_s_at | MRPS12 | 4.10 | 1.1e-16 |
| 210008_s_at | MRPS12 | 3.93 | 4.9e-14 |
| 204330_s_at | MRPS12 | 3.27 | 1e-13 |
| 213840_s_at | MRPS12 | 2.99 | 2.3e-12 |
| 217932_at | MRPS7 | 3.55 | 2.3e-12 |
| 218001_at | MRPS2 | 3.28 | 1e-11 |
| 221688_s_at | MRPS4 | 3.09 | 7.7e-11 |
| 211595_s_at | MRPS11 | 2.96 | 9.1e-12 |
| 215919_s_at | MRPS11 | 1.55 | 0.0002 |
| 218112_at | MRPS34 | 2.43 | 7.6e-08 |
| 212604_at | MRPS31 | 2.29 | 2.7e-07 |
| 219819_s_at | MRPS28 | 1.74 | 2.7e-06 |
| 217942_at | MRPS35 | 1.70 | 8.4e-06 |
| 221437_s_at | MRPS15 | 1.59 | 0.0001 |
| 12145_at | MRPS27 | 1.61 | 7.4e-05 |
| 218398_at | MRPS30 | 1.47 | 0.003 |
| 218654_s_at | MRPS33 | 1.35 | 0.01 |
| 203800_s_at | MRPS14 | 1.27 | 0.05 |
Figure 4. Mitochondrial ribosomal proteins (MRPs) are associated with poor clinical outcome in lung cancer patients.
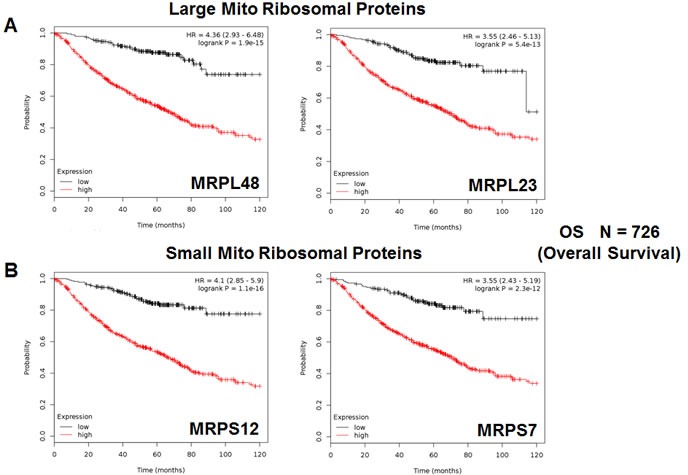
A. Note that high transcript levels of MRPL48 and MRPL23 predict significantly reduced overall survival. B. Similarly, high transcript levels of MRPS12 and MRPS7 predict significantly reduced overall survival.
We also assessed the prognostic value of members of the OXPHOS complexes I-V. These results are summarized in Table 5. Remarkably, 88 different gene probes for the OXPHOS complexes showed hazard-ratios between 4.46 and 1.39. COX5B (complex IV) had the best prognostic value (HR = 4.46; p = 5.3e-15). NDUFB3 (complex I) also showed significant prognostic value (HR = 4.30; p = 3.6e-15). Kaplan-Meier curves for members of complex I and II are shown in Figure 5A & 5B, while results with members of complex III and IV are shown in Figure 6A & 6B. Results with complex V are shown in Figure 7.
Table 5. Prognostic Value of Mitochondrial OXPHOS Complexes.
| Gene Probe ID | Symbol | Hazard-Ratio | Log-Rank Test |
|---|---|---|---|
| Complex I (27 probes in total) | |||
| 203371_s_at | NDUFB3 | 4.30 | 3.6e-15 |
| 203189_s_at | NDUFS8 | 4.15 | 4.4e-16 |
| 203190_at | NDUFS8 | 2.94 | 2.1e-11 |
| 209303_at | NDUFS4 | 3.83 | 1.1e-15 |
| 218484_at | NDUFA4L2 | 3.33 | 2.1e-13 |
| 218226_s_at | NDUFB4 | 3.21 | 1.8e-14 |
| 220864_s_at | NDUFA13 | 3.00 | 9.5e-11 |
| 202941_at | NDUFV2 | 3.00 | 1.3e-13 |
| 201740_at | NDUFS3 | 2.92 | 1.2e-11 |
| 217860_at | NDUFA10 | 2.77 | 3e-14 |
| 218563_at | NDUFA3 | 2.23 | 1.9e-10 |
| 214241_at | NDUFB8 | 2.23 | 1.5e-09 |
| 218201_at | NDUFB2 | 2.21 | 1.2e-08 |
| 215850_s_at | NDUFA5 | 1.83 | 3.6e-07 |
| 202785_at | NDUFA7 | 1.81 | 3e-07 |
| 202298_at | NDUFA1 | 1.72 | 3e-06 |
| 201966_at | NDUFS2 | 1.70 | 6.6e-06 |
| 202839_s_at | NDUFB7 | 1.64 | 0.0009 |
| 201757_at | NDUFS5 | 1.64 | 4.3e-05 |
| 209224_s_at | NDUFA2 | 1.59 | 6.6e-05 |
| 208969_at | NDUFA9 | 1.56 | 0.0002 |
| 211752_s_at | NDUFS7 | 1.50 | 0.0007 |
| 203613_s_at | NDUFB6 | 1.49 | 0.0009 |
| 209223_at | NDUFA2 | 1.49 | 0.0009 |
| 218320_s_at | NDUFB11 | 1.48 | 0.001 |
| 218200_s_at | NDUFB2 | 1.48 | 0.001 |
| 208714_at | NDUFV1 | 1.44 | 0.002 |
| Complex II (5 probes in total) | |||
| 216591_s_at | SDHC | 4.27 | 7.8e-16 |
| 202004_x_at | SDHC | 3.64 | 4e-14 |
| 210131_x_at | SDHC | 3.45 | 4.2e-14 |
| 202675_at | SDHB | 2.06 | 7.4e-07 |
| 214166_at | SDHB | 1.94 | 2.5e-08 |
| Complex III (8 probes in total) | |||
| 201568_at | UQCR7 | 3.34 | 3.7e-13 |
| 209066_x_at | UQCR6 | 2.96 | 2.5e-10 |
| 202233_s_at | UQCR8 | 2.09 | 5.9e-07 |
| 208909_at | UQCRFS1 | 1.69 | 2.6e-05 |
| 201066_at | UQCR4/CYC1 | 1.54 | 0.0006 |
| 207618_s_at | BCS1L | 1.54 | 0.0003 |
| 205849_s_at | UQCR6 | 1.48 | 0.0008 |
| 202090_s_at | UQCR | 1.45 | 0.004 |
| Complex IV (19 probes in total) | |||
| 211025_x_at | COX5B | 4.46 | 5.3e-15 |
| 202343_x_at | COX5B | 3.97 | 1.1e-16 |
| 213735_s_at | COX5B | 2.15 | 9.6e-10 |
| 213736_at | COX5B | 1.51 | 0.0015 |
| 200925_at | COX6A | 3.94 | 1.1e-16 |
| 201119_s_at | COX8A | 3.78 | 2.4e-15 |
| 203880_at | COX17 | 3.55 | 3.9e-15 |
| 201754_at | COX6C | 3.24 | 1.8e-14 |
| 217249_x_at | COX7A2 | 3.05 | 3.3e-13 |
| 201441_at | COX6B | 2.93 | 3.8e-12 |
| 206353_at | COX6A2 | 2.77 | 1.8e-11 |
| 203858_s_at | COX10 | 2.44 | 1.3e-09 |
| 202110_at | COX7B | 2.29 | 2.5e-12 |
| 216003_at | COX10 | 2.18 | 1.8e-07 |
| 221550_at | COX15 | 2.09 | 1.5e-10 |
| 217451_at | COX5A | 2.01 | 9e-06 |
| 218057_x_at | COX4NB | 1.54 | 0.0008 |
| 204570_at | COX7A | 1.51 | 0.0015 |
| 202698_x_at | COX4I1 | 1.39 | 0.01 |
| Complex V (23 probes in total) | |||
| 202961_s_at | ATP5J2 | 4.38 | 1.3e-14 |
| 207507_s_at | ATP5G3 | 4.14 | <1e-17 |
| 207508_at | ATP5G3 | 2.34 | 1.6e-13 |
| 210149_s_at | ATP5H | 3.70 | 3.7e-15 |
| 209492_x_at | ATP5I | 3.33 | 7.7e-13 |
| 207335_x_at | ATP5I | 2.14 | 2e-08 |
| 203926_x_at | ATP5D | 3.02 | 2.7e-11 |
| 213041_s_at | ATP5D | 2.41 | 3.1e-10 |
| 208764_s_at | ATP5G2 | 2.75 | 2.9e-10 |
| 207552_at | ATP5G2 | 2.55 | 4.3e-09 |
| 217368_at | ATP5G2 | 1.85 | 4.9e-07 |
| 217801_at | ATP5E | 2.62 | 2e-09 |
| 210453_x_at | ATP5L | 2.56 | 1.8e-11 |
| 207573_x_at | ATP5L | 2.25 | 1.9e-10 |
| 208746_x_at | ATP5L | 2.10 | 7.4e-10 |
| 201322_at | ATP5B | 1.88 | 1.5e-07 |
| 206992_s_at | ATP5S | 1.88 | 2.9e-07 |
| 206993_at | ATP5S | 1.85 | 2.1e-07 |
| 208972_s_at | ATP5G | 1.87 | 5.4e-08 |
| 221677_s_at | ATP5O | 1.71 | 6.8e-06 |
| 208870_x_at | ATP5C | 1.54 | 0.0008 |
| 205711_x_at | ATP5C | 1.42 | 0.004 |
| 213366_x_at | ATP5C | 1.40 | 0.007 |
Figure 5. Mitochondrial complex I and II proteins are associated with poor clinical outcome in lung cancer patients.
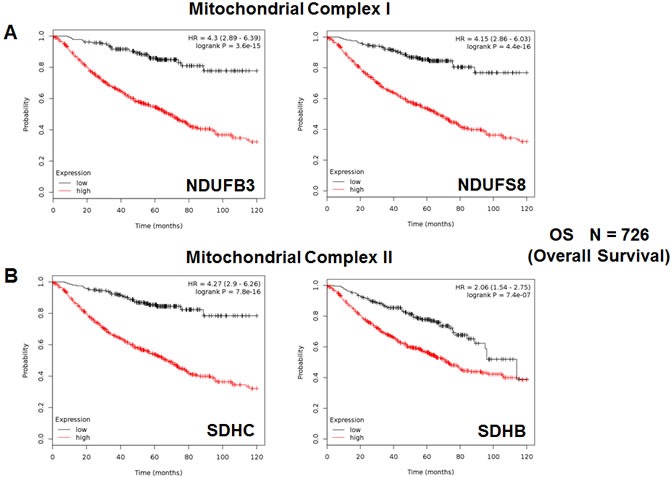
A. Note that high levels of NDUFB3 and NDUFS8 predict significantly reduced overall survival. B. Similarly, high levels of SDHC and SDHB predict significantly reduced overall survival.
Figure 6. Mitochondrial complex III and IV proteins are associated with poor clinical outcome in lung cancer patients.
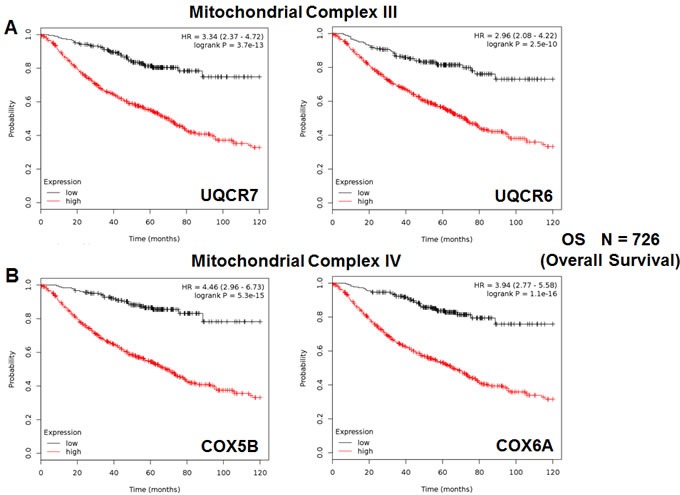
A. Note that high levels of UQCR7 and UQCR6 predict significantly reduced overall survival. B. Similarly, high levels of COX5B and COX6A predict significantly reduced overall survival.
Figure 7. Mitochondrial complex V proteins are associated with poor clinical outcome in lung cancer patients.
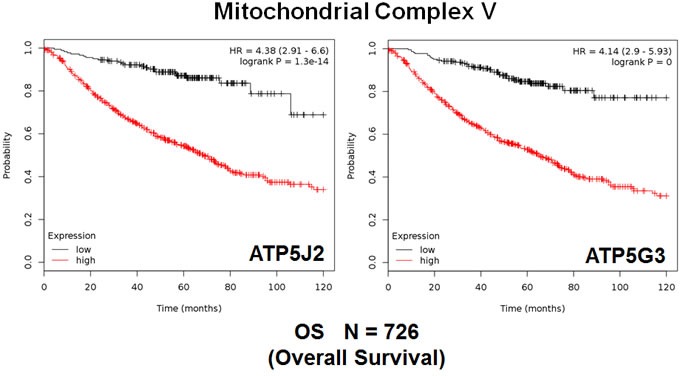
Note that high levels of ATP5J2 and ATP5G3 predict significantly reduced overall survival.
Mitochondrial genes have predictive value in both “smoking” and “non-smoking” patient populations: overall survival and tumor progression
In order to further test the prognostic power of these individual mitochondrial biomarkers, we next selected the most promising one, HSPD1, and assessed its ability to predict tumor progression in the whole patient population (N = 726). Importantly, Figure 8 shows that the levels of HSPD1 effectively predict time to tumor progression and post-progression survival, with hazard ratios of 3.28 and 1.88, respectively.
Figure 8. The mitochondrial chaperone, HSPD1, predicts tumor progression in lung cancer patients.
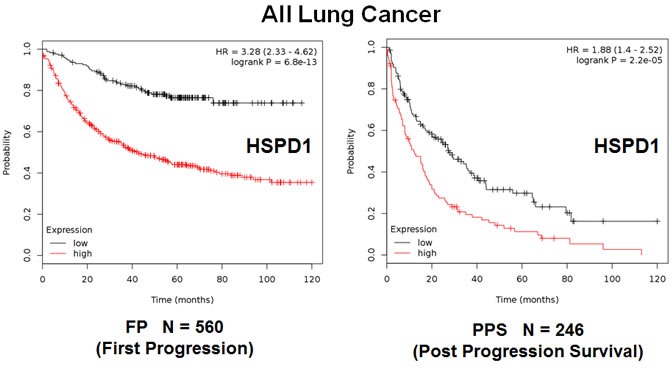
Note that the levels HSPD1 effectively predict time to first progression (Left panel) and post-progression survival (Right panel).
A similar analysis was also carried out when the patient population was sub-divided into smokers (N = 464) and non-smokers (N = 160) (Figures 9 and 10). Using this approach, HSPD1 showed increased prognostic power in the non-smoking patient population, reaching a hazard-ratio of 5.9 for overall survival; however, HSPD1 still retained its prognostic value in the smoking patient population (Figures 9A and 10A).
Figure 9. The mitochondrial chaperone, HSPD1, predicts poor clinical outcome and tumor progression in lung cancer patients: Smokers.
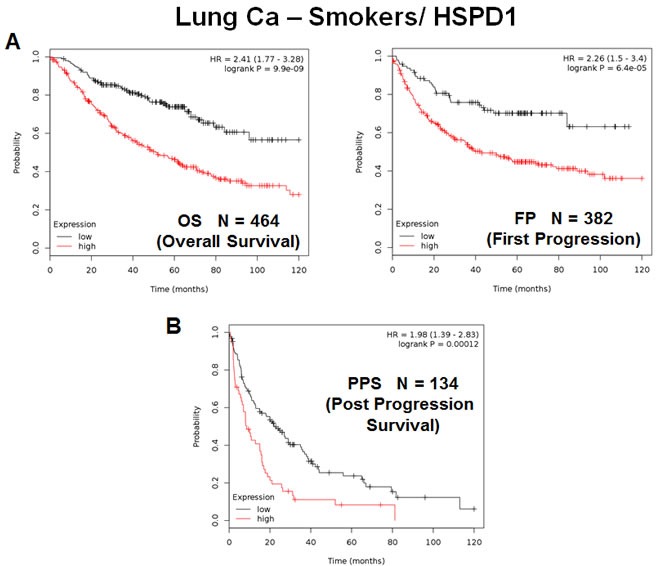
Note that the levels HSPD1 effectively predict overall survival A., as well as time to first progression and post-progression survival B., in the “smoking” patient population.
Figure 10. The mitochondrial chaperone, HSPD1, predicts poor clinical outcome and tumor progression in lung cancer patients: Non-Smokers.
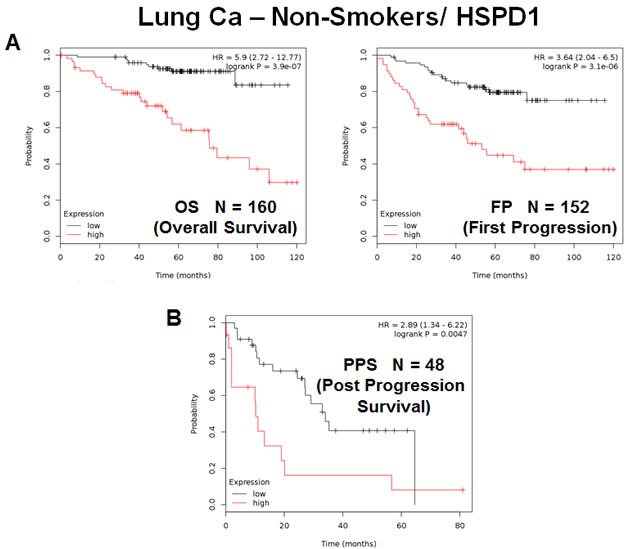
Note that the levels HSPD1 effectively predict overall survival A., as well as time to first progression and post-progression survival B., in the “non-smoking” patient population.
In this context, this trend was also true for tumor progression, as HSPD1 was a better predictor of time to tumor progression and post-progression survival in non-smokers (Figures 9B and 10B), with hazard-ratios of 3.64 and 2.89, respectively.
Thus, the mitochondrial chaperone, HSPD1, is an effective predictive biomarker of overall survival and tumor progression, in both smokers and non-smokers as well.
DISCUSSION
Linking CSC propagation with telomerase activity and mitochondrial function: Targeting CSCs with doxycycline and/or palbociclib
Recently, we determined the functional role of telomerase activity in lung cancer stem cell (CSC) propagation. More specifically, we indirectly monitored telomerase activity, by linking the hTERT-promoter to eGFP [4, 5]. Using A549 lung cancer cells, stably-transfected with the hTERT-GFP reporter, we then used GFP-expression fluorescence intensity to fractionate these cell lines into GFP-high and GFP-low cell populations. We functionally compared the phenotype of these GFP-high and GFP-low cell sub-populations. Importantly, we directly demonstrated that cancer cells with higher telomerase activity (GFP-high) are energetically-activated, with increased mitochondrial function and increased glycolysis. This was directly confirmed by proteomics analysis. Cells with high telomerase activity showed increased stem cell activity (measured via 3D-spheroid formation) and an increased capacity for cell migration (measured with a Boyden-chamber). These phenotypes were blocked by inhibitors of energy-metabolism, which targeted either mitochondrial OXPHOS or glycolysis, or by using doxycycline, an FDA-approved antibiotic, that inhibits mitochondrial biogenesis as an off-target effect [4, 5].
The levels of telomerase activity also determined the ability of hTERT-high CSCs to proliferate, as assessed by measuring DNA synthesis [4, 5]. Treatment with Palbociclib, an FDA-approved CDK4/6 inhibitor specifically blocked the propagation of lung CSCs, at concentrations in the nanomolar range. Therefore, telomerase-high CSCs are among the most energetically activated, migratory and proliferative cell sub-populations. These observations may provide a mechanistic explanation for why long telomere length [6–9] (a surrogate marker of increased telomerase activity) is specifically associated with metastasis and poor clinical outcome in NSC lung cancer and many other tumor types. Thus, high telomerase activity may drive poor clinical outcome by activating mitochondrial biogenesis, “fueling” the proliferation in lung CSCs [4, 5].
Using mitochondrial markers as companion diagnostics in NSCLC patients: Importance for treatment stratification and personalized medicine
Consistent with this novel hypothesis linking high telomerase activity with enhanced mitochondrial function, we show here that mitochondrial markers effectively predict poor overall survival in lung cancer patients, with negative surgical margins. Importantly, these mitochondrial markers could now be used to identify high-risk lung cancer patients at diagnosis, up to 10 years in advance. These results also suggest that mitochondria should be therapeutically-targeted in epithelial lung cancer cells to significantly extend patient survival.
In this workflow, high-risk patients should be first identified at diagnosis by the high expression of mitochondrial markers in their primary lung tumors (Figure 11). Then, these patients could be treated with FDA-approved therapeutics (e.g., Doxycycline or Palbociclib; in combination with the standard of care), to improve poor overall survival. Importantly, both of these drugs have already been shown to be effective against the propagation of the lung CSC sub-population.
Figure 11. NSC lung cancer: mitochondrial-based diagnostics for personalized cancer therapy.
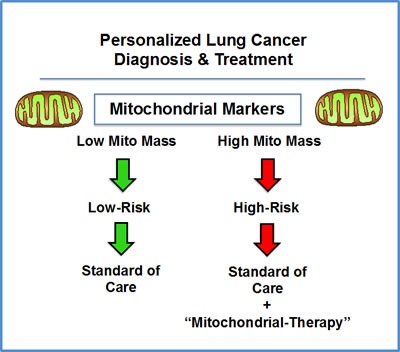
In this diagram, mitochondrial-based diagnostics would be used to separate lung cancer patients into high-risk and low-risk groups. Then, patients with high levels of mitochondrial markers in their primary tumor (“bad prognosis”) would be treated with mitochondrial-based therapies (such as “Doxycycline”), as an add-on to the standard of care, to prevent tumor progression and increase overall survival.
In this context, these mitochondrial markers could also be used as effective companion diagnostics for new experimental therapeutics targeting either mitochondria or telomerase (hTERT) and/or cell proliferation, to select the high-risk lung cancer patient sub-group, allowing proper treatment stratification.
MATERIALS AND METHODS
Kaplan-Meier (K-M) analyses
To perform K-M analysis on nuclear mitochondrial gene transcripts, we used an open-access online survival analysis tool to interrogate publically available microarray data from up to 1,926 lung cancer patients [3]. This allowed us to determine their overall prognostic value. For this purpose, we primarily analyzed 10-year follow-up data from non-small cell lung cancer (NSCLC) patients that had negative surgical margins (N = 726) [3]. Biased array data were excluded from the analysis. This allowed us to identify > 180 nuclear mitochondrial gene probes, with significant prognostic value. Hazard-ratios were calculated, at the best auto-selected cut-off, and p-values were calculated using the logrank test and plotted in R. K-M curves were also generated online using the K-M-plotter (as high-resolution TIFF files), using univariate analysis:
http://kmplot.com/analysis/index.php?p = service&cancer = lung.
This allowed us to directly perform in silico validation of these mitochondrial biomarker candidates. The most updated version of the database (2015) was utilized for all these analyses.
Acknowledgments
It should be noted that this bioinformatics analysis, focused on nuclear-encoded mitochondrial-related gene transcripts, was not funded by a specific grant and did not require any research expenditures, since no “wet” laboratory experiments were performed.
Abbreviations
- CSCs
cancer stem-like cells
- FP
first progression
- HR
hazard ratio
- K-M
Kaplan-Meier
- LN
lymph node
- MRPL
mitochondrial ribosomal proteins, large subunit
- MRPS
mitochondrial ribosomal proteins, small subunit
- N
number of patients in a given data set
- NSCLC
non-small cell lung cancer
- OS
overall survival
- OXPHOS
oxidative phosphorylation (mitochondrial respiration)
- PPS
post progression survival
Footnotes
Author contributions
Professor Lisanti (MPL) and Dr. Sotgia (FS) conceived and initiated this project. Professor Lisanti and Dr. Sotgia both performed the bioinformatics analysis, and wrote the manuscript.
CONFLICTS OF INTEREST
MPL and FS hold a minority interest in Lunella, Inc.
REFERENCES
- 1.Yoon SM, Shaikh T, Hallman M. Therapeutic management options for stage III non-small cell lung cancer. World J Clin Oncol. 2017;8:1–20. doi: 10.5306/wjco.v8.i1.1. [DOI] [PMC free article] [PubMed] [Google Scholar]
- 2.Xiong Y, Huang BY, Yin JY. Pharmacogenomics of platinum-based chemotherapy in non-small cell lung cancer: focusing on DNA repair systems. Med Oncol. 2017;34:48. doi: 10.1007/s12032-017-0905-6. [DOI] [PubMed] [Google Scholar]
- 3.Gyorffy B, Surowiak P, Budczies J, Lanczky A. Online survival analysis software to assess the prognostic value of biomarkers using transcriptomic data in non-small-cell lung cancer. PLoS One. 2013;8:e82241. doi: 10.1371/journal.pone.0082241. [DOI] [PMC free article] [PubMed] [Google Scholar]
- 4.Bonuccelli G, Peiris-Pages M, Ozsvari B, Martinez-Outschoorn UE, Sotgia F, Lisanti MP. Targeting cancer stem cell propagation with palbociclib, a CDK4/6 inhibitor: Telomerase drives tumor cell heterogeneity. Oncotarget. 2017;8:9868–84. doi: 10.18632/oncotarget.14196. https://doi.org/10.18632/oncotarget.14196 [DOI] [PMC free article] [PubMed] [Google Scholar]
- 5.Lamb R, Ozsvari B, Bonuccelli G, Smith DL, Pestell RG, Martinez-Outschoorn UE, Clarke RB, Sotgia F, Lisanti MP. Dissecting tumor metabolic heterogeneity: Telomerase and large cell size metabolically define a sub-population of stem-like, mitochondrial-rich, cancer cells. Oncotarget. 2015;6:21892–905. doi: 10.18632/oncotarget.5260. https://doi.org/10.18632/oncotarget.5260 [DOI] [PMC free article] [PubMed] [Google Scholar]
- 6.Telomeres Mendelian Randomization Collaboration. Haycock PC, Burgess S, Nounu A, Zheng J, Okoli GN, Bowden J, Wade KH, Timpson NJ, Evans DM, Willeit P, Aviv A, Gaunt TR, et al. Association Between Telomere Length and Risk of Cancer and Non-Neoplastic Diseases: A Mendelian Randomization Study. JAMA Oncol. 2017 Feb 23; doi: 10.1001/jamaoncol.2016.5945. [Epub ahead of print] [DOI] [PMC free article] [PubMed] [Google Scholar]
- 7.Svenson U, Roos G, Wikström P. Long leukocyte telomere length in prostate cancer patients at diagnosis is associated with poor metastasis-free and cancer-specific survival. Tumour Biol. 2017;39:1010428317692236. doi: 10.1177/1010428317692236. [DOI] [PubMed] [Google Scholar]
- 8.Marión RM, López de Silanes I, Mosteiro L, Gamache B, Abad M, Guerra C, Megías D, Serrano M, Blasco MA. Common Telomere Changes during In Vivo Reprogramming and Early Stages of Tumorigenesis. Stem Cell Reports. 2017;8:460–75. doi: 10.1016/j.stemcr.2017.01.001. [DOI] [PMC free article] [PubMed] [Google Scholar]
- 9.Lv Y, Zhang Y, Li X, Ren X, Wang M, Tian S, Hou P, Shi B, Yang Q. Long telomere length predicts poor clinical outcome in esophageal cancer patients. Pathol Res Pract. 2017;213:113–18. doi: 10.1016/j.prp.2016.11.010. [DOI] [PubMed] [Google Scholar]


