

In budding yeast, signals generated in response to membrane growth are required for cell cycle progression. A mass spectrometry screen for signals triggered by an arrest of membrane growth identified sphingolipid signaling pathways. Delivery of sphingolipids to the plasma membrane could generate signals that control cell growth and the cell cycle.
Abstract
In budding yeast, cell cycle progression and ribosome biogenesis are dependent on plasma membrane growth, which ensures that events of cell growth are coordinated with each other and with the cell cycle. However, the signals that link the cell cycle and ribosome biogenesis to membrane growth are poorly understood. Here we used proteome-wide mass spectrometry to systematically discover signals associated with membrane growth. The results suggest that membrane trafficking events required for membrane growth generate sphingolipid-dependent signals. A conserved signaling network appears to play an essential role in signaling by responding to delivery of sphingolipids to the plasma membrane. In addition, sphingolipid-dependent signals control phosphorylation of protein kinase C (Pkc1), which plays an essential role in the pathways that link the cell cycle and ribosome biogenesis to membrane growth. Together these discoveries provide new clues as to how growth-dependent signals control cell growth and the cell cycle.
INTRODUCTION
Cell growth is one of the most fundamental features of life, yet it remains poorly understood. Growth is the outcome of multiple processes, including ribosome biogenesis and plasma membrane expansion, that must be precisely coordinated. Numerous questions regarding growth remain unanswered: How are plasma membrane growth and ribosome biogenesis coordinated? How is the rate of growth matched to nutrient availability? How is the amount and location of growth during the cell cycle controlled to maintain a constant size and shape?
In budding yeast, entry into mitosis and ribosome biogenesis are dependent on plasma membrane growth, which could ensure that growth processes are coordinated with each other and with the cell cycle (Mizuta and Warner, 1994; Li et al., 2000; Nanduri and Tartakoff, 2001; Anastasia et al., 2012; McCusker and Kellogg, 2012). The linkage was discovered by analyzing the effects of mutants that block membrane trafficking events required for plasma membrane growth. Thus inactivation of Sec6, which is required for the fusion of vesicles with the plasma membrane, causes an arrest of ribosome biogenesis, as well as a premitotic cell cycle arrest. Both pathways signal via a member of the protein kinase C family (Pkc1) that is localized to sites of membrane growth in the daughter bud. Thus it is possible that key aspects of cell growth are controlled by common signals originating at sites of membrane growth.
The pathway that links mitotic entry to membrane growth has been proposed to control the amount of polar growth that occurs between bud emergence and entry into mitosis, which would influence both cell size and shape (Anastasia et al., 2012). In this model, the vesicles that drive polar membrane growth are thought to deliver signaling molecules that activate Pkc1. As more vesicles fuse with the plasma membrane, a Pkc1-dependent signal would be generated that is proportional to growth, which could be read to determine when sufficient polar growth has occurred. Pkc1 undergoes gradual hyperphosphorylation during polar membrane growth that is dependent on and proportional to growth, consistent with the idea that it is part of a mechanism that measures polar membrane growth (Anastasia et al., 2012). Growth-dependent signaling suggests a simple and broadly relevant mechanism for control of cell growth and size (Enciso et al., 2014).
The broad outlines of the pathway that links mitotic entry to membrane growth are known. Signaling is dependent on the Rho1 GTPase, which is delivered to the site of polar growth on vesicles (Abe et al., 2003; Anastasia et al., 2012). Rho1 is activated at the site of growth, where it is thought to bind and activate Pkc1 (Kamada et al., 1996; Abe et al., 2003). Pkc1 binds redundant paralogues called Zds1 and Zds2 that recruit PP2A associated with the Cdc55 regulatory subunit (PP2ACdc55). Pkc1 activates PP2ACdc55, which then activates Mih1, the budding yeast homologue of the Cdc25 phosphatase that drives entry into mitosis by removing Cdk1 inhibitory phosphorylation. Activation of mitotic Cdk1 triggers cessation of polar growth and initiation of isotropic growth that occurs over the entire surface of the bud (Lew and Reed, 1993). Rho1, Pkc1, Zds1/2, and PP2ACdc55 are localized to the site of polar membrane growth and physically interact, providing a direct link between membrane growth and mitotic entry (Yamochi et al., 1994; Kamada et al., 1996; Andrews and Stark, 2000; Rossio and Yoshida, 2011).
A full understanding of how the cell cycle is linked to membrane growth requires a better understanding of the signals generated at sites of membrane growth. A critical question concerns how membrane growth drives phosphorylation and activation of Pkc1. Previous work suggested that the GTP-bound form of Rho1 generated at sites of growth could play a role (Nonaka et al., 1995; Kamada et al., 1996). However, we have thus far been unable to reconstitute hyperphosphorylation of Pkc1 in vitro with purified Rho1-GTP, which suggests that additional signals play a role.
Here we used proteome-wide mass spectrometry to systematically identify signals associated with membrane growth. To do this, we took advantage of our discovery that Pkc1-dependent signaling rapidly collapses when membrane growth is blocked (Anastasia et al., 2012). Thus we used proteome-wide mass spectrometry to identify proteins that undergo rapid changes in phosphorylation in response to an arrest of membrane growth.
RESULTS AND DISCUSSION
Proteome-wide analysis of signals triggered by an arrest of polarized membrane growth
To identify signals triggered by an arrest of polar membrane growth, we released wild-type and sec6-4 cells from a G1 arrest and shifted to the restrictive temperature during the polar bud growth phase, which corresponds to the interval of bud growth before mitotic entry. Samples for mass spectrometry were taken 5 min after inactivation of sec6-4. Western blotting was used to confirm that the wild-type and sec6-4 cells were at the same point in the cell cycle and that inactivation of sec6-4 caused rapid loss of Pkc1 phosphorylation, as previously observed (Anastasia et al., 2012). Proteolytic peptides from each strain were phospho-enriched, covalently modified by reductive dimethylation to generate light (wild type) and heavy (sec6-4) stable isotope labeled pools, and then combined and analyzed by liquid chromatography–tandem mass spectrometry (LC-MS/MS) (Villén and Gygi, 2008; Kettenbach and Gerber, 2011). The heavy-to-light ratios of phosphorylated peptides in sec6-4 cells versus wild-type cells were log2 transformed. Thus negative values indicate decreased phosphorylation in sec6-4 cells, while positive values indicate increased phosphorylation. Three biological replicates were analyzed, which allowed calculation of average log2 ratios and SDs for most peptides.
The complete data set contains >75,000 spectral matches filtered to <0.1% peptide false discovery rate (FDR) and 1% protein FDR using the target-decoy approach (see Materials and Methods). Supplemental Table S1 presents a summary of all identified phosphorylation sites with quantitative data. Supplemental Table S2 provides detailed information for each of the detected phosphopeptides. A total of 9375 sites were identified on 1831 proteins. Of these, 6375 sites on 1694 proteins could be quantified. The overlap of quantified sites between the three biological replicates is shown in Supplemental Figure 1.
We focused on sites that were quantified in at least two of the three biological replicates, which comprised 4485 sites on 1520 proteins. Within this set, we focused on sites with a median log2 ratio greater than 1.2 in either direction. At this arbitrary threshold, 69 sites on 58 proteins appeared to undergo rapid dephosphorylation when sec6-4 was inactivated (Supplemental Table S3). A total of 63 sites on 57 proteins appeared to undergo an increase in phosphorylation (Supplemental Table S4). Both Pkc1 and Zds1 were detected as undergoing dephosphorylation in sec6-4 cells (Supplemental Table S3). Since these proteins were previously shown to undergo dephosphorylation after inactivation of Sec6, their presence in the data provides evidence that the approach can identify relevant proteins (Anastasia et al., 2012). Inactivation of Sec6 may cause effects that are independent of its role in membrane growth. For simplicity, however, we refer to the effects of inactivating Sec6 as a block to membrane growth. In addition, although proteome-wide mass spectrometry provides a valuable roadmap for further investigation, the implications of changes in the occupancy of uncharacterized phosphorylation sites must be interpreted with caution.
Blocking membrane traffic disrupts a signaling network that controls cell growth
We searched the mass spectrometry data for proteins that were previously linked to cell growth and discovered that multiple components of a target of rapamycin complex 2 (TORC2) signaling network undergo changes in phosphorylation in response to an arrest of membrane growth (Supplemental Tables S3 and S4). The TORC2 network controls a pair of partially redundant kinase paralogues called Ypk1 and Ypk2, which are homologues of vertebrate SGK (Casamayor et al., 1999). Extensive work has shown that TORC2 and Ypk1/2, as well as their surrounding signaling network, play roles in controlling cell growth, lipid synthesis, and cell cycle progression. In addition, multiple previous studies have suggested that TORC2 and Ypk1/2 control Rho1/Pkc1 signaling (Helliwell et al., 1998; Roelants et al., 2002; Schmelzle et al., 2002; Kamada et al., 2005; Niles and Powers, 2014; Hatakeyama et al., 2017).
Figure 1A provides an overview of the TORC2-Ypk1/2 network, with proteins identified by mass spectrometry highlighted in red. Ypk1/2 are phosphorylated by TORC2 and phosphoinositide-dependent kinase 1 (PDK1), which play conserved roles in controlling cell growth (Roelants et al., 2002; Kamada et al., 2005). In budding yeast there are two redundant homologues of PDK1 called Pkh1 and Pkh2. TORC2 and Pkh1/2 phosphorylate distinct sites on Ypk1/2 that are thought to increase activity.
FIGURE 1:

(A) Proteins in the TORC2-Ypk1/2 signaling network that showed a large change in phosphorylation upon growth arrest are highlighted in red. (B)YPK1-6xHA cells with or without the sec6-4 allele were released from G1 arrest at 22°C and shifted to 34°C after 60 min (when cells reached ∼50% budding). Ypk1-6xHA phosphorylation was assayed by Western blot. The same blot was probed for Nap1 to provide a loading control. (C) YPK1-6xHA sec6-4 cells were released from G1 arrest at 22°C and shifted to 34°C after 60 min (when cells reached ∼50% budding). Phytosphingosine (10 µM) was added to half of the culture (+) immediately before the 60 min time point. Ypk1 phosphorylation was assayed by Western blot. The slight increase in electrophoretic mobility of Ypk1-6XHA immediately after addition of phytosphingosine at 60 min was also observed in wild-type control cells, where it disappeared within 5 min (not shown). The reason for the transient change in electrophoretic mobility is unknown. The same blot was probed for Nap1 to provide a loading control. (D) Cells with or without the sec6-4 allele were released from G1 arrest at 22°C and shifted to 34°C after 45 min (when ∼10% of cells had buds). TORC2-dependent phosphorylation of Ypk1-T662P was assayed by Western blot with a phosphospecific polyclonal antibody that recognizes TORC2 sites on Ypk1 and Ypk2. A nonspecific background band that serves as a loading control is marked with an asterisk. (E) Flag-ORM2 cells with or without the sec6-4 allele were released from G1 arrest at 22°C and shifted to 34°C after the 45 min time point (when ∼10% of cells had buds). Flag-Orm2 phosphorylationwas assayed by running samples on a Phos-Tag gel followed by Western blot. Hyperphosphorylated forms of Orm2 are marked with an asterisk.
One function of the network is to modulate synthesis of sphingolipids, a diverse family of lipids that includes components of the plasma membrane, as well as lipids that play roles in signaling (Aronova et al., 2008; Dickson, 2008; Roelants et al., 2011; Muir et al., 2014). Sphingolipid synthesis is initiated at the endoplasmic reticulum by serine palmitoyltransferase (SPT), which synthesizes precursors for production of phytosphingosine and ceramides, which are used to produce complex sphingolipids in the Golgi. Complex sphingolipids are transported to the plasma membrane and together constitute ∼10% of membrane lipids (Ejsing et al., 2009; Klose et al., 2012). Ypk1/2 promote sphingolipid synthesis by phosphorylating and inhibiting Orm1 and Orm2, redundant paralogues that bind and inhibit SPT (Breslow et al., 2010; Roelants et al., 2011).
Ypk1/2 are also phosphorylated by a pair of redundant kinase paralogues called Fpk1 and Fpk2 that localize to the site of polar growth (Nakano et al., 2008; Roelants et al., 2010). Genetic data suggest that complex sphingolipids are required for Fpk1/2 activity, and that Fpk1/2 and Ypk1/2 inhibit each other (Roelants et al., 2010). Fpk1/2 also phosphorylate a redundant pair of lipid flippases called Dnf1 and Dnf2, which are located at the site of polar growth and are thought to flip phospholipids from the outer to inner leaflet of the plasma membrane (Hua et al., 2002; Pomorski et al., 2003; Nakano et al., 2008). Loss of FPK1/2 or DNF1/2 causes mild elongation of the daughter bud, which suggests that they play a role in controlling polar growth (Pomorski et al., 2003; Nakano et al., 2008).
Blocking membrane traffic causes reduced sphingolipid-dependent signaling
Multiple proteins in the TORC2-Ypk1/2 network underwent changes in phosphorylation in response to inactivation of Sec6, including Ypk1, Orm2, Dnf2, and Avo1, a component of the TORC2 complex (Supplemental Tables S3 and S4). All of these proteins regulate and/or respond to sphingolipids. To further investigate changes in the network, we first analyzed phosphorylation of Ypk1. Ypk1 undergoes Fpk1/2-dependent phosphorylation that causes a decrease in electrophoretic mobility that can be detected by Western blotting (Roelants et al., 2011). Inactivation of Sec6 caused loss of Fpk1/2-dependent phosphorylation of Ypk1, which suggests that blocking membrane traffic causes inactivation of Fpk1/2 (Figure 1B). Dnf2, a direct target of Fpk1/2, also showed a loss of phosphorylation in the mass spectrometry data, which provided further evidence for a loss of Fpk1/2 activity (Supplemental Table S3). Since Fpk1/2 activity is dependent on complex sphingolipids, these observations suggest that inactivation of Sec6 causes a decrease in sphingolipid-dependent signaling. Addition of exogenous phytosphingosine rescued the loss of Ypk1 phosphorylation caused by arresting growth, consistent with the idea that inactivation of Sec6 causes loss of sphingolipid-dependent signals (Figure 1C). The rescue faded over longer times, which suggests that the relevant signaling lipids are short-lived or transported to a location where they cannot influence Fpk1/2 activity.
Previous studies have suggested that loss of sphingolipids causes increased TORC2 activity (Roelants et al., 2011; Berchtold et al., 2012). Moreover, the mass spectrometry analysis found that Avo1, a component of the TORC2 complex, undergoes increased phosphorylation in response to an arrest of membrane growth (Supplemental Table S3). Since Avo1 is a target of TORC2, this observation suggests that TORC2 activity increases (Wullschleger et al., 2005). To test this, we assayed TORC2-dependent phosphorylation of Ypk1/2 using a phosphospecific antibody. Inactivation of Sec6 caused increased TORC2-dependent phosphorylation of Ypk1 (Figure 1D). We again observed that inactivation of Sec6 caused loss of the Fpk1/2-dependent mobility shift of Ypk1.
The site on Orm2 that was detected (threonine 18) was previously identified as a likely Ypk1/2 target (Breslow et al., 2010; Roelants et al., 2010, 2011). The mass spectrometry data suggested that Orm2 is dephosphorylated when Sec6 is inactivated (Supplemental Table S4). To investigate further, we used Phos-tag gels and Western blotting to assay Orm2 phosphorylation after inactivation of Sec6. In contrast to expectations from the mass spectrometry data, Orm2 was rapidly hyperphosphorylated when Sec6 was inactivated, which suggests that Ypk1/2 become more active (Figure 1E). The disagreement between the mass spectrometry and Western blotting data may be a product of the complexity of phosphopeptide analysis. Phosphosites on Orm1/2 are located close to each other, such that multiple sites are found on the same proteolytic peptide. If a singly phosphorylated peptide is converted to a multiply phosphorylated peptide upon inactivation of Sec6, the analysis will detect a decrease in the abundance of the singly phosphorylated peptide, giving the appearance of a dephosphorylation event.
The Orm1/2 proteins are also phosphorylated by the kinase Npr1. To test whether hyperphosphorylation of Orm2 was due to Ypk1/2, we utilized sec6-4 cells that are dependent on an analogue-sensitive allele of Ypk1 (sec6-4 ypk1-as ypk2∆), which allows rapid inactivation of Ypk1/2 with the inhibitor 3-MOB-PP1 (Sun et al., 2012). Inactivation of Ypk1/2 blocked hyperphosphorylation of Orm2 when membrane growth was blocked (Supplemental Figure 2A). In addition, a mutant version of Orm2 that lacks key sites phosphorylated by Ypk1/2 also failed to undergo hyperphosphorylation (Supplemental Figure 2B). Thus hyperphosphorylation of Orm2 in response to inactivation of Sec6 is dependent on Ypk1/2.
Since the Orm1/2 proteins are embedded in the membrane of the endoplasmic reticulum (Han et al., 2010), the discovery that they undergo rapid hyperphosphorylation in response to an arrest of plasma membrane growth suggests that there is rapid communication between the plasma membrane and the endoplasmic reticulum. Approximately 50% of the endoplasmic reticulum is closely associated with the plasma membrane, which would facilitate rapid communication (Pichler et al., 2001).
Previous work found that inhibition of the first step of sphingolipid synthesis causes inactivation of Fpk1/2, activation of both TORC2 and Ypk1/2, and hyperphosphorylation of Orm1/2 (Breslow et al., 2010; Roelants et al., 2011; Berchtold et al., 2012; Sun et al., 2012). Since hyperphosphorylation of Orm1/2 relieves inhibition of sphingolipid synthesis, the TORC2-Ypk1/2 network was proposed to monitor sphingolipid synthesis to maintain sphingolipid homeostasis (Breslow et al., 2010). However, the mechanism by which sphingolipid synthesis influences signaling in the network has remained unknown. Here we found that blocking traffic to the plasma membrane causes effects identical to those caused by inhibition of sphingolipid synthesis. In addition, although inactivation of Sec6 caused hyperphosphorylation of Orm2, which should stimulate sphingolipid synthesis at the endoplasmic reticulum, there was no evidence that increased sphingolipid synthesis was perceived by the network: TORC2-dependent phosphorylation of Ypk1/2 persisted, Fpk1/2 remained inactive, and Orm2 phosphorylation persisted. Together these observations suggest that the signaling network monitors delivery of sphingolipids to the plasma membrane by vesicles, rather than synthesis of sphingolipids at the endoplasmic reticulum.
A number of previous studies support the idea that sphingolipids influence signaling events at the plasma membrane. For example, TORC2 is localized to plasma membrane foci, so it is positioned to respond to signals at the plasma membrane (Berchtold and Walther, 2009). Furthermore, inhibition of sphingolipid synthesis triggers release of the Slm1 and Slm2 proteins from plasma membrane compartments called eisosomes (Berchtold et al., 2012). Slm1/2 promote TORC2-dependent activation of Ypk1/2 (Niles et al., 2012). Thus the localization of TORC2 and Slm1/2 and their behavior in response to inhibition of sphingolipid synthesis are consistent with the idea that they respond to sphingolipid-dependent signals at the plasma membrane. However, since the plasma membrane is closely associated with the endoplasmic reticulum, the localization and behavior of TORC2 and Slm1/2 alone would not rule out the possibility that they directly monitor synthesis of sphingolipids at the endoplasmic reticulum.
A model that could explain the data is that post-Golgi vesicles required for polar growth deliver sphingolipids to the plasma membrane. When vesicle delivery is blocked, sphingolipids at the plasma membrane rapidly decline, which could occur by modification or sequestration into lipid domains. Loss of sphingolipids, in turn, would lead to inactivation of Fpk1/2 and a consequent loss of Ypk1/2 and Dnf1/2 phosphorylation. A decrease in sphingolipids would also cause increased activity of TORC2, which stimulates Ypk1/2 to hyperphosphorylate Orm1/2.
The Ypk1/2 signaling network has also been proposed to respond to membrane stress (Berchtold et al., 2012). Thus, an alternative model is that blocking delivery of vesicles to the plasma membrane triggers membrane stress that activates the pathway.
Inactivation of Ypk1/2 causes a failure in Pkc1 phosphorylation that is rescued by exogenous sphingolipids
We next used ypk1-as ypk2∆ cells to test whether Ypk1/2 are required for normal hyperphosphorylation of Pkc1 during polar membrane growth. Since hyperphosphorylation of Pkc1 is dependent on and proportional to polar membrane growth, it provides a readout of signaling events associated with membrane growth. Wild-type control cells and ypk1-as ypk2∆ cells were released from G1 arrest and 3-MOB-PP1 was added to both cultures before cells had initiated bud emergence. Addition of inhibitor to ypk1-as ypk2∆ cells caused a failure in Pkc1 hyperphosphorylation (Figure 2A), as well as a failure in mitotic entry that was detected as a failure to produce the mitotic cyclin Clb2 (Figure 2B). It also caused delayed bud emergence (Figure 2C). In some experimental replicates, Pkc1 phosphorylation was strongly reduced, but not completely eliminated (see, for example, Figure 3A). The fact that bud emergence still occurred when Ypk1/2 were inhibited indicated that the failure in Pkc1 phosphorylation was not due simply to a failure in bud growth. To determine whether the delay in bud emergence was due to decreased Pkc1 activity, we expressed a constitutively active version of PKC1 (PKC1*) in ypk1-as ypk2∆ cells (Watanabe et al., 1994). We used basal expression from the uninduced CUP1 promoter to achieve low-level expression of PKC1* (Thai et al., 2017). Expression of PKC1* rescued the delay in bud emergence (Figure 2C). Together these observations suggest that inhibition of Ypk1/2 causes decreased phosphorylation of Pkc1, as well as decreased Pkc1 activity.
FIGURE 2:
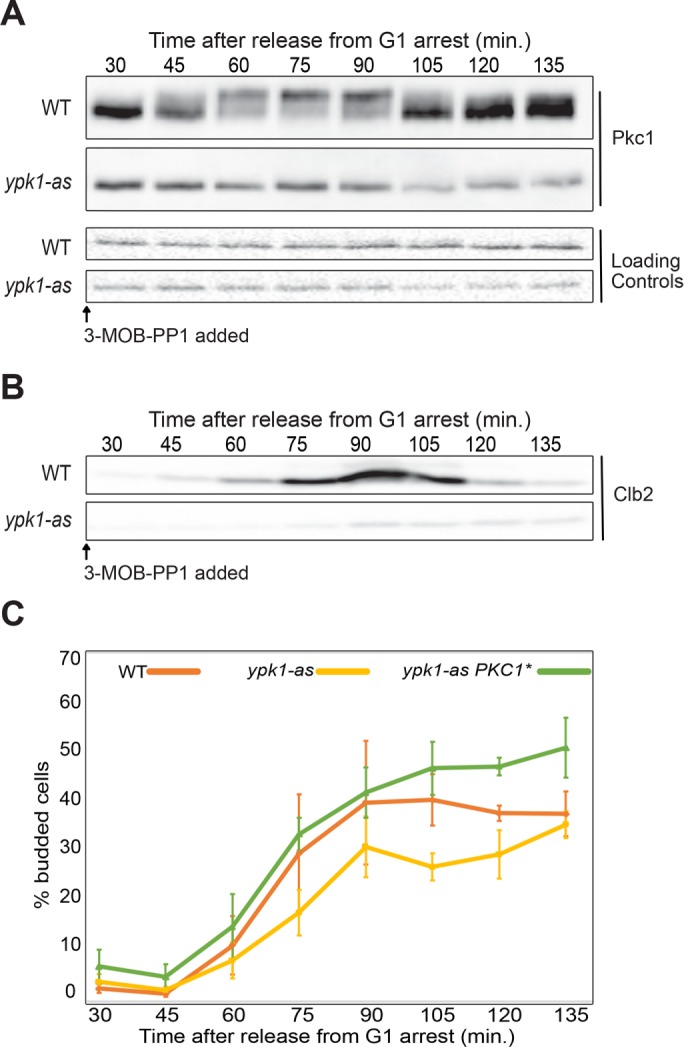
(A) The indicated cells were released from a G1 arrest at 25°C and 50 µM 3-MOB-PP1 was added to each strain at 10 min after release. Pkc1 phosphorylation was assayed by Western blot. A background band from the same blot was used as a loading control. (B) Western blot showing levels of the mitotic cyclin Clb2 from the same samples as panel A. (C) Cells were released from a G1 arrest at 25°C and 50 µM 3-MOB-PP1 was added at 10 min after release. The percentage of budded cells was determined by counting the budded cells in a total of at least 200 cells for each time point. The percentage of budded cells was averaged for three biological replicates. Error bars represent the standard error of the mean for three biological replicates.
FIGURE 3:

(A) ypk1-as ypk2∆ cells were released from a G1 arrest at 25°C and the indicated compounds were added at 10 min after release. Pkc1 phosphorylation was assayed by Western blot. A background band from the same blot was used as a loading control. (B) Fixed cells from the 120 minute time point of panel A were imaged by DIC microscopy. White bars are 8 µm. (C) Bud polarity of the imaged cells in B was determined by calculating the ratio of the bud length to width of buds for 50 cells and then plotting the average ratio. Error bars represent the standard error of the mean. The average polarity ratios were also converted to ovals whose relative shape can be directly compared.
Inhibition of Ypk1/2 should lead to decreased synthesis of sphingolipids due to hyperactivity of Orm1/2 (Breslow et al., 2010; Roelants et al., 2011; Sun et al., 2012). We therefore added exogenous phytosphingosine to test whether failure to phosphorylate Pkc1 when Ypk1/2 are inhibited is a consequence of decreased sphingolipid production. Addition of phytosphingosine largely restored hyperphosphorylation of Pkc1 when Ypk1/2 were inhibited before bud emergence (Figure 3A; compare the fraction of Pkc1 that reaches the fully hyperphosphorylated form).
The buds that emerged during Ypk1/2 inhibition were elongated (Figure 3B and Supplemental Figure 2C). Cell elongation was quantified by measuring the average ratio of bud length to width (Figure 3C). Addition of phytosphingosine largely eliminated the elongated bud phenotype (Figure 3, B and C). Previous studies showed that bud elongation can be a consequence of a decrease in the activities of Pkc1 or mitotic Cdk1 (Lew and Reed, 1993; Anastasia et al., 2012).
Although inhibition of Ypk1/2 in G1 phase blocked Pkc1 phosphorylation, inhibition of Ypk1/2 later in the cell cycle, during polar bud growth, did not cause loss of Pkc1 phosphorylation (Supplemental Figure 3A). Thus Pkc1 phosphorylation is independent of Ypk1/2 activity during polar growth. This observation suggests that Ypk1/2 are unlikely to control Pkc1 phosphorylation directly and that rapid dephosphorylation of Pkc1 caused by inactivation of Sec6 during polar bud growth is unlikely to be due to stimulation of the TORC2-Ypk1/2 network. Rather, Ypk1/2 could promote Pkc1 phosphorylation by stimulating production of sphingolipids earlier in the cell cycle.
Since the relationship between Pkc1 phosphorylation and Pkc1 kinase activity is poorly understood, the data do not establish whether sphingolipids promote Pkc1 activity. However, previous studies found that defects caused by inhibition of SPT can be suppressed by increased activity of Pkc1, which suggests that inhibition of sphingolipid synthesis leads to a failure to fully activate Pkc1 (Friant et al., 2000; Olson et al., 2015). There is also evidence that sphingolipids promote Pkc1 activity via activation of the Rho1 GTPase, although the underlying mechanisms remain largely unknown (Niles and Powers, 2014; Olson et al., 2015; Hatakeyama et al., 2017). Together the data suggest that sphingolipids promote Pkc1 activation, potentially by promoting Pkc1 phosphorylation.
Sphingolipids are also thought to regulate Pkh1/2, which directly phosphorylate Pkc1 on a site that stimulates its activity (Inagaki et al., 1999; Sun et al., 2000; Friant et al., 2001; Roelants et al., 2004; Liu et al., 2005). Since Pkh1/2 phosphorylate Pkc1 on a single site, they are unlikely to be directly responsible for the gradual multisite hyperphosphorylation of Pkc1 that occurs during polar membrane growth. However, Pkh1/2 could activate Pkc1 to undergo autophosphorylation. To test for a contribution of Pkh1/2, we utilized an analogue-sensitive allele of PKH1 in a pkh2∆ background (pkh1-as pkh2∆) (Sun et al., 2012). Inactivation of Pkh1/2 during polar growth caused a rapid and complete loss of Pkh1/2-dependent phosphorylation of Ypk1 but did not cause a loss of Pkc1 phosphorylation (Figure 4A). These results indicate that the rapid dephosphorylation of Pkc1 observed in response to an arrest of polar membrane growth is not likely to be caused by loss of Pkh1/2 activity. We also found that hyperphosphorylation of Pkc1 occurred normally in fpk1∆ fpk2∆ cells, which rules out a model in which loss of Pkc1 phosphorylation is due to loss of Fpk1/2 activity (Supplemental Figure 3B).
FIGURE 4:
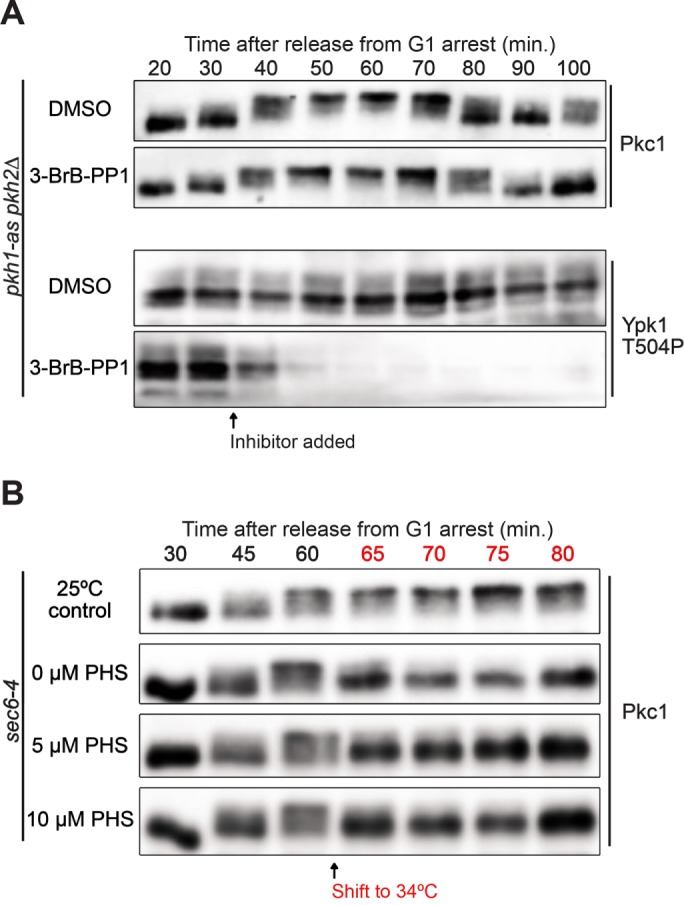
(A) pkh1-as pkh2∆ were released from a G1 arrest and dimethyl sulfoxide or 15 µM 3-BrB-PP1 was added at 30 min after release. Pkc1 phosphorylation was assayed by Western blot. Pkh1/2-dependent phosphorylation of Ypk1-T504 was assayed by Western blot using a phosphospecific antibody. Blots are from the same samples so timing can be directly compared. (B) sec6-4 cells were released from a G1 arrest at 25°C. At 60 min the culture was split into four aliquots and the indicated amounts of phytosphingosine were added to cultures shifted to 34°C. Pkc1 phosphorylation was assayed by Western blot.
Addition of exogenous phytosphingosine did not rescue loss of Pkc1 phosphorylation caused by inactivation of Sec6 (Figure 4B). This observation is consistent with a model in which vesicle-dependent delivery of sphingolipids to the plasma membrane is required for sphingolipids to influence Pkc1 phosphorylation. Alternatively, inactivation of Sec6 could cause Pkc1 to become mislocalized to a place where it can no longer be influenced by exogenous phytosphingosine.
Inhibition of sphingolipid production causes reduced phosphorylation of Pkc1
To further define the contribution of sphingolipids, we utilized a temperature sensitive allele of LCB1 (lcb1-100), which encodes an essential subunit of SPT (Meier et al., 2006). Inactivation of Lcb1 caused a decrease in Pkc1 hyperphosphorylation during polar growth, which could be seen as a failure to produce the most hyperphosphorylated forms of Pkc1 (Figure 5). Analysis of mitotic cyclin levels revealed that inactivation of Lcb1 also caused delayed mitotic entry and a prolonged mitosis (Figure 5). Cells budded when Lcb1 was inactivated so the delay was not due to a failure in bud growth. Addition of exogenous phytosphingosine partially rescued Pkc1 hyperphosphorylation and fully rescued the mitotic delay, which suggests that the effects of lcb1-100 were due at least partly to a failure to produce sphingolipids (Figure 5).
FIGURE 5:
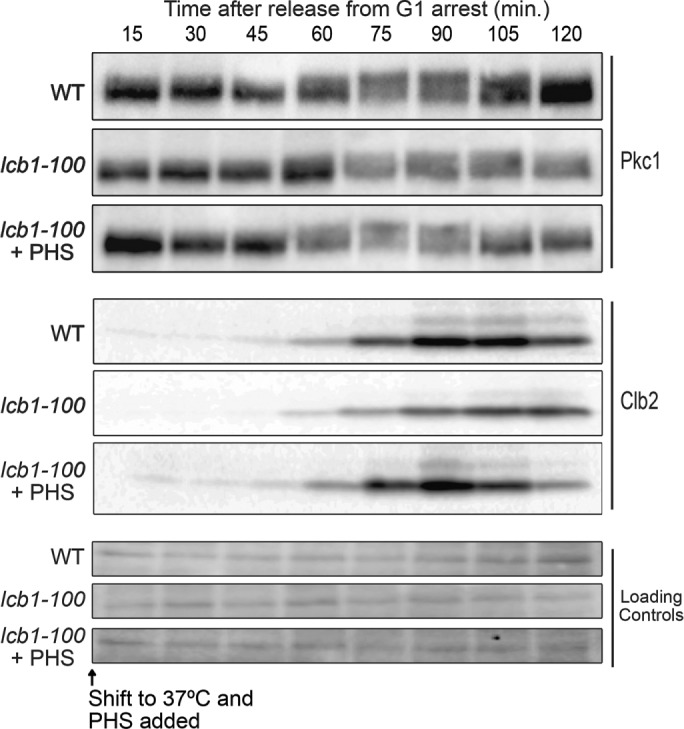
Wild-type and lcb1-100 cells were arrested in G1 at 30°C and released into media at a restrictive temperature (37°C) and 10 µM phytosphingosine was added 10 min after release from the arrest. Pkc1 phosphorylation and Clb2 protein levels were assayed by Western blot. A background band from the same blot was used as a loading control.
The behavior of Pkc1 in the lcb1-100 mutant presents a paradox: inhibition of Ypk1/2 caused a substantial loss of Pkc1 phosphorylation that was rescued by addition of phytosphingosine; however, the lcb1-100 mutant caused only a partial loss of Pkc1 phosphorylation. There are several models that could explain this paradox. One is that the lcb1-100 mutant causes only a partial inhibition of sphingolipid production. However, this model seems unlikely because we found that myriocin, an inhibitor of Lcb1, also causes only a partial loss of Pkc1 phosphorylation. Other possible models are that inactivation of Ypk1/2 triggers signals that lead to rapid depletion of the sphingolipids that influence Pkc1 phosphorylation, or that inactivation of Ypk1/2 triggers a relocalization of Pkc1 that influences its phosphorylation state. Additional models arise from the fact that Lcb1 forms a complex with phosphatidylinositol-4-phosphate phosphatase, which is encoded by the SAC1 gene (Breslow et al., 2010). Thus inactivation of Lcb1 could have effects on regulation of Sac1. This could also be true for inhibition of Lcb1 by myriocin because drug binding can affect protein structure in ways that have profound effects on protein function and protein–protein interactions (see, for example, Poulikakos et al., 2010). Therefore inactivation of Lcb1 could lead to misregulation of Sac1, leading to effects on Pkc1. For example, normal regulation of Sac1 could be necessary for full activity of the phosphatase that dephosphorylates Pkc1, which would explain why Pkc1 is not fully dephosphorylated when Lcb1 is inhibited.
Together the data indicate that an arrest of membrane growth causes an abrupt decrease in sphingolipid-dependent signals. The data further suggest that the TORC2-Ypk1/2 network monitors vesicle-dependent delivery of sphingolipids to the plasma membrane, rather than synthesis of sphingolipids at the endoplasmic reticulum. Finally, the data suggest that delivery of sphingolipids to the plasma membrane plays a role in controlling Pkc1 phosphorylation.
An interesting interpretation of the data could be that the sphingolipid network functions to coordinate aspects of cell growth. The network constitutes a feedback loop in which sphingolipids control TORC2 and Ypk1/2, while TORC2 and Ypk1/2 control production of sphingolipids. Sphingolipids are precursors for synthesis of components of the plasma membrane. Thus the feedback loop could help ensure that growth of the plasma membrane is coordinated with synthesis of precursors at the endoplasmic reticulum. Since TORC2 and Ypk1/2 are also thought to control diverse aspects of cell growth, the feedback loop could work more broadly to coordinate events of cell growth. A previous study found that myriocin causes dose-dependent hyperphosphorylation of the Orm1/2 proteins (Breslow et al., 2010). This observation suggests that the signaling network can measure the amount of sphingolipids transported to the plasma membrane, rather than simply measuring whether they are being transported. In this case, the network could generate signals that are proportional to the amount of sphingolipids transported to the plasma membrane. This kind of proportional growth signal could be used to measure and control cell size. Indeed, the data suggest that growth-dependent phosphorylation of Pkc1 may be dependent on signals from sphingolipids.
The idea that cell growth and size are controlled by lipid-dependent signals is appealing. Control of cell growth and size would have been essential for survival of the earliest cells, so it is likely that the underlying mechanisms are ancient and conserved. Membranes that allow compartmentalization are one of the most fundamental and conserved features of cells, so it would make sense that mechanisms that control membrane growth evolved early and in close association with membrane lipids. Overall we have a surprisingly limited understanding of the mechanisms and regulation of membrane growth during the cell cycle. A full understanding of cell growth, and the mechanisms that limit growth to control cell size, requires a deeper understanding of these mechanisms.
MATERIALS AND METHODS
Yeast strains, culture conditions, and plasmids
Most strains used in this study are in the W303 strain background (leu2-3,112 ura3-1 can1-100 ade2-1 his3-11,15 trp1-1 GAL+ ssd1-d2), except for DDY903 and YSY1269, which are in the S288C background (his3-Δ200 leu2-3, 112, ura3-52). The additional features of the strains used in this study are listed in Supplemental Table S5. Cells were grown in YEPD media (1% yeast extract, 2% peptone, 2% dextrose) supplemented with 40 mg/l adenine, or in YEP media (1% yeast extract, 2% peptone) supplemented with 40 mg/l adenine and with different carbon sources, as noted.
A plasmid for tagging YPK1 with 3XHA was created by amplifying the C-terminus of YPK1 with oligos Ypk1-1 and Ypk1-2 and cloning into the BamH1 and Kpn1 sites of pDK51 (3XHA,URA), resulting in an in-frame fusion of Ypk1–3XHA (oligos: GCGGG-ATCCGGGTCTTCGACCTTAAATCCC and CGCGGTACCTCTAATGCTTCTACCTTGCAC). Cutting this plasmid (pMG2a) with Cla1 targets integration at YPK1.
To make a strain that expresses an analogue-sensitive allele of PKH1, the PKH1 gene was amplified and cloned into vector pRS306 (URA3) (oligos: GCGGAATTCGACTAATAACAAAACGAATGACG and GCGCTCGAGGCTACACGGTCACAATACCC). Site-directed mutagenesis was then used to introduce mutations L203A and F187V to make plasmid pJZ5A (pkh1-as, URA3) (Sun et al., 2012). Strain DK2547 was made by digesting plasmid pJZ5A with MscI to target integration at the PKH1 locus in pkh2∆ cells. After selection for plasmid integration, recombination events that loop out the plasmid were selected on FOA, and sequencing was used to identify looping-out events that left the mutants behind.
A ypk1-as ypk2∆ strain in the W303 background was made as previously described (Sun et al., 2012). To make 3XHA tagged versions of ORM2 in the W303 background, a Nat1-3XHA-ORM2 cassette was amplified from strain DDY5102 (Sun et al., 2012) and transformed into cells (oligos: GCGGATGCGCTGTTCTGCGG and CCCACGTAGCGTTCATGTTGGG. The same approach was used to move FLAG-tagged phosphorylation site mutant versions of ORM2 into the W303 background.
Standard one-step PCR-based gene replacement was used for making gene deletions and adding epitope tags at the endogenous locus (Longtine et al., 1998; Janke et al., 2004).
Cell cycle time courses
To synchronize cells in G1 phase, cells were grown overnight to log phase in YEPD at room temperature. Cells at an OD600 of 0.6 were arrested in G1 by addition of alpha factor to 0.5 µg/ml (bar1– strains) or 15 µg/ml (BAR+ strains). Cells were arrested at room temperature for 3.5 h and released by washing 3× with fresh YEPD. Time courses were carried out at 25°C unless otherwise noted. To prevent cells from reentering the cell cycle, alpha factor was added back at 90 min after release from arrest. For time courses using analogue-sensitive alleles, the cells were grown in YEPD media without supplemental adenine.
Western blotting
To prepare samples for Western blotting, 1.6 ml of culture was collected and centrifuged at 13,000 rpm for 30 s. The supernatant was removed and glass beads (250 µl) were added before freezing in liquid nitrogen. Cells were lysed by bead-beating in 140 µl of 1× sample buffer (65 mM Tris-HCl, pH 6.8, 3% SDS, 10% glycerol, 50 mM NaF, 100 mM beta-glycerolphosphate, 5% 2-mercaptoethanol, 2 mM phenylmethylsulfonyl fluoride [PMSF], and bromophenol blue). The PMSF was added immediately before lysis from a 100 mM stock in ethanol. Cells were lysed in a mini-beadbeater-16 (Biospec Products) at top speed for 2 min. The samples were then centrifuged for 15 s at 13,000 rpm, placed in a boiling water bath for 5 min, and centrifuged for 5 min at 13,000 rpm. SDS–PAGE was carried out as previously described using a 10% acrylamide gel (Harvey et al., 2005). Gels were run at a constant current of 20 mA until a prestained molecular weight marker of 57.6 kDa was near the bottom of the gel.
For Western blotting, protein was transferred to nitrocellulose membranes (or polyvinylidene difluoride membranes for Pkc1) for 1 h, 30 min at 800 mA at 4°C in a Hoeffer transfer tank in buffer containing 20 mM Tris base, 150 mM glycine, and 20% methanol. Blots were probed overnight at room temperature with affinity-purified rabbit polyclonal antibodies raised against Pkc1, Clb2, or HA peptide (Anastasia et al., 2012). Anti-FLAG rabbit polyclonal antibody was from Sigma-Aldrich. TORC2-dependent phosphorylation of endogenous Ypk1 was detected using rabbit polyclonal anti-phospho-Ypk1(T662) (a gift of Ted Powers, University of California, Davis) and Pkh1/2-dependent phoshorylation of Ypk1 and Ypk2 was detected using a phosphospecific antibody that recognizes Ypk1 phosphorylated at T504 (Santa Cruz Biotechnology, Dallas, TX; catalogue number sc-16744 P).
Phos-Tag gels were used to resolve phosphorylated forms of Orm2-Flag (Kinoshita et al., 2006). Samples were loaded onto 10% polyacrylamide gels containing 50 μM Phos-Tag (Wako Chemicals USA, Richmond, VA) and 100 μM MnCl2. Gels were rinsed twice for 10 min in transfer buffer containing 2 mM EDTA. Gels were transferred to nitrocellulose using the Trans-Blot Turbo transfer system (BioRad USA, Hercules, CA).
Antibodies that recognize epitope tags were verified using untagged control strains. Antibodies that directly recognize proteins were verified with gene deletion strains or with strains that carry a tagged version of the protein that causes a large electrophoretic mobility shift. Phosphospecific antibodies were verified using extracts treated with phosphatase, as well as gene deletion strains.
Analysis of bud emergence and polarity
To analyze bud emergence and polarity, samples from synchronized cultures were fixed with 3.7% formaldehyde and analyzed (n = 200 cells) by light microscopy as previously described (Pringle et al., 1991). Bud polarity was analyzed in samples taken 120 min after release from G1 phase arrest. ImageJ was used to measure bud length and width, and the ratio was averaged for at least 50 cells in each sample. The average length and width of each strain were depicted as ovals (lines represent SE) whose relative shape and size can be directly compared.
Preparation of samples for mass spectrometry
To prepare samples for mass spectrometry, wild-type and sec6-4 cells were grown in YEPD medium overnight at room temperature to an OD600 of 0.8. Cells were arrested in G1 with mating pheromone and released from the arrest at room temperature. At 70 min after release from the G1 arrest, cells were shifted to a 34°C water bath and samples for mass spectrometry were taken 5 min after the shift. Samples for Western blotting were collected before and after the shift to confirm that Pkc1 underwent dephosphorylation.
For each sample, cells (50 ml) were harvested by centrifuging 1 min at 3800 rpm. The cells were resuspended in 1 ml YPD and transferred to a 2 ml screw-top tube. The cells were pelleted for 30 s, the supernatant was removed, and 250 µl of glass beads was added before freezing the cells on liquid nitrogen. All tubes, centrifuge buckets, and media were prewarmed to 34°C to maintain restrictive temperature during cell collection.
To lyse the cells, 500 µl of ice cold lysis buffer (8 M urea, 75 mM NaCl, 50 mM Tris-HCl, pH 8.0, 50 mM NaF, 50 mM β-glycerophosphate, 1 mM sodium orthovanadate, 10 mM sodium pyrophosphate, 1 mM PMSF) was added to the harvested cells before lysis using a Biospec Multibeater-16 at top speed for three cycles of 1 min, each followed by a 1 min incubation on ice to avoid overheating. Samples were centrifuged at 13,000 rpm for 10 min at 4°C, and the lysates were transferred to fresh 1.6 ml tubes and spun again before transfer to new 1.6 ml tubes. A 5 µl aliquot was taken from each sample for Bradford assay and protein quantification before flash freezing in liquid nitrogen. Three biological replicates for each strain were collected and analyzed by mass spectrometry.
Disulfide bonds were reduced by adding dithiothreitol (DTT) to a final concentration of 2.5 mM and incubation at 56°C for 40 min. The extract was allowed to cool to room temperature, and the reduced cysteines were alkylated by adding iodoacetamide to 7.5 mM and incubating for 40 min in the dark at room temperature. Alkylation was quenched with an additional 5 mM DTT. Peptide digestion and labeling by reductive dimethylation were carried out as previously described (Zapata et al., 2014).
Phosphopeptide enrichment by SCX/TiO2
Phosphopeptides were enriched using a modified version of the two-step, SCX-IMAC/TiO2 protocol employing step elution from self-packed, solid-phase extraction strong cation exchange (SCX) chromatography cartridges as previously described with some changes (Villén and Gygi, 2008). Peptides were resuspended in 1 ml SCX buffer A (7 mM KH2PO4, pH 2.65, 30% acetonitrile [ACN]) and loaded onto preequilibrated syringe-barrel columns packed with 500 mg of 20 µm, 300 Å, polysulfoethylA resin (poly LC). The loading flow-through was collected and pooled with a 2 ml wash with buffer A. Seven additional fractions were collected after sequential addition of 3 ml of SCX buffer A containing increasing concentrations of KCl: 10, 20, 30, 40, 50, 60, and 100 mM. All fractions were frozen in liquid nitrogen, lyophilized, resuspended in 1 ml of 1% formic acid (FA), and desalted on 50 mg Sep-paks. Peptides were eluted with 500 µl of 70% ACN, 1% FA. Five percent of each fraction was taken off for protein abundance analysis. The remaining peptides were dried in a speed vac. TiO2 enrichment was performed as in Kettenbach and Gerber (2011). Dried peptides were resuspended in 300 µl wash/binding buffer (50% ACN, 2 M lactic acid) and incubated with 90 mg of prewashed Titansphere TiO2 beads (GL Sciences: #5020-75000) with vigorous shaking for 60 min at room temperature. The beads were washed two times with 300 µl of wash/binding buffer and then two times with 300 µl 50% ACN/1% FA. Phosphopeptides were eluted in two steps by sequential treatments with 75 µl 50 M KH2PO4, pH 10.7. The eluates were acidified by the addition of FA to 2% final concentration, desalted on STAGE tips (Rappsilber et al., 2003), and dried in a speed vac. Eight fractions were analyzed by LC-MS/MS.
Mass spectrometry
Phosphopeptide samples were analyzed on a LTQ Orbitrap Velos mass spectrometer (Thermo Fisher Scientific) equipped with an Accela 600 quaternary pump (Thermo Fisher Scientific) and a Famos microautosampler (LC Packings, Sunnyvale, CA). Nanospray tips were hand-pulled using 100 μm I.D. fused-silica tubing and packed with 0.5 cm of Magic C4 resin (5 μm, 100 Å; Michrom Bioresources, Auburn, CA) followed by 20 cm of Maccel C18AQ resin (3 μm, 200 Å; Nest Group, Southborough, MA). Peptides were separated using a gradient of 3%–28% ACN in 0.125% FA over 70 min with an on-column flow rate of ∼300–500 nl/min.
Peptides were detected using a data-dependent Top20-MS2 method. For each cycle, one full MS scan of m/z = 300–1500 was acquired in the Orbitrap at a resolution of 60,000 at m/z = 400 with automatic gain control (AGC) target = 1 × 10⁶ and maximum ion accumulation time of 500 ms. Each full scan was followed by the selection of the most intense ions, up to 20, for collision induced dissociation (CID) and MS2 analysis in the LTQ. An AGC target of 2 × 10³ and maximum ion accumulation time of 150 ms were used for MS2 scans. Ions selected for MS2 analysis were excluded from reanalysis for 60 s. Precursor ions with charge = 1+ or unassigned were excluded from selection for MS2 analysis. Lockmass, employing atmospheric polydimethylsiloxane (m/z = 445.120025) as an internal standard, was used in all runs to calibrate orbitrap MS precursor masses. Each sample was analyzed twice for a total of 48 runs.
Peptide identification and filtering
MS2 spectra were searched using SEQUEST v.28 (rev. 13) (Eng et al., 1994) against a composite database containing the translated sequences of all predicted open reading frames of Saccharomyces cerevisiae (http://downloads.yeastgenome.org, downloaded 20 October 2009) and its reversed complement, using the following parameters: a precursor mass tolerance of ±20 ppm; 1.0 Da product ion mass tolerance; lysC digestion; up to two missed cleavages; static modifications of carbamidomethylation on cysteine (+57.0214), dimethyl adducts (+28.0313) on lysine and peptide amino termini; and dynamic modifications for methionine oxidation (+15.9949), heavy dimethylation (+6.0377) on lysine and peptide amino termini, and phosphate (+79.9663) on serine, threonine, and tyrosine for phosphopeptide-enriched samples.
Peptide spectral matches were filtered to 1% FDR using the target-decoy strategy (Elias and Gygi, 2007) combined with linear discriminant analysis (LDA) (Huttlin et al., 2010) using several different parameters including Xcorr, ΔCn′, precursor mass error, observed ion charge state, and predicted solution charge state. Linear discriminant models were calculated for each LC-MS/MS run using peptide matches to forward and reversed protein sequences as positive and negative training data. Peptide spectral matches within each run were sorted in descending order by discriminant score and filtered to a 1% FDR as revealed by the number of decoy sequences remaining in the data set. The data were further filtered to control protein-level FDRs. Peptides from all fractions in each experiment were combined and assembled into proteins. Protein scores were derived from the product of all LDA peptide probabilities, sorted by rank, and filtered to 1% FDR as described for peptides. Protein filtering removes many additional decoy peptides hits, thus further reducing the peptide FDR. The final peptide FDR was 0.08%. The remaining 65 peptide matches to the decoy database were removed from the final data set.
Mass spectrometric feature detection and peptide quantification were performed with custom software developed in the Gygi lab (Bakalarski et al., 2007). Peptide peak noise levels were calculated as the median peak intensity of all peaks ±10 Th surrounding the precursor m/z in a window of ±20 MS1 scans. Signal to noise was calculated as the ratio of the instrument reported precursor m/z peak intensity to the calculated noise value. For inclusion in quantitative calculations, peptides were required to have a sum signal-to-noise ratio ≥10 for heavy and light species. Ratios were normalized to recenter the distribution at 1:1 (log2 = 0). Owing to the sparsity of the data and the frequent uncertainty of site localization that is inherent in these analyses, we grouped same sequence, same phosphorylation site number peptides together for quantification. Thus phosphorylation site ratios were calculated for each replicate from the median of all such peptides.
Phosphorylation site localization analysis was done using the Ascore algorithm (Beausoleil et al., 2006). These values appear in Supplemental Tables S1 and S2. Sites with Ascore ≥13 were considered localized. Because localization and quantification are only weakly correlated, for the purposes of quantification, unlocalized site assignments were reassigned using assignments corresponding to the maximum Ascore from other same sequence peptides in the data set.
All raw data files, peak lists, and the sequence database have been deposited in the MASSive repository (https://massive.ucsd.edu, ID#:MSV000080919)and are available for download at ftp://massive.ucsd.edu/MSV000080919.
Reproducibility
All experiments were repeated for a minimum of three biological replicates that gave the same results.
Supplementary Material
Acknowledgments
We thank Ted Powers for the anti–phospho-Ypk1(T662P) antibody and François Roelants for advice and critical reading of the manuscript. We also thank Yidi Sun and David Drubin for advice and sharing strains, members of the Kellogg laboratory for advice and critical reading of the manuscript, and Ben Abrams for assistance with microscopy. This work was supported by National Institutes of Health Grant GM109143.
Abbreviations used:
- SPT
serine palmitoyltransferase
- TORC2
target of rapamycin complex 2.
Footnotes
This article was published online ahead of print in MBoC in Press (http://www.molbiolcell.org/cgi/doi/10.1091/mbc.E17-01-0081) on August 9, 2017.
REFERENCES
- Abe M, Qadota H, Hirata A, Ohya Y. Lack of GTP-bound Rho1p in secretory vesicles of Saccharomyces cerevisiae. J Cell Biol. 2003;162:85–97. doi: 10.1083/jcb.200301022. [DOI] [PMC free article] [PubMed] [Google Scholar]
- Anastasia SD, Nguyen DL, Thai V, Meloy M, MacDonough T, Kellogg DR. A link between mitotic entry and membrane growth suggests a novel model for cell size control. J Cell Biol. 2012;197:89–104. doi: 10.1083/jcb.201108108. [DOI] [PMC free article] [PubMed] [Google Scholar]
- Andrews PD, Stark MJ. Dynamic, Rho1p-dependent localization of Pkc1p to sites of polarized growth. J Cell Sci. 2000;113(Pt 15):2685–2693. doi: 10.1242/jcs.113.15.2685. [DOI] [PubMed] [Google Scholar]
- Aronova S, Wedaman K, Aronov PA, Fontes K, Ramos K, Hammock BD, Powers T. Regulation of ceramide biosynthesis by TOR complex 2. Cell Metabolism. 2008;7:148–158. doi: 10.1016/j.cmet.2007.11.015. [DOI] [PMC free article] [PubMed] [Google Scholar]
- Bakalarski CE, Haas W, Dephoure NE, Gygi SP. The effects of mass accuracy, data acquisition speed, and search algorithm choice on peptide identification rates in phosphoproteomics. Anal Bioanal Chem. 2007;389:1409–1419. doi: 10.1007/s00216-007-1563-x. [DOI] [PubMed] [Google Scholar]
- Beausoleil SA, Villén J, Gerber SA, Rush J, Gygi SP. A probability-based approach for high-throughput protein phosphorylation analysis and site localization. Nat Biotechnol. 2006;24:1285–1292. doi: 10.1038/nbt1240. [DOI] [PubMed] [Google Scholar]
- Berchtold D, Piccolis M, Chiaruttini N, Riezman I, Riezman H, Roux A, Walther TC, Loewith R. Plasma membrane stress induces relocalization of Slm proteins and activation of TORC2 to promote sphingolipid synthesis. Nat Cell Biol. 2012;14:542–547. doi: 10.1038/ncb2480. [DOI] [PubMed] [Google Scholar]
- Berchtold D, Walther TC. TORC2 plasma membrane localization is essential for cell viability and restricted to a distinct domain. Mol Biol Cell. 2009;20:1565–1575. doi: 10.1091/mbc.E08-10-1001. [DOI] [PMC free article] [PubMed] [Google Scholar]
- Breslow DK, Collins SR, Bodenmiller B, Aebersold R, Simons K, Shevchenko A, Ejsing CS, Weissman JS. Orm family proteins mediate sphingolipid homeostasis. Nature. 2010;463:1048–1053. doi: 10.1038/nature08787. [DOI] [PMC free article] [PubMed] [Google Scholar]
- Casamayor A, Torrance PD, Kobayashi T, Thorner J, Alessi DR. Functional counterparts of mammalian protein kinases PDK1 and SGK in budding yeast. Curr Biol. 1999;9:186–197. doi: 10.1016/s0960-9822(99)80088-8. [DOI] [PubMed] [Google Scholar]
- Dickson RC. Thematic review series: sphingolipids. New insights into sphingolipid metabolism and function in budding yeast. J Lipid Res. 2008;49:909–921. doi: 10.1194/jlr.R800003-JLR200. [DOI] [PMC free article] [PubMed] [Google Scholar]
- Ejsing CS, Sampaio JL, Surendranath V, Duchoslav E, Ekroos K, Klemm RW, Simons K, Shevchenko A. Global analysis of the yeast lipidome by quantitative shotgun mass spectrometry. Proc Natl Acad Sci USA. 2009;106:2136–2141. doi: 10.1073/pnas.0811700106. [DOI] [PMC free article] [PubMed] [Google Scholar]
- Elias JE, Gygi SP. Target-decoy search strategy for increased confidence in large-scale protein identifications by mass spectrometry. Nat Methods. 2007;4:207–214. doi: 10.1038/nmeth1019. [DOI] [PubMed] [Google Scholar]
- Enciso G, Kellogg DR, Vargas A. Compact modeling of allosteric multisite proteins: application to a cell size checkpoint. PLoS Comput Biol. 2014;10:e1003443. doi: 10.1371/journal.pcbi.1003443. [DOI] [PMC free article] [PubMed] [Google Scholar]
- Eng JK, McCormack AL, Yates JR. An approach to correlate tandem mass spectral data of peptides with amino acid sequences in a protein database. J Am Soc Mass Spectrom. 1994;5:976–989. doi: 10.1016/1044-0305(94)80016-2. [DOI] [PubMed] [Google Scholar]
- Friant S, Lombardi R, Schmelzle T, Hall MN, Riezman H. Sphingoid base signaling via Pkh kinases is required for endocytosis in yeast. EMBO J. 2001;20:6783–6792. doi: 10.1093/emboj/20.23.6783. [DOI] [PMC free article] [PubMed] [Google Scholar]
- Friant S, Zanolari B, Riezman H. Increased protein kinase or decreased PP2A activity bypasses sphingoid base requirement in endocytosis. EMBO J. 2000;19:2834–2844. doi: 10.1093/emboj/19.12.2834. [DOI] [PMC free article] [PubMed] [Google Scholar]
- Han S, Lone MA, Schneiter R, Chang A. Orm1 and Orm2 are conserved endoplasmic reticulum membrane proteins regulating lipid homeostasis and protein quality control. Proc Natl Acad Sci USA. 2010;107:5851–5856. doi: 10.1073/pnas.0911617107. [DOI] [PMC free article] [PubMed] [Google Scholar]
- Harvey SL, Charlet A, Haas W, Gygi SP, Kellogg DR. Cdk1-dependent regulation of the mitotic inhibitor Wee1. Cell. 2005;122:407–420. doi: 10.1016/j.cell.2005.05.029. [DOI] [PubMed] [Google Scholar]
- Hatakeyama R, Kono K, Yoshida S. Ypk1 and Ypk2 kinases maintain Rho1 at the plasma membrane by flippase-dependent lipid remodeling after membrane stresses. J Cell Sci. 2017;130:1169–1178. doi: 10.1242/jcs.198382. [DOI] [PubMed] [Google Scholar]
- Helliwell SB, Schmidt A, Ohya Y, Hall MN. The Rho1 effector Pkc1, but not Bni1, mediates signalling from Tor2 to the actin cytoskeleton. Curr Biol. 1998;8:1211–1214. doi: 10.1016/s0960-9822(07)00511-8. [DOI] [PubMed] [Google Scholar]
- Hua Z, Fatheddin P, Graham TR. An essential subfamily of Drs2p-related P-type ATPases is required for protein trafficking between Golgi complex and endosomal/vacuolar system. Mol Biol Cell. 2002;13:3162–3177. doi: 10.1091/mbc.E02-03-0172. [DOI] [PMC free article] [PubMed] [Google Scholar]
- Huttlin EL, Jedrychowski MP, Elias JE, Goswami T, Rad R, Beausoleil SA, Villén J, Haas W, Sowa ME, Gygi SP. A tissue-specific atlas of mouse protein phosphorylation and expression. Cell. 2010;143:1174–1189. doi: 10.1016/j.cell.2010.12.001. [DOI] [PMC free article] [PubMed] [Google Scholar]
- Inagaki M, Schmelzle T, Yamaguchi K, Irie K, Hall MN, Matsumoto K. PDK1 homologs activate the Pkc1-mitogen-activated protein kinase pathway in yeast. Mol Cell Biol. 1999;19:8344–8352. doi: 10.1128/mcb.19.12.8344. [DOI] [PMC free article] [PubMed] [Google Scholar]
- Janke C, Magiera MM, Rathfelder N, Taxis C, Reber S, Maekawa H, Moreno-Borchart A, Doenges G, Schwob E, Schiebel E, et al. A versatile toolbox for PCR-based tagging of yeast genes: new fluorescent proteins, more markers and promoter substitution cassettes. Yeast. 2004;21:947–962. doi: 10.1002/yea.1142. [DOI] [PubMed] [Google Scholar]
- Kamada Y, Fujioka Y, Suzuki NN, Inagaki F, Wullschleger S, Loewith R, Hall MN, Ohsumi Y. Tor2 directly phosphorylates the AGC kinase Ypk2 to regulate actin polarization. Mol Cell Biol. 2005;25:7239–7248. doi: 10.1128/MCB.25.16.7239-7248.2005. [DOI] [PMC free article] [PubMed] [Google Scholar]
- Kamada Y, Qadota H, Python CP, Anraku Y, Ohya Y, Levin DE. Activation of yeast protein kinase C by Rho1 GTPase. J Biol Chem. 1996;271:9193–9196. doi: 10.1074/jbc.271.16.9193. [DOI] [PubMed] [Google Scholar]
- Kettenbach AN, Gerber SA. Rapid and reproducible single-stage phosphopeptide enrichment of complex peptide mixtures: application to general and phosphotyrosine-specific phosphoproteomics experiments. Anal Chem. 2011;83:7635–7644. doi: 10.1021/ac201894j. [DOI] [PMC free article] [PubMed] [Google Scholar]
- Kinoshita E, Kinoshita-Kikuta E, Takiyama K, Koike T. Phosphate-binding tag, a new tool to visualize phosphorylated proteins. Mol Cell Proteomics. 2006;5:749–757. doi: 10.1074/mcp.T500024-MCP200. [DOI] [PubMed] [Google Scholar]
- Klose C, Surma MA, Gerl MJ, Meyenhofer F, Shevchenko A, Simons K. Flexibility of a eukaryotic lipidome–insights from yeast lipidomics. PLoS ONE. 2012;7:e35063. doi: 10.1371/journal.pone.0035063. [DOI] [PMC free article] [PubMed] [Google Scholar]
- Lew DJ, Reed SI. Morphogenesis in the yeast cell cycle: regulation by Cdc28 and cyclins. J Cell Biol. 1993;120:1305–1320. doi: 10.1083/jcb.120.6.1305. [DOI] [PMC free article] [PubMed] [Google Scholar]
- Li Y, Moir RD, Sethy-Coraci IK, Warner JR, Willis IM. Repression of ribosome and tRNA synthesis in secretion-defective cells is signaled by a novel branch of the cell integrity pathway. Mol Cell Biol. 2000;20:3843–3851. doi: 10.1128/mcb.20.11.3843-3851.2000. [DOI] [PMC free article] [PubMed] [Google Scholar]
- Liu K, Zhang X, Lester RL, Dickson RC. The sphingoid long chain base phytosphingosine activates AGC-type protein kinases in Saccharomyces cerevisiae including Ypk1, Ypk2, and Sch9. J Biol Chem. 2005;280:22679–22687. doi: 10.1074/jbc.M502972200. [DOI] [PubMed] [Google Scholar]
- Longtine MS, McKenzie A, DeMarini DJ, Shah NG, Wach A, Brachat A, Philippsen P, Pringle JR. Additional modules for versatile and economical PCR-based gene deletion and modification in Saccharomyces cerevisiae. Yeast. 1998;14:953–961. doi: 10.1002/(SICI)1097-0061(199807)14:10<953::AID-YEA293>3.0.CO;2-U. [DOI] [PubMed] [Google Scholar]
- McCusker D, Kellogg DR. Plasma membrane growth during the cell cycle: unsolved mysteries and recent progress. Curr Opin Cell Biol. 2012;24:845–851. doi: 10.1016/j.ceb.2012.10.008. [DOI] [PMC free article] [PubMed] [Google Scholar]
- Meier KD, Deloche O, Kajiwara K, Funato K, Riezman H. Sphingoid base is required for translation initiation during heat stress in Saccharomyces cerevisiae. Mol Biol Cell. 2006;17:1164–1175. doi: 10.1091/mbc.E05-11-1039. [DOI] [PMC free article] [PubMed] [Google Scholar]
- Mizuta K, Warner JR. Continued functioning of the secretory pathway is essential for ribosome synthesis. Mol Cell Biol. 1994;14:2493–2502. doi: 10.1128/mcb.14.4.2493. [DOI] [PMC free article] [PubMed] [Google Scholar]
- Muir A, Ramachandran S, Roelants FM, Timmons G, Thorner J. TORC2-dependent protein kinase Ypk1 phosphorylates ceramide synthase to stimulate synthesis of complex sphingolipids. eLife. 2014;3:1–34. doi: 10.7554/eLife.03779. [DOI] [PMC free article] [PubMed] [Google Scholar]
- Nakano K, Yamamoto T, Kishimoto T, Noji T, Tanaka K. Protein kinases Fpk1p and Fpk2p are novel regulators of phospholipid asymmetry. Mol Biol Cell. 2008;19:1783–1797. doi: 10.1091/mbc.E07-07-0646. [DOI] [PMC free article] [PubMed] [Google Scholar]
- Nanduri J, Tartakoff AM. The arrest of secretion response in yeast: signaling from the secretory path to the nucleus via Wsc proteins and Pkc1p. Mol Cell. 2001;8:281–289. doi: 10.1016/s1097-2765(01)00312-4. [DOI] [PubMed] [Google Scholar]
- Niles BJ, Mogri H, Hill A, Vlahakis A, Powers T. Plasma membrane recruitment and activation of the AGC kinase Ypk1 is mediated by target of rapamycin complex 2 (TORC2) and its effector proteins Slm1 and Slm2. Proc Natl Acad Sci USA. 2012;109:1536–1541. doi: 10.1073/pnas.1117563109. [DOI] [PMC free article] [PubMed] [Google Scholar]
- Niles BJ, Powers T. TOR complex 2-Ypk1 signaling regulates actin polarization via reactive oxygen species. Mol Biol Cell. 2014;25:3962–3972. doi: 10.1091/mbc.E14-06-1122. [DOI] [PMC free article] [PubMed] [Google Scholar]
- Nonaka H, Tanaka K, Hirano H, Fujiwara T, Kohno H, Umikawa M, Mino A, Takai Y. A downstream target of RHO1 small GTP-binding protein is PKC1, a homolog of protein kinase C, which leads to activation of the MAP kinase cascade in Saccharomyces cerevisiae. EMBO J. 1995;14:5931–5938. doi: 10.1002/j.1460-2075.1995.tb00281.x. [DOI] [PMC free article] [PubMed] [Google Scholar]
- Olson DK, Fröhlich F, Christiano R, Hannibal-Bach HK, Ejsing CS, Walther TC. Rom2-dependent phosphorylation of Elo2 controls the abundance of very long-chain fatty acids. J Biol Chem. 2015;290:4238–4247. doi: 10.1074/jbc.M114.629279. [DOI] [PMC free article] [PubMed] [Google Scholar]
- Pichler H, Gaigg B, Hrastnik C, Achleitner G, Kohlwein SD, Zellnig G, Perktold A, Daum G. A subfraction of the yeast endoplasmic reticulum associates with the plasma membrane and has a high capacity to synthesize lipids. Eur J Biochem. 2001;268:2351–2361. doi: 10.1046/j.1432-1327.2001.02116.x. [DOI] [PubMed] [Google Scholar]
- Pomorski T, Lombardi R, Riezman H, Devaux PF, van Meer G, Holthuis JCM. Drs2p-related P-type ATPases Dnf1p and Dnf2p are required for phospholipid translocation across the yeast plasma membrane and serve a role in endocytosis. Mol Biol Cell. 2003;14:1240–1254. doi: 10.1091/mbc.E02-08-0501. [DOI] [PMC free article] [PubMed] [Google Scholar]
- Poulikakos PI, Zhang C, Bollag G, Shokat KM, Rosen N. RAF inhibitors transactivate RAF dimers and ERK signalling in cells with wild-type BRAF. Nature. 2010;464:427–430. doi: 10.1038/nature08902. [DOI] [PMC free article] [PubMed] [Google Scholar]
- Pringle JR, Adams AE, Drubin DG, Haarer BK. Immunofluorescence methods for yeast. Methods Enzymol. 1991;194:565–602. doi: 10.1016/0076-6879(91)94043-c. [DOI] [PubMed] [Google Scholar]
- Rappsilber J, Ishihama Y, Mann M. Stop and go extraction tips for matrix-assisted laser desorption/ionization, nanoelectrospray, and LC/MS sample pretreatment in proteomics. Anal Chem. 2003;75:663–670. doi: 10.1021/ac026117i. [DOI] [PubMed] [Google Scholar]
- Roelants FM, Baltz AG, Trott AE, Fereres S, Thorner J. A protein kinase network regulates the function of aminophospholipid flippases. Proc Natl Acad Sci USA. 2010;107:34–39. doi: 10.1073/pnas.0912497106. [DOI] [PMC free article] [PubMed] [Google Scholar]
- Roelants FM, Breslow DK, Muir A, Weissman JS, Thorner J. Protein kinase Ypk1 phosphorylates regulatory proteins Orm1 and Orm2 to control sphingolipid homeostasis in Saccharomyces cerevisiae. Proc Natl Acad Sci USA. 2011;108:19222–19227. doi: 10.1073/pnas.1116948108. [DOI] [PMC free article] [PubMed] [Google Scholar]
- Roelants FM, Torrance PD, Bezman N, Thorner J. Pkh1 and Pkh2 differentially phosphorylate and activate Ypk1 and Ykr2 and define protein kinase modules required for maintenance of cell wall integrity. Mol Biol Cell. 2002;13:3005–3028. doi: 10.1091/mbc.E02-04-0201. [DOI] [PMC free article] [PubMed] [Google Scholar]
- Roelants FM, Torrance PD, Thorner J. Differential roles of PDK1- and PDK2-phosphorylation sites in the yeast AGC kinases Ypk1, Pkc1 and Sch9. Microbiology (Reading, Engl) 2004;150:3289–3304. doi: 10.1099/mic.0.27286-0. [DOI] [PubMed] [Google Scholar]
- Rossio V, Yoshida S. Spatial regulation of Cdc55-PP2A by Zds1/Zds2 controls mitotic entry and mitotic exit in budding yeast. J Cell Biol. 2011;193:445–454. doi: 10.1083/jcb.201101134. [DOI] [PMC free article] [PubMed] [Google Scholar]
- Schmelzle T, Helliwell SB, Hall MN. Yeast protein kinases and the RHO1 exchange factor TUS1 are novel components of the cell integrity pathway in yeast. Mol Cell Biol. 2002;22:1329–1339. doi: 10.1128/mcb.22.5.1329-1339.2002. [DOI] [PMC free article] [PubMed] [Google Scholar]
- Sun Y, Miao Y, Yamane Y, Zhang C, Shokat KM, Takematsu H, Kozutsumi Y, Drubin DG. Orm protein phosphoregulation mediates transient sphingolipid biosynthesis response to heat stress via the Pkh-Ypk and Cdc55-PP2A pathways. Mol Biol Cell. 2012;23:2388–2398. doi: 10.1091/mbc.E12-03-0209. [DOI] [PMC free article] [PubMed] [Google Scholar]
- Sun Y, Taniguchi R, Tanoue D, Yamaji T, Takematsu H, Mori K, Fujita T, Kawasaki T, Kozutsumi Y. Sli2 (Ypk1), a homologue of mammalian protein kinase SGK, is a downstream kinase in the sphingolipid-mediated signaling pathway of yeast. Mol Cell Biol. 2000;20:4411–4419. doi: 10.1128/mcb.20.12.4411-4419.2000. [DOI] [PMC free article] [PubMed] [Google Scholar]
- Thai V, Dephoure N, Weiss A, Ferguson J, Leitao R, Gygi SP, Kellogg DR. Protein kinase C controls binding of Igo/ENSA proteins to protein phosphatase 2A in budding yeast. J Biol Chem. 2017;292:4925–4941. doi: 10.1074/jbc.M116.753004. [DOI] [PMC free article] [PubMed] [Google Scholar]
- Villén J, Gygi SP. The SCX/IMAC enrichment approach for global phosphorylation analysis by mass spectrometry. Nat Protoc. 2008;3:1630–1638. doi: 10.1038/nprot.2008.150. [DOI] [PMC free article] [PubMed] [Google Scholar]
- Watanabe M, Chen CY, Levin DE. Saccharomyces cerevisiae PKC1 encodes a protein kinase C (PKC) homolog with a substrate specificity similar to that of mammalian PKC. J Biol Chem. 1994;269:16829–16836. [PubMed] [Google Scholar]
- Wullschleger S, Loewith R, Oppliger W, Hall MN. Molecular organization of target of rapamycin complex 2. J Biol Chem. 2005;280:30697–30704. doi: 10.1074/jbc.M505553200. [DOI] [PubMed] [Google Scholar]
- Yamochi W, Tanaka K, Nonaka H, Maeda A, Musha T, Takai Y. Growth site localization of Rho1 small GTP-binding protein and its involvement in bud formation in Saccharomyces cerevisiae. J Cell Biol. 1994;125:1077–1093. doi: 10.1083/jcb.125.5.1077. [DOI] [PMC free article] [PubMed] [Google Scholar]
- Zapata J, Dephoure N, Macdonough T, Yu Y, Parnell EJ, Mooring M, Gygi SP, Stillman DJ, Kellogg DR. PP2ARts1 is a master regulator of pathways that control cell size. J Cell Biol. 2014;204:359–376. doi: 10.1083/jcb.201309119. [DOI] [PMC free article] [PubMed] [Google Scholar]
Associated Data
This section collects any data citations, data availability statements, or supplementary materials included in this article.