

The SAGA complex, together with transcription factors and Rvs167p, coordinates sterol-dependent transcription changes. In ergosterol mutants the SAGA complex increases its occupancy on ergosterol biosynthesis and anaerobic gene promoters, recruits the SWI/SNF complex, and binds to transcription factors and Rvs167p. Genes encoding stress proteins and basic amino acid synthesis are also affected even though promoter occupancy is not changed.
Abstract
Changes in cellular sterol species and concentrations can have profound effects on the transcriptional profile. In yeast, mutants defective in sterol biosynthesis show a wide range of changes in transcription, including a coinduction of anaerobic genes and ergosterol biosynthesis genes, biosynthesis of basic amino acids, and several stress genes. However the mechanisms underlying these changes are unknown. We identified mutations in the SAGA complex, a coactivator of transcription, which abrogate the ability to carry out most of these sterol-dependent transcriptional changes. In the erg3 mutant, the SAGA complex increases its occupancy time on many of the induced ergosterol and anaerobic gene promoters, increases its association with several relevant transcription factors and the SWI/SNF chromatin remodeling complex, and surprisingly, associates with an endocytic protein, Rvs167p, suggesting a moonlighting function for this protein in the sterol-regulated induction of the heat shock protein, HSP42 and HSP102, mRNAs.
INTRODUCTION
Sterols are important components of membranes in most eukaryotic organisms, although their structures differ among plants, fungi, and mammals. It seems that sterols interact functionally with sphingolipids, and it has been postulated that the two lipid species could have coevolved to ensure their function in the different kingdoms, which also have distinct types of sphingolipids (Guan et al., 2009; Hannich et al., 2011). Interestingly, the biosynthetic pathways for sterol biosynthesis show differences between the plant and animal kingdoms (Volkman, 2003) and strategies for sterol supply also differ greatly among the kingdoms. Plants and fungi synthesize their required sterols, whereas humans regulate their cholesterol levels through a combination of cholesterol uptake/redistribution and de novo synthesis (Goldstein and Brown, 2009). Insects and worms have another strategy. They take up and use sterols but do not synthesize them de novo (Kurzchalia and Ward, 2003; Carvalho et al., 2010). Therefore regulation of sterol levels is likely to differ considerably among different organisms.
Sterol function is critical for humans, as diseases in cholesterol biosynthesis cause hereditary disorders (Jira et al., 2003; Platt et al., 2014) and defects in cholesterol/low density lipoprotein trafficking has been linked to atherosclerosis (Goldstein and Brown, 1977). Ergosterol biosynthesis in fungi is also a prime target for antifungals. While sterols perform essential functions, due to their effects on the physical properties of membranes and their insolubility in an aqueous environment, the amount of free sterols has to be tightly regulated. Elevated cholesterol levels correlate with incidence of cardiovascular disease (Goldstein and Brown, 2009). In animals, cholesterol is taken up by endocytosis and delivered to the cytoplasm. Sterols are delivered to the endoplasmic reticulum (ER), where they can be converted to cholesterol esters and stored in lipid droplets, whereas the level of free cholesterol in the ER regulates de novo cholesterol and other lipid synthetic pathways via control of gene expression. The components of this regulatory mechanism include the proteins INSIG, SCAP, and SREBP. The cholesterol-dependent association of INSIG with SCAP is essential for the regulation (Rawson, 2003). The regulatory mechanism is conserved in mammals but not completely in fungi. In Schizosaccaromyces pombe, the SCAP (scp1) and SREBP (sre1) homologues are regulated by oxygen levels rather than sterols (Hughes et al., 2005). This points to an evolutionary connection between oxygen sensing and sterol biosynthesis (Galea and Brown, 2009). This is, in some respects, logical because the conversion of squalene to squalene epoxide in sterol biosynthesis requires O2.
Saccharomyces cerevisiae does not have homologues of these regulatory proteins, so the control of ergosterol biosynthesis is regulated differently. Nevertheless, oxygen status and regulation of sterol biosynthesis are somehow related. Under anaerobic conditions where they cannot synthesize ergosterol, S. cerevisiae cells express a set of genes, the so-called anaerobic genes, some of which facilitate sterol uptake from the media (Abramova et al., 2001). Other perturbations, such as drug treatments that reduce sterol levels, induce sterol biosynthesis genes, and this regulation depends on a sterol response element that is identical to the anaerobic response element (Gallo-Ebert et al., 2013). Therefore the promoters of the anaerobically expressed genes and sterol synthesis genes share common regulatory elements. This raises an interesting question: how can similar elements give differential regulation?
Under normal growth conditions sterol biosynthesis genes are expressed, whereas anaerobic genes are not. However, transcriptome data from mutants in ergosterol biosynthesis showed that ergosterol biosynthesis genes and anaerobic genes were coinduced in sterol mutants (Guan et al., 2009). This suggests that sterols regulate both sets of genes. Indeed, the transcription factor Upc2p binds to the sterol response element (Gallo-Ebert et al., 2013) and is implicated in expression of both anaerobic and sterol biosynthetic genes. Upc2p binds ergosterol through its C-terminal domain, and when this site is unoccupied, Upc2p shuttles to the nucleus, where it can induce transcription (Yang et al., 2015). However, Upc2p alone cannot explain how these two sets of genes are oppositely regulated under aerobic conditions and coordinately regulated in sterol mutants. It could be by a negative regulation of anaerobic genes under aerobic conditions or a coactivator requirement. The negative regulatory mechanism is still unclear, although it also requires the sterol response element (Abramova et al., 2001) and no coactivator of Upc2p-dependent transcription has been identified (Yang et al., 2015).
Here we investigated the mechanism whereby sterol synthesis and anaerobic genes are coordinately regulated in sterol mutants. We tested a number of candidate transcription factors, including Upc2p, but none of them could fully account for the coordinate regulation. Using a genetic selection, we identified mutations in two important subunits of the evolutionarily conserved SAGA complex, HFI1 and SPT7. Mutations in the SAGA complex are unable to coordinately induce these two sets of genes, as well as other sets of genes that are induced in the ergosterol mutants, such as stress response proteins and basic amino acid biosynthesis. ChIP-Seq analysis showed that in an erg3 mutant the SAGA complex was enriched on promoters of ergosterol synthesis and anaerobic genes. Proteomics of purified SAGA complexes from an erg3 mutant showed a differential enrichment of several transcription factors including Upc2p, Hap1, Skn7, and Pdr1, components of the SWI/SNF chromatin remodeling complex, and unexpectedly, the endocytic protein Rvs167p. Our results show that the SAGA complex plays an important role in the reprofiling of gene expression due to changes in sterol composition and our data are consistent with its role as coactivator for several different transcription factors. Coisolation of Rvs167p with the SAGA complex in the erg3 mutant and the effect of the rvs167 mutation on induction of two heat shock proteins in the erg3 mutant provide evidence for a moonlighting function in transcription for this endocytic protein.
RESULTS
Previously, using transcript microarray analysis, we showed that a series of mutants in ergosterol biosynthesis coordinately up-regulated the mRNA levels of genes involved in ergosterol biosynthesis as well as anaerobic growth (Guan et al., 2009). In addition, coordinate regulation of genes involved in other processes, such as ribosome biogenesis, sphingolipid degradation, basic amino acid synthesis, phosphate metabolism, and stress, was seen. The transcript profiles of the erg2, erg3 and erg6 mutants were very similar, so we chose to work with the erg3 mutant for this study because it grows better than the other two mutant strains. First, we confirmed the microarray findings for the ergosterol and anaerobic genes by real-time PCR using the wild-type and erg3 mutant strains (Supplemental Table 1).
Requirement of the SAGA complex
To identify genes that are required for the coordinate regulation of these two sets of genes, a selection scheme was developed. The open reading frame (ORF) and 3′ end of URA3 was placed downstream of the DAN1 promoter, which is normally expressed only under anaerobic conditions, placing expression of Ura3p under control of an anaerobic promoter. Ura3p expression permits a positive and negative selection in a ura3 mutant background. A KanMx expression cassette was included to ensure plasmid maintenance during the tests. In wild-type cells, where the DAN1 gene is normally silent, cells were not able to grow on geneticin-containing plates without uracil (SD-ura), but were able to grow on geneticin-containing plates containing uracil and 5-fluoroorotic acid (5-FOA), which requires Ura3p to be converted into a toxic compound. The opposite growth results were found with erg3 , where DAN1 is expressed under aerobic conditions (Figure 1). To select mutants that are defective in the erg3-dependent induction of DAN1, we mutagenized erg3 ura3 cells harboring the DAN1-URA3 plasmid with ethanemethanesulfonate, allowed the cells to recover from the mutagenesis, and then selected for cells that grew on geneticin containing 5-FOA plates (thus defective for DAN1 induction). Cells were then cured of the plasmid and retransformed with plasmids containing β-galactosidase (lacz) under control of the DAN1 or ERG28 promoters. Mutants that reduced the expression of β-galactosidase from both promoters when compared with the parental strain were backcrossed twice, and mutants showing a 2:2 segregation were selected. Two mutants with strong and consistent phenotypes were chosen for further analysis. Genomic DNA was isolated and sequenced from two mutant and wild-type segregants and SNPs in common among the mutants were identified. This procedure identified candidate transition mutations, expected by ethanemethanesulfonate mutagenesis, in each mutant strain. In one mutant, the SPT7 gene harbored a G to A transition leading to a stop codon at amino acid 814 (of 1332 aa) of the protein. In the other mutant, the HFI1 gene carried a C to T transition leading to a stop codon at amino acid 55 (of 488 aa) of the protein. The SPT7 and HFI1 genes encode central components required for the integrity of the SAGA complex, a transcriptional activator of gene expression (Wu and Winston, 2002). Both stop codon mutants strongly affect induction of the DAN1 and ERG28 genes in the erg3 mutant. β-Galactosidase activity was increased 78- and 16.5-fold in the erg3 mutant for the DAN1 and ERG28 driven constructs respectively, whereas the corresponding increases when combined with the hfi1-1 or spt7-1 mutations were much lower (Table 1). To verify these results, we created complete gene disruptions of the HFI1 and SPT7 genes in the wild-type and erg3 backgrounds and analyzed the expression of DAN1 and ERG28 by quantitative PCR. These results confirmed that these SAGA complex subunits are required for the increased gene expression of DAN1 and ERG28 in the erg3 mutant (Figure 2). In wild-type cells, there are no effects of SAGA mutations on the expression of the DAN1 gene, but the ERG28 transcripts are reduced ∼50%. In the erg3 mutant the SAGA mutations reduce the ERG28 transcripts to wild-type levels, suggesting a particular role of the SAGA complex in regulating gene expression under sterol deficiency. Furthermore, the induction of several other erg and anaerobic genes in the erg3 mutant is affected by spt7 and hfi1 deletion (Supplemental Figure 1). On the other hand, four of seven ergosterol synthesis genes were unaffected by the SAGA mutations in the wild-type background, suggesting a specific role for the SAGA complex in the mechanism of increased expression in the erg3 mutant.
FIGURE 1:
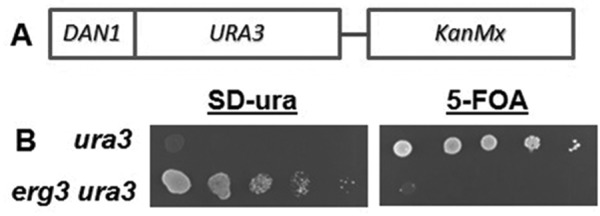
Test of selection strategy for mutants unable to induce anaerobic genes. (A) Gene fusion of the DAN1 promoter with the ORF of URA3. (B) Cells were prepared and 10-fold dilutions were spotted onto SD plates without uracil or with uracil and 5-FOA. A representative example is shown. The selection for mutant isolation required the mutated erg3 ura3 strain to grow on 5-FOA.
TABLE 1:
Quantification of β-galactosidase activity from cells with lacZ controlled by the DAN1 or ERG28 promoter in wild type, erg3, and the backcrossed point mutants, spt7-1 and hfi1-1, in the erg3 background.
| Strain | DAN1-lacZ | ERG28-lacZ |
|---|---|---|
| Wild type | 0.3 | 28.3 |
| erg3 | 23.5 | 464.8 |
| erg3 spt7-1 | 1.8 | 80 |
| erg3 hfi1-1 | 2.8 | 152 |
Representative data from one experiment are shown.
FIGURE 2:
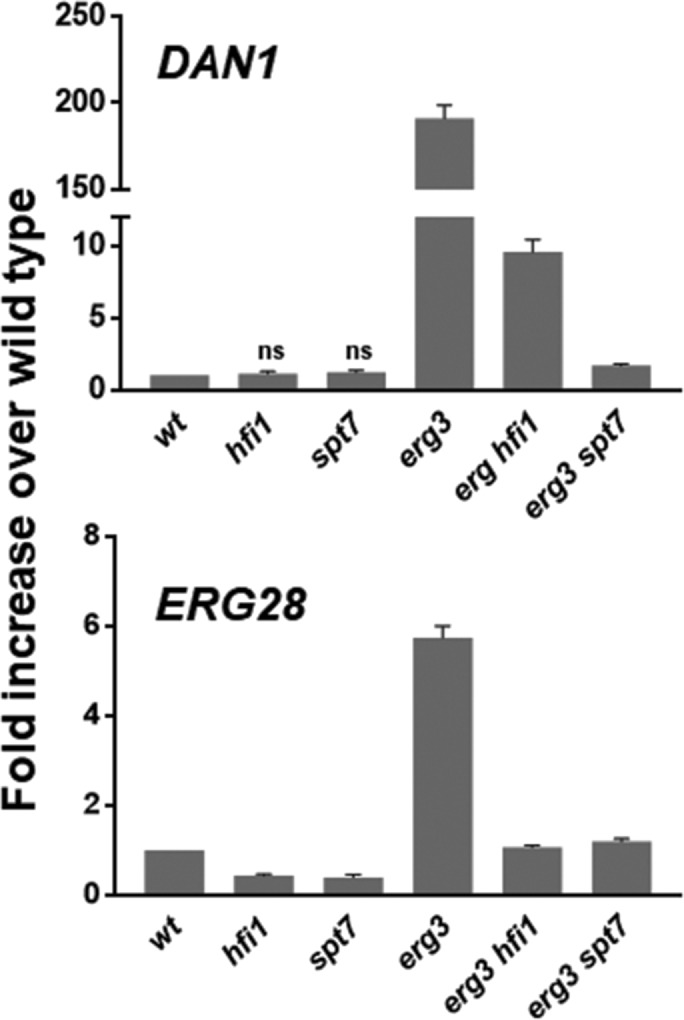
Effects of spt7Δ and hfi1Δ mutations on expression of the anaerobic gene DAN1 and the ergosterol biosynthesis gene ERG28 in wild-type and erg3 mutant backgrounds. Cells were grown in rich medium to early log phase, and RNA was extracted and quantified by qPCR. The hfi1 and spt7 mutations strongly reduce the erg3-dependent gene induction. The results are averaged from three experiments. The data from the hfi1 and spt7 mutants were compared pairwise with the wild type and erg3 mutants by a T test. The p value was always <1.25 × 10⁻⁴.
Relocation of the SAGA complex in the erg3 mutant
The positive function of the SAGA complex that has been revealed in the erg3 mutant suggests that the complex is working on a specific set of genes when sterol composition is altered. To probe the localization and interaction partners of the SAGA complex in wild-type and erg3 mutant cells we amplified tandem affinity purification (TAP)-tagged SPT7 and HFI1 genes (Ghaemmaghami et al., 2003) by PCR and introduced them into our wild-type and erg3 mutant strains in place of the wild-type genes. The TAP-tagged complex was isolated from wild-type and erg3 mutant cells using a one-step purification (Lempiainen et al., 2009), and the proteins were analyzed by SDS–PAGE and silver staining (Figure 3). The subunit composition of the complex from both wild-type and erg3 mutant cells resembles that found previously (Wu and Winston, 2002; Sermwittayawong and Tan, 2006), and only minor differences are seen whether the complex was purified using the SPT7-TAP or HFI1-TAP tags. Furthermore, no obvious differences were seen when comparing the complexes purified from wild-type and erg3 mutant strains, suggesting that major differences in subunit composition cannot explain a specific role of the SAGA complex in the erg3 mutant.
FIGURE 3:
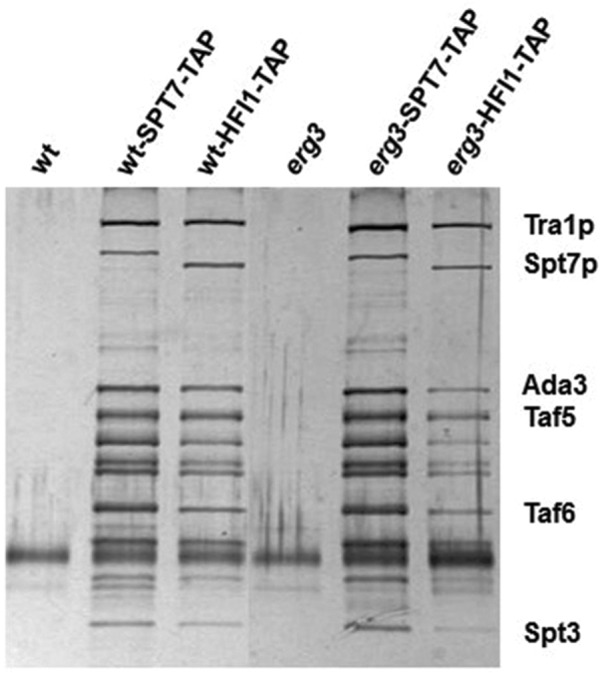
Purification of the SAGA complex from wild type and erg3 mutants. Wild-type or erg3 strains with SPT7 or HFI1 tagged with TAP were purified in a single step and analyzed by SDS–PAGE and silver staining. Control purifications from untagged strains are also shown. The subunit composition looks similar after purification with either tag or from either TAP tagged strain. Bands were identified by comparison with published results (Sermwittayawong and Tan, 2006). A single representative example is shown from at least three experiments.
To investigate the positioning of the SAGA complex on the yeast chromosome in the wild-type and erg3 mutant cells, we performed chromatin immunoprecipitation sequencing experiments (ChIP-Seq; Huber et al., 2011) using our TAP-tagged HFI1 and SPT7 constructs (see Materials and Methods for details). Cells were cross-linked with formaldehyde, harvested, and disrupted with lysis buffer using zirconium/silica beads. After shearing, complexes were isolated using rabbit immunoglobulin G (IgG)-coupled magnetic beads from precleared extracts and washed before de-cross-linking and DNA purification. DNA sequences were obtained, and sequence reads were analyzed. The overall analysis of the results shows that the correlation between promoter recoveries is very high whether the ChIP-Seq experiment was done using HFI1-TAP or SPT7-TAP in either wild-type or erg3 cells, demonstrating the high quality of the data. The correlation scatter plot (Figure 4) also shows a good correlation when comparing promoter recoveries from wild-type and erg3 cells; however, there is a conspicuous broadening of the scatter plot with an increase in recoveries of certain promoters in erg3 cells. This suggests that mostly the same sites are occupied by the SAGA complex in the wild type and erg3 mutant but that some promoters seem to be recovered more efficiently in the erg3 mutant. To obtain a more general impression of the changes of SAGA complex promoter occupancy induced by the changes in sterol structures, we ranked the promoter sequences by their fold enrichment in the erg3 mutant compared with the wild type after IP with the SPT7-TAP construct (complete results in Supplemental Table 2). Among the top 32 hits, which represents ∼ 0.5% of the genome, we found four genes that are specifically expressed under anaerobic conditions and 10 genes involved in ergosterol biosynthesis, resulting in an astounding 87-fold enrichment for genes annotated (Gene Ontology) in the ergosterol biosynthesis pathway and a 188-fold enrichment for genes with an expression profile similar to that of DAN1 (20 genes total, as found on the Saccharomyces Genome Database; http://spell.yeastgenome.org/search/show_results?search_string=YJR150C).
FIGURE 4:
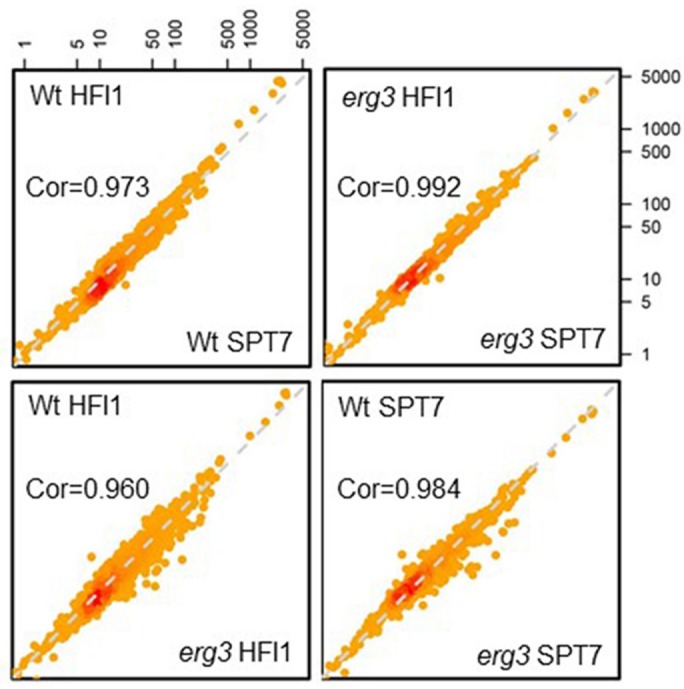
Overview of ChIP-Seq results. ChIP-Seq experiments were performed on wild-type or erg3 strains using either TAP-tagged HFI1 or SPT7. Each dot represents one promoter, and the value (in log scale) is the quantification of ChIP-seq signal at that promoter. Global correlations between conditions (TAP tag or the yeast strain) are indicated. ChIP-Seq results are highly correlated when different tags are used in either wild-type or erg3 mutant cells. The correlation is less tight when comparing the results with the same Tag in wild type vs. erg3 mutants, indicating a change in promoter occupancy. The ChIP-Seq experiment was performed once.
To visualize better and compare the enrichments seen by ChIP-Seq with the increases in transcript levels seen previously (Guan et al., 2009), we compared their enrichment using a scatter plot (Figure 5). There is a striking enrichment of anaerobic genes (green circles) and ergosterol metabolism genes (blue rectangles) among the genes showing coenrichment (red dots). One of these genes (HES1) is involved in ergosterol metabolism and is expressed under anaerobic conditions. These data provide additional evidence for the highly specific effect on transcription, correlated with chromosome positioning, exerted by the SAGA complex on these two sets of genes. Therefore we conclude that the SAGA complex responds to changes in sterol composition by increasing its occupancy of promoters of anaerobic and erg genes and this seems to reflect a broad change in behavior to coordinate the new pattern of gene expression.
FIGURE 5:
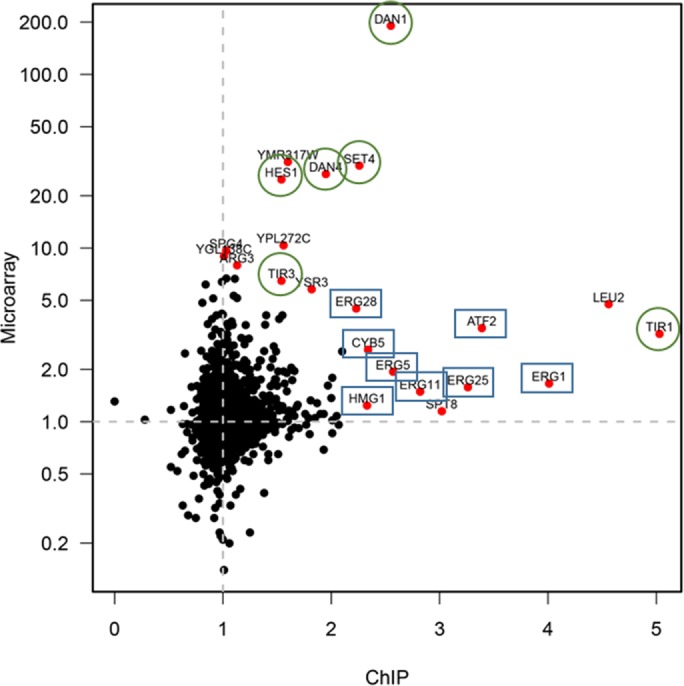
Comparison of the ChIP-Seq and microarray experiments all genes. ChIP-seq results were quantified in the wild-type and erg3 mutant strains using either the SPT7-TAP or HFI1-TAP. Promoter recovery from the erg3 mutant divided by the recovery from the wild type is shown on the x-axis. The fold increase of transcript levels in erg3 over the wild type is shown on the y-axis. Genes involved in ergosterol metabolism (blue rectangles) and whose expression is increased under anaerobic conditions (green circles) are highlighted. HES1 is expressed under anaerobic conditions but is a member of the oxysterol-binding family of proteins (Jiang et al., 1994), proposed to be involved in transfer of sterols between membranes (de Saint-Jean et al., 2011).
Changes in proteins associated with the SAGA complex in the erg3 mutant
Figure 3 demonstrates that the basic subunit composition of the SAGA complex probably does not change between the wild type and the erg3 mutant. However, as the SAGA complex is abundant and localizes at many chromosomal locations, it is likely that many recruited factors could be present in substoichiometric amounts and/or bind to the complex with low affinity. Therefore we sought to characterize the SAGA complexes in the wild type and the erg3 mutant by using sensitive semiquantitative proteomics. The complex was purified from the wild-type and erg3 strains using the Spt7-TAP tag, and then the relative signals for the recovered proteins were determined. The complete results are shown in Supplemental Table 3. A total of 208 proteins were detected in duplicate experiments. In the two experiments, 52 and 31 proteins were recovered two times more efficiently in the SAGA complex purified from the erg3 mutant. More proteins, 69 and 49, were enriched at least 1.5-fold. The subunits of the SAGA complex were robustly detected from both wild-type and erg3 mutant strains. The apparent signals were similar from the wild type and the erg3 mutant, and while there was some variation in the detection of the different subunits, the signal was relatively similar and strong. Therefore we conclude that the basic subunit composition was not changed, consistent with the analysis by SDS–PAGE. Next we focused on weaker signals that either were found only with complex isolated from the erg3 mutant or whose signal was greater than double that found with complex isolated from the wild type. Among the proteins preferentially associated with the SAGA complex in the erg3 mutant, we found eight subunits, Snf5p, Snf6p, Snf12p, Swp82p, Arp5p, Arp7p, Tri1p, and Taf14p, associated with the SWI/SNF chromatin remodeling complex. Subunits of this complex were approximately twofold more enriched in the complex purified from erg3 cells. This complex has been shown to interact functionally with the SAGA complex and is responsive to hypoxia in yeast and animal systems (Laurent et al., 1991; Peterson et al., 1994; Chandy et al., 2006; Kenneth et al., 2009; Dastidar et al., 2012). It has been proposed that histone acetylation by the SAGA complex predisposes the SWI/SNF complex to displace nucleosomes from promoters, thus allowing an increase in transcription. We also identified several known transcription factors, including Pdr1p, Skn7p, Upc2p, and Hap1p, some of which were detected only in the purification from erg3 cells, as well as several other proteins, including Rvs167p (see below), a protein involved in endocytosis (Munn et al., 1995). Table 2 shows the relative recovery of some of these proteins as determined by semiquantitative proteomics. Spt3p, a component of the SAGA complex, is included in this table for reference.
TABLE 2:
Enrichment of proteins with the SAGA complex from the erg3 mutant.
| Gene | Expt 1 erg3/wt | Expt 2 erg3/wt |
|---|---|---|
| ARP7 | 2.20 | 1.49 |
| SNF5 | 2.92 | 1.79 |
| HAP1 | 13.21 | 3.82 |
| PDR1 | Infinite | Infinite |
| SKN7 | Infinite | Infinite |
| UPC2 | 7.67 | Infinite |
| RVS167 | Infinite | Infinite |
| SPT3 | 1.29 | 1.12 |
The SPT7-TAP tagged SAGA complex was purified from wild type and erg3 mutants and analyzed by semiquantitative proteomics. The relative signals of two subunits of the SWI/SNF complex (Arp7p, Snf5p), transcription factors (Hap1p, Pdr1p, Skn7p, Upc2), Rvs167p, and a SAGA complex subunit (Spt3p) are shown. Two independent experiments were analyzed with duplicate measurements (average is shown).
Next we concentrated on the roles of the four transcription factors because Upc2p and Hap1p have been implicated in regulating sterol biosynthesis and response to oxygen (Creusot et al., 1988; Lewis et al., 1988; Abramova et al., 2001; Ter Linde and Steensma, 2002). We constructed mutants of the transcription factors in the erg3 mutant strain and tested their effects on mRNA levels for anaerobic and ergosterol gene expression by quantitative PCR (Figure 6). The upc2 mutation abrogates completely the induction of the anaerobic gene DAN1 in the erg3 mutant but had only a partial effect (∼50%) on induction of the ERG28 gene. The hap1 mutation decreased induction of DAN1 by 30%, and ERG28 by 35%, which is much less than SAGA mutants. The pdr1 mutant slightly reduced DAN1 expression but had no effect on ERG28, and the skn7 mutant increased expression of both DAN1 and ERG28 genes. In contrast, the SAGA mutants, hfi1 and spt7, completely blocked the induction of ERG28. The effect was also very strong (>85%) on DAN1, but somewhat less than upc2, although the biological significance of these small differences is difficult to assess. These data confirm the crucial role of Upc2p in anaerobic gene expression, but also that control of ergosterol genes is more complex and not solely dependent on a single transcription factor. Consistent with this, the transcription factor mutations, upc2 and hap1, lowered, but did not completely block, the induction of ERG28 in the erg3 mutant. This could be explained if the recruitment of multiple transcription factors to erg gene promoters by the SAGA complex is required for their induction. This points to a role of the SAGA complex in coordinating the transcriptional response to changes in ergosterol, most likely through interaction with transcription factors and via chromatin remodeling, its known functions. To see whether the role of the SAGA complex might be broader than the control of anaerobic and ergosterol genes, we tested two other pathways whose transcription was induced in the erg3 mutant, stress and basic amino acid synthesis (Guan et al., 2009). As a marker of the stress pathway we used HSP42, encoding a small heat shock protein that responds to different stresses (Gu et al., 1997; Haslbeck et al., 2004; Tkach et al., 2012), and ARG3, encoding ornithine carbamoyltransferase (Messenguy, 1976). The induction of HSP42 in the erg3 mutant is completely abrogated by SAGA mutations, and the erg3-dependent increase was reduced by ∼50% by deletion of the transcription factors PDR1 or SKN7, but unaffected by deletion of HAP1 and even increased by deletion of UPC2. For the ARG3 gene, only the pdr1 mutation has a small, but significant, effect, even though the SAGA complex mutations reduced the expression to wild-type levels in the erg3 mutant. These results are consistent with the copurification of these transcription factors with the SAGA complex from the erg3 mutant and support a broad role of the SAGA complex in orchestrating the change in transcriptional profile in response to changes in ergosterol, most likely through a combination of mechanisms including positioning on the chromosome, acting as a coactivator of transcription and as a chromatin modifier.
FIGURE 6:
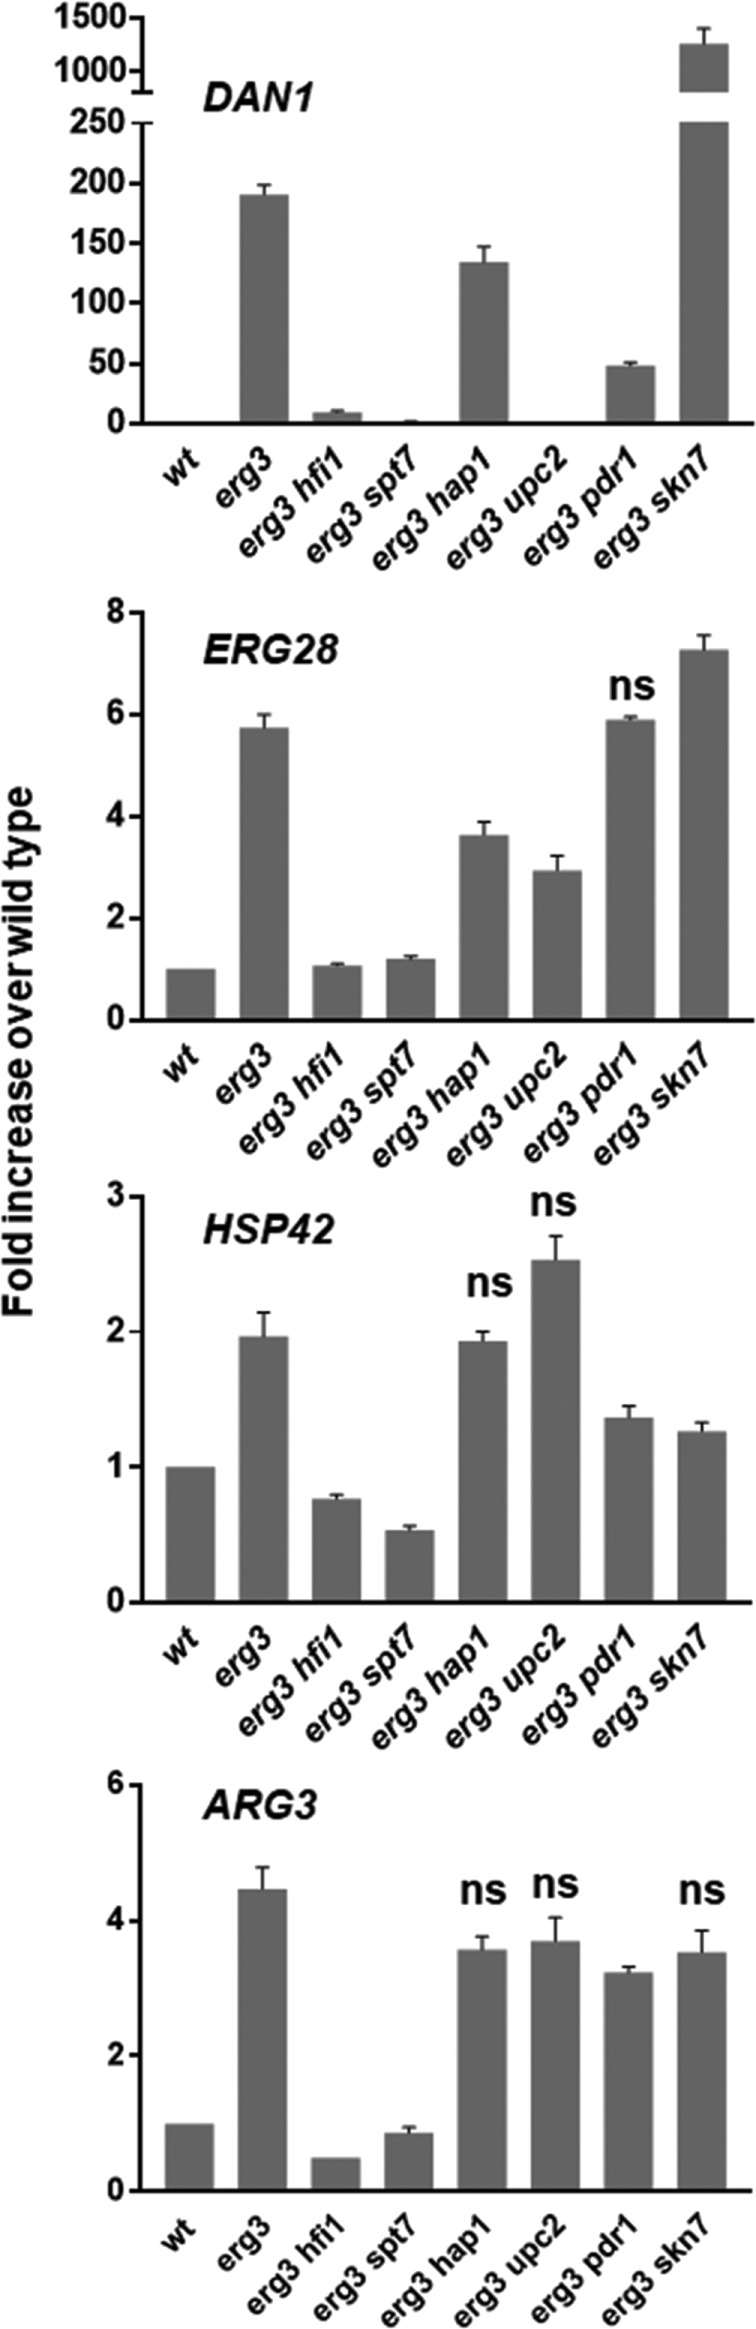
qPCR quantitation of mRNA levels in SAGA and transcription factor mutants. mRNA levels of DAN1, ERG28, HSP42, and ARG3 were determined by qPCR in wild type, erg3, and erg3 double mutants. Mutations in the SAGA complex reduce erg3-dependent induction to wild-type levels for all genes probed. The only other double mutant to completely reduce the erg3-dependent induction to wild-type levels is erg3 upc2 for the anaerobic gene, DAN1. The averages are from triplicate experiments. The data from all double mutants were compared pairwise with those of the erg3 mutant. Results that were not significantly different are labeled (ns). All other p values were <4 × 10⁻².
Moonlighting function of Rvs167p
A prominent protein that was coisolated with the SAGA complex from the erg3 mutant, but not detected in the proteomics experiment from wild type, is Rvs167p. RVS167 was first identified in a screen for reduced viability upon starvation (Desfarges et al., 1993) and was subsequently shown to be suppressed by mutations in sphingolipid biosynthesis (Sivadon et al., 1997) and to play a role in the internalization step of endocytosis and actin organization (Munn et al., 1995; Kaksonen et al., 2005). Rvs167p can be found associated with Rvs161p, and the two have been proposed to function together in endocytosis (Lombardi and Riezman, 2001). Rvs167p has a BAR domain (Balguerie et al., 1999), which has been suggested to play a role in membrane constriction during endocytosis (Myers et al., 2016). Like other BAR domains, the Rvs167p BAR domain interacts with membranes in a curvature-dependent manner, and mutations affecting lipid composition can affect its interaction with actin cortical patches involved in endocytosis (Youn et al., 2010). Rvs167p has been identified in a systematic screen as a lipid-binding protein (Gallego et al., 2010). As the described function and localization of Rvs167p is at the plasma membrane, we were surprised to find it associated with the SAGA complex, especially as its peptides were identified with similar efficiency as for the transcription factors described above despite not being more abundant in cells. However, Rvs167p was recently identified as a probable cargo of the nuclear export factor, Crm1p (Kirli et al., 2015), implying that it transits through the nucleus. To provide additional evidence to support the proteomics results, we isolated the Spt7-TAP tagged SAGA complex and assayed for the presence of the Rvs161 and Rvs167 proteins in the purified fraction by Western blotting (Figure 7). The specificity of the antisera was confirmed by comparing wild-type and the relevant rvs161 or rvs167 deletion strains. The expected size and an additional slower migrating band were detected for Rvs167p, the latter potentially corresponding to a ubiquitinated form (Stamenova et al., 2004). In two separate experiments we could confirm the coisolation of Rvs167p with the SAGA complex in erg3 cells, whereas Rvs161p was not found. However, using this method we could also detect the Rvs167 protein, albeit less abundantly, associated with SAGA complex isolated from wild-type cells. This confirms association of Rvs167p with the SAGA complex and its increase in the erg3 mutant found from the proteomics data and is consistent with a possible function of Rvs167p that is independent of Rvs161p.
FIGURE 7:
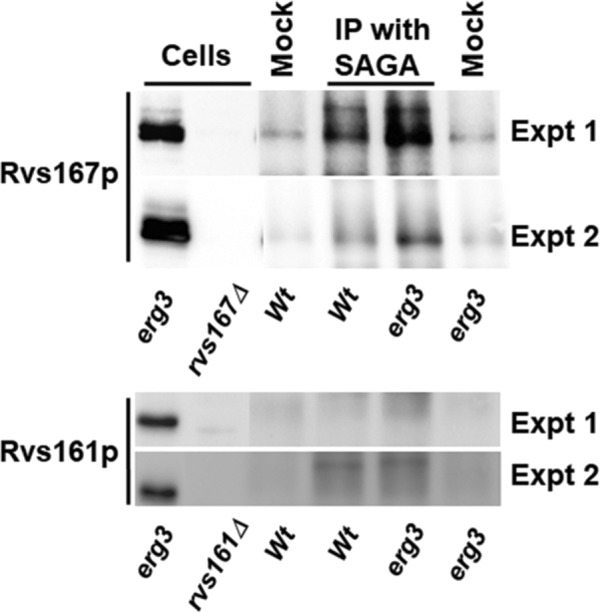
Copurification of Rvs167p with the SAGA complex. Total cell extracts were prepared from erg3, rvs161Δ, and rvs167Δ cells and separated by SDS–PAGE and processed for Western blotting to validate the antisera. The SAGA complex was purified using a one-step procedure based on the TAP tag from wild-type or erg3 cells with (IP with SAGA) or without (Mock) TAP-tagged SPT7. The purified proteins were separated by SDS–PAGE and analyzed by Western blotting. The results from two independent experiments are shown.
To determine the localization of Rvs167p in wild-type and erg3 mutant cells, we created strains with chromosomally tagged Rvs167-GFP (green fluorescent protein) and Spt7-mCherry, as a marker for the nucleus. As expected, SPT7-mCherry clearly marked the nucleus in both wild-type and erg3 mutant cells. Also as expected, Rvs167-GFP could be seen in punctate spots at the plasma membrane in wild-type and erg3 mutant cells, as well as a diffuse staining throughout the cells. The punctate localization of Rvs167-GFP is strongly reduced in erg3 cells (Figure 8A) as quantified using Cell Profiler (Figure 8B) and corrected by removal of the background fluorescence determined by using cells not expressing Rvs167-GFP (see Supplemental Figure 2). Interestingly, the alpha factor internalization profiles of the erg2 mutant and the rvs167 mutants are similar at 24°C, characterized by a slower rate of uptake and a reduced plateau (Munn et al., 1995, 1999), suggesting that the endocytic phenotype seen in the erg2 mutant under these conditions might be due to a reduction of the Rvs167p localized in the punctate dots at the plasma membrane in the absence of ergosterol.
FIGURE 8:

Localization and role of Rvs167p in erg3-dependent gene induction of HSP42 and HSP104. (A) RVS167-EGFP and SPT7-mCherry were visualized in wild-type and erg3 mutant cells. Raw data, two deconvoluted images, and deconvoluted merged images are shown. Puncta of RVS167-EGFP are clearly less intense in the erg3 mutant. The arrows points to cells with a strong Spt7-mCherry signal indicating a focus plane on the nucleus. One can see the corresponding RVS167-EGFP signal in the nucleus in the adjacent panel. (B) Cells were segmented into puncta, cytoplasm, and nucleus (overlap with SPT7-mCherry) and quantified as described after background subtraction (Supplemental Figure 2) for the EGFP signal. The nucleus/cytoplasm ratio of the EGFP intensity is shown. No error bars are shown for the top panel because they would not be seen anyway. The p values from a T test are shown. (C) mRNA levels in wild type, erg3, erg3 rvs167, and erg3 rvs161 were quantified by qPCR, and the mRNA levels were divided by the wild-type levels. Mutation of rvs167 abrogated the erg3-dependent induction of HSP42 and HSP104, but not the other genes. The data are from triplicate experiments. The data from all double mutants were compared pairwise with the erg3 mutant. Results that were not significantly different are labeled (ns). All other p values were <5 × 10⁻³.
The total Rvs167-GFP signal in the cytoplasm was greater than elsewhere, and its intensity was significantly higher over the nucleus and cytoplasm in erg3 mutant cells. This difference can be seen by visual inspection of the deconvoluted slices with a focus on the SPT7-mCherry signal (Figure 8A, arrows) and by quantitative assessment. The intensity of the Rvs167p signal over the nucleus is ∼80% of the intensity over the cytoplasm, and this percentage is significantly increased in the erg3 mutant (Figure 8B). Although the amounts of Rvs167-GFP are low in the nucleus, the amounts present are consistent with its coisolation with the SAGA complex as detected by proteomics and Western blotting. It is possible that this small difference in the amount of nuclear localization can explain the increased amount isolated with the SAGA complex from erg3 mutant cells. Because the finding of Rvs167p in the nucleus is consistent with its purification with the SAGA complex, we next tested whether its deletion can affect gene induction in the erg3 mutant. As control for a defect in endocytosis we also deleted RVS161, which works with Rvs167p for endocytosis but which was not found in our SAGA purification. As can be seen (Figure 8C), RVS167 deletion specifically abrogated the induction of HSP42 and HSP104 but had no effect on the expression of the other genes tested. This is not due to an endocytic phenotype because RVS161 was not required for induction of any of these genes in the erg3 mutant. Deletion of RVS161 caused an increase in DAN1 and ERG28 transcripts. We do not have an explanation for this finding, but these changes are in the opposite direction from that seen with RVS167. The localization, copurification with SAGA, and effects on transcription suggest a novel function for Rvs167p, which is independent of its associated homologous partner, which lacks the BAR domain.
DISCUSSION
The main finding of this study is that the SAGA complex plays a crucial role in carrying out a wide range of specific changes in the transcriptional profile in response to changes in sterol composition in the erg3 mutant. This conclusion is based on genetic evidence as well as experiments examining the physical location and interactions of this complex in wild-type and erg3 cells. These results suggest that the SAGA complex acts as a coactivator of transcription for ergosterol and anaerobic genes, as well as other gene classes, such as basic amino acid synthesis and stress response. Deletion of the SAGA complex affects the expression of only some of these genes in wild-type cells; however, the effects of its deletion are much stronger in the erg3 mutant and are seemingly commensurate with the size of the increase caused by the sterol deficiency. Therefore it seems that the proportional role of the SAGA complex in the expression of anaerobic genes and erg genes increases in the erg3 mutant.
The SAGA complex seems to coordinate the increased expression of other sets of genes, including those for basic amino acids and some involved in stress. It is a coactivator of transcription that is postulated to connect the preinitiation complex with epigenetic chromatin modifications. It has several chromatin modification activities, including a histone acetyltransferase and deubiquitination modules that map to distinct parts of the complex (Durand et al., 2014). SAGA-acetylated nucleosomes have been shown to be displaced by the SWI/SNF complex (Chandy et al., 2006). Indeed, we found an increased association of SWI/SNF complex proteins with the isolated SAGA complex (twofold) from the erg3 mutant, suggesting an increased transcriptional activity where these proteins interact. This is one possible mechanism to increase transcription without necessarily increasing transcription factor association or changing the location of the complex on the chromosome. This sort of mechanism could be important for the SAGA-dependent induction of genes for which we did not detect an increased promoter occupancy or identify an increase in recruitment of specific transcription factors.
For many Erg and anaerobic genes, the SAGA complex seems to be enriched on their promoters in the erg3 mutant compared with wild-type cells and is associated with transcription factors involved in their regulation. For anaerobic gene induction, transcription factor recruitment could play a key and direct role in the erg3 mutant. Deletion of UPC2 completely blocked anaerobic gene expression, and it could be responsible for recruitment of the SAGA complex for this regulation. Upc2p has been shown to bind sterol, and in the absence of sterols it moves from the cytoplasm to the nucleus (Yang et al., 2015), it can bind to anaerobic gene promoters and, we propose, recruit the SAGA complex. Although unexplored for the moment, it is likely that the sterol produced in the erg3 mutant, lacking the Δ5 double bond, does not bind Upc2p with high affinity. On the other hand, this mechanism alone cannot explain the increase in Erg gene expression, because even in the absence of Upc2p, the ERG28 gene was still partially induced in response to sterol alteration. Therefore Upc2p relocation to the nucleus in response to sterol changes is not absolutely required for ERG28 gene induction, which we assume is an indicator for other ergosterol biosynthesis genes that behave similarly in transcript profile and SAGA occupancy. It is possible that multiple transcription factors regulate the ergosterol biosynthesis genes and elimination of just one of these, or their regulation, does not abrogate SAGA recruitment and function.
In the case of genes involved in basic amino acid synthesis, we found a small increase in the presence of the SAGA complex on their promoters, but we did not identify any transcription factors involved in their regulation (Raitt et al., 2000; Schuller et al., 2007) by our copurification experiments. For the stress genes, HSP42 and HSP104, we did not find any consistent erg3-specific enrichment in SAGA localization over the promoter, but we did identify two transcription factors required for their regulation, Pdr1p and Skn7p, that are enriched with the SAGA complex under sterol deficiency. Among the other heat shock promoters, some showed an increased SAGA localization over their promoters, while others did not (Supplemental Table 2). It is possible that the amount of SAGA on some heat shock promoters in wild-type cells is already sufficient to regulate their genes and no increase in erg3 mutants would be necessary. The change in regulation could be carried out through interaction with transcription factors.
In surprising results, we discovered that Rvs167p, which has previously been shown to play a direct role in the internalization step of endocytosis, associates with the SAGA complex, detected only in the erg3 mutant, and is required for the erg3-dependent increase in HSP42 and HSP104 mRNA expression. It seems that these three factors, Rvs167p, Pdr1p, and Skn7p, work together with the SAGA complex to regulate the increase in transcription under sterol deficiency. These two heat shock proteins are involved in preventing and reversing protein aggregation and thus have a common function (Cashikar et al., 2005), consistent with a physiological coregulation through Rvs167p. Furthermore, both HSP42 and HSP104 show increased mRNA under carbon (Bradley et al., 2009) and nitrogen (Gasch et al., 2000) starvation, conditions under which the rvs167 mutant shows reduced viability. Several proteins involved in endocytosis have been shown to play additional roles in nuclear signaling and transcription in animal cells and tissues (Pyrzynska et al., 2009). In particular, Bin1/amphiphysin II, a potential orthologue of Rvs167p, has been shown to functionally interact with Myc (Elliott et al., 1999). Rvs167p interacts structurally and functionally with Rvs161p for its endocytic function (Lombardi and Riezman, 2001), and the stabilities of the two proteins are interdependent, but not symmetrical. Deletion of RVS167 destabilizes Rvs161p much more than deletion of RVS161 destabilizes Rvs167p. This would be consistent with the moonlighting function of Rvs167p and suggests that the latter is probably stabilized by homotypic assembly or binding to another protein involved in the SAGA-dependent regulation of the HSP42 and HSP104 genes.
As the results with Rvs167p were unexpected, we performed control experiments that showed that the protein localization changes in the erg3 mutant when compared with wild type. It was less associated with punctate dots at the plasma membrane and higher in cytosol and nucleus. It is possible that the entry of Rvs167p into the nucleus is passive. The molecular weight cutoff for diffusion across the nuclear pore has been suggested to be ∼60 kDa (Wang and Brattain, 2007), but this would depend on the shape of the molecule. Rvs167p is below this limit (53 kDa), but when fused to GFP would be above this value (80 kDa), so the amounts of the fusion protein that we saw over the nucleus could be an underestimate. By Western blotting, where we detected the native protein, we detected a robust signal copurifying with the SAGA complex. In any event, it seems that the concentration of Rvs167p in the nucleus is slightly, but significantly, higher in the erg3 mutant. The function of Rvs167p in the nucleus is not an indirect consequence of the block in the endocytic pathway because the rvs161 mutant, which has the same endocytic phenotype as rvs167, did not block the erg3-dependent induction of HSP42 and HSP104. Furthermore, the finding, in a screening, that Rvs167p is a direct or indirect cargo of Crm1p (cargo B; Kirli et al., 2015) can now be interpreted in functional context.
The SAGA complex clearly plays a central role in translating the sterol deficiency into a new pattern of transcription. From our data it seems that several different mechanisms are likely to play a role in this process. This is not surprising given the structural complexity of the SAGA complex and its complex interactions in the cell. In some cases, an increase in promoter occupancy by the SAGA complex seems to correlate with the increase in transcription. This is clearly the case for many genes involved in the anaerobic pathway and ergosterol biosynthesis. However, for other transcriptional activation pathways, different mechanisms must exist. Among these could be enhanced interaction with transcription factors or other factors, for instance, RVS167p, an increased interaction with the SWI/SNF complex, or epigenetic changes carried out by the SAGA complex.
The regulation of these mechanisms by ergosterol structure and quantities is still a mystery. Our selection for mutants that would interrupt the coregulation of anaerobic genes and ergosterol genes was designed to find genes that are required for sterol sensing and its connections to transcription. However, there is no direct evidence that the SAGA complex directly binds sterols. We propose that there is not a single sensor for sterols in the cells, but multiple ones, probably with some overlapping function. One of these sensors is likely to be Upc2p, but it can only fully account for the signaling to the pathway for induction of the anaerobic genes. In this model, the SAGA complex would be the sought-after cotranscriptional activator for Upc2p, which would help explain its function in transcription. Upc2p did not have an easily predictable binding site for sterols, so it is quite possible that several new sterol-binding proteins acting in this pathway can be found. Now that we have identified some players in the mechanism changing the transcriptional profile under ergosterol, it should be possible to decipher other mechanisms for sterol sensing and their connections to the SAGA complex.
MATERIALS AND METHODS
Plasmid construction
pFA6a-pDAN1-lacZ-kanMX3-CEN/ARS was derived from pFA6a- lacZ-kanMX3 (Wach et al., 1994). The pRS416 CEN/ARS sequence was amplified by PCR and introduced into pFA6a- lacZ-kanMX3 at the EcoRI/SpeI sites of the polylinker, in order to use this plasmid for yeast transformation. Of the DAN1 promoter (pDAN1), 800 base pairs was amplified by PCR and subcloned into pFA6a-lacZ-kanMX3-CEN/ARS at the BamHI/PacI sites of the polylinker, just in front of the lacZ-kanMX3 cassette, introducing an ATG at the PacI site. For pFA6a-pERG28-lacZ-kanMX3-CEN/ARS, a similar construct using 500 base pairs of the promoter region of ERG28 gene was used. For pFA6a-pDAN1-URA3-kanMX3-CEN/ARS and pFA6a-pERG28-URA3-kanMX3-CEN/ARS the lacZ region was replaced by URA3, amplified by PCR from the pRS416 (URA) plasmid. URA3 was subcloned using PacI/AscI in order to keep the ADH terminator after URA3. To create pFA6a-pDAN1-URA3-hphMX3-CEN/ARS and pFA6a-pERG28-URA3-hphMX3-CEN/ARS we exchanged the kanMX cassette with the hygromycin (hphMX3) cassette from plasmid pAG34 using BglII/PmeI restriction enzymes. The plasmids used in this study are listed in Supplemental Table 4.
Yeast media and gene deletion
Yeast strains were routinely grown in YPUAD medium (2% glucose [Merck, Darmstadt, Germany], 2% Bacto Peptone [Difco, Allschwil, Switzerland], 1% yeast extract [Difco], 10 mM 2-(N-morpholino)ethanesulfonic acid [Sigma-Aldrich, Steinheim, Germany], 40 mg/l l-tryptophan [Sigma-Aldrich], uracil [Sigma-Aldrich], and adenine ([Sigma-Aldrich]) to early log phase, except for mutant selection. The deletion strains were generated by replacing the genomic copy by the selectable kanMX6 or loxP-kanMX-loxP cassette in wt (RH 2879) and erg3 strains (RH5702) or by disruption in an isogenic diploid and tetrad dissection. The gene deletion cassette was amplified by PCR from pFA6a-kanMX6 (Longtine et al., 1998) or pUG6-loxP-kanMX-loxP (Gueldener et al., 2002) with the oligonucleotides of the genes to be deleted. The wild-type strain RH2879 was transformed with the lithium acetate method (Gietz and Woods, 2002), and the erg3 mutant strain RH5702 was transformed with a high-efficiency electroporation method. Briefly, 50 ml of cells was grown in YPUAD medium to 1–1.5 OD600 units. Cells were harvested by centrifugation and resuspended in 25 ml lithium acetate buffer (0.1 M LiAc, 10 mM dithiothreitol, 10 mM Tris-HCl, pH 7.5, 1 mM EDTA) for 1 h. Cells were washed and resuspended in 200 µl of 1 M cold sorbitol, and 80 µl was used for electroporation. The electroporated cells were incubated in 2 M sorbitol/YPUAD for at least 3 h before plating on a selective geneticin plate. We found that electroporation techniques were the most efficient method for introducing DNA into the erg3 mutant.
EMS treatment
The reporter construct for gene induction and selection, the pDAN1-URA3 plasmid (plasmid 3140), was introduced into the erg3 strain, which was grown overnight, and 5 × 10⁸ cells were resuspended in 10 ml of 50 mM KPO4, pH 7.0. Chemical mutagenesis was carried out with 240 µl per 8 ml of culture of ethyl methanesulfonate (EMS) with gentle rotation on a shaker platform for 30 min at 30°C. Mutagenesis was stopped with 8 ml of 10% sodium thiosulfate. EMS-treated cells were split into 20 aliquots, grown overnight at 30°C, and plated onto 5-FOA + geneticin selective medium. After 3 d of growth on the selective medium, colonies were replica plated on YPUAD + geneticin to ensure that mutations were from plasmid loss. Six colonies were picked per aliquot and retransformed with the plasmids pDAN1-lacZ-hphMX (plasmid 3143) and pERG28-lacZ-hphMX (plasmid 3144), respectively, to control the mutation with a β-galactosidase assay. Mutants with a low β-galactosidase activity for both genes were selected. A quantitative real-time PCR (qPCR) quantification of DAN1 and ERG28 genes on the clones that had a resistance to 5-FOA and a reduced β-galactosidase activity was carried out, and the mutants were backcrossed twice to a wt strain.
Untreated cells and EMS-treated cells were plated on separate YPUAD plates to calculate the percentage survival of mutants using the equation (CFU treated plate/CFU untreated control) × 100, and the result was from 53%–68% survival. The percentage of mutation was from 2.5%–10% (CFU 5 –FOA + geneticin/CFU SD + all amino acids + geneticin), and the plasmid loss during the experiment was between 30 and 50%.
β-Galactosidase assay
After introduction of pDAN1-lacZ (plasmid 3143) and pERG28-lacZ (plasmid 3144) into erg3 EMS mutants the cells were grown overnight at 30°C and then aliquoted (300 µl) in a 96-well plate. The cells were centrifuged, washed, and resuspended in 100 µl of Z-buffer adapted from Kippert (1995; 60 mM Na2HPO4⋅7H2O, 40 mM NaH2PO4⋅H2O, 10 mM KCl, 1 mM MgSO4⋅7H2O, 50 mM β-mercaptoethanol, 0.2% sodium lauroylsarcosine). The cell density was measured at OD720 nm, and the cells were permeabilized at 30°C for 30 min. ONPG (orthonitrophenyl-β-galactoside; 25 µl of 4 mg/ml) was added and incubated for 60 min at 30°C. The reaction was stopped with 60 µl of 1 M Na2CO3, and orthonitrophenol liberation was quantified in the spectrophotometer at OD420 nm. The activity was converted into Miller units with the following conversion: (OD420 × 1000)/OD720 × culture volume (ml) × assay time (min).
RNA extraction and qPCR
Yeast strains were grown in triplicate to OD600 = 0.8–1. The cells (2 ml) were centrifuged, frozen in liquid nitrogen, and stored at –80°C. Total RNA extraction was performed using the RNeasy Mini Kit (Qiagen No: 74104) mechanical disruption protocol including a column DNase treatment. RNA quantity and purity was controlled using a spectrophotometer: ratios 260/280 (protein contamination) and 260/230 (guanidinium thiocyanate contamination) were greater than or equal to 2.0.
One microgram of RNA was used for cDNA synthesis using the Superscript II (Invitrogen) reverse transcription reaction with random hexamers. qPCR analysis was performed on a CFX Connect Real-Time PCR system using SsoAdvanced Universal SYBR Green supermix (Bio-Rad, Switzerland).
Primers were designed using the Primer3 program, and sequences are listed in Supplemental Table 4. The amplification profile for qPCR was 95°C, 1 min, followed by 40 amplification cycles at 95°C, 10 s, and 60°C, 30 s. The run was completed with the dissociation curve from the start at 65°C to 95°C with 0.5 increments. Standard curves were done for each specific gene target including the reference gene, and their efficiencies were all between 90 and 100%. Data analysis was done with the Bio-Rad CFX manager software version 3.1. Expression of the target gene was calculated relative to the wild-type condition after normalization to the reference gene CDC73. Triple biological replicates and triple technical replicates were analyzed.
High-throughput sequencing
Genomic DNA from two independent backcrossed EMS-generated yeast mutants were prepared using the Qiagen Genomic DNA kit No. 19060, including Qiagen proteinase K No. 19131 and Qiagen Genomic-tip 20/G No. 10223. DNA-seq libraries were prepared for sequencing using the Illumina PE-102-1002-Paired-end sequencing kit according to the manufacturer specifications. In brief, 2 µg of DNA was sonicated using the Covaris S2. After purification on the Qiagen column, fragmented DNA was end repaired and an adenosine overhang added to the 3′ ends. Paired-end Illumina adapters were ligated to the DNA. The eluted products were enriched using 18 cycles of amplification with Illumina PCR primers. Libraries were validated on the Bioanalyzer 2100 (Agilent) and Qubit fluorimeter (Invitrogen). Samples were loaded (at 8 pM loaded) on one lane of the Genome Analyser IIx from Illumina according to the single read–80 cycles sequencing protocol.
Yeast TAP-Tag and fluorescent protein strain construction
The HFI1- and SPT7-TAP-Tagged constructs were amplified by PCR from a Tap-tag library (Ghaemmaghami et al., 2003) and then reintroduced into the RH2879 (wt) and RH6967 (erg3) strains. The primers used for SPT7-TAP-Tag cloning were SPT7-5′ (CCAGAAGAAGACTTGGAAAACGACG), 260 base pairs before the SPT7 stop codon, and SPT7-3′ (TGTGATACCGAATTAACCCATGGG), 234 base pairs after the stop codon, and for HFI1-TAP-Tag the primers were HFI1-5′ (GGTTGAACCTTCAGGTTCATACTATGC), 201 base pairs before the HFI1 stop, and HFI1-3′ (AGGAATCATGCGAGACCCC), 278 base pairs after the stop codon.
EGFP or mCherry tags were respectively integrated chromosomally at the C-terminus of the RVS167 and SPT7 genes to create the RVS167-EGFP::HIS3MX6 and SPT7-mCherry::kanMX4 strains. The fluorescent protein tags were amplified by PCR using the plasmids pFA6a-EGFP-His3MX6, pFA6a-mCherry-KanMX4 (gift from Marko Kaksonen, Department of Biochemistry, NCCR Chemical Biology, University of Geneva) as described (Janke et al., 2004). The primers used are listed in Supplemental Table 4. Wild-type and mutant cells expressing EGFP or mCherry-tagged proteins had growth properties indistinguishable from those of untagged cells. Wild type (SPT7-mCherry) was crossed with erg3 (RVS167-EGFP), and double fluorescent protein strains were generated by sporulation and tetrad dissection.
Live cell imaging
Yeast cells were grown to logarithmic phase (OD600 = 0.5–0.7) in SC-Trp medium at 30°C, and 1 ml was harvested by centrifugation at 4000 × g for 1 min. The pellet was resuspended in 100 µl SC-Trp. The cells were attached to concanavalin A–coated coverslips (Sigma ConA-C2010:1 mg/ml). Cells (10 µl) were incubated for 6 min at room temperature on the concanavalin A–coated coverslips, then washed with SC-Trp medium, and imaged in 40 µl of SC-Trp medium. The pictures were taken at room temperature using an Olympus IX81 wide-field microscope equipped with a 100 × NA 1.45 objective.
For EGFP and mCherry fluorescence, 17 z stacks with 0.5 µm intervals and exposure time of 500 ms were imaged sequentially at each frame using a Hamatsu Orca-ER charge-coupled device camera. The microscope setup was controlled by Metamorph 7.5 software (Molecular Devices, Sunnyvale, CA). For bright field, we took a single image at 150 ms exposure.
A deconvolution program, Auto Quant X3 (Media Cybernetics), was applied to the pictures, and the best focus images of ∼1400 cells were analysed. Objects were identified and quantified by CellProfiler software (Kamentsky et al., 2011) using the standard object identification module with Otsu’s method of image thresholding. The accuracy of the automated segmentation of the nucleus and cell was confirmed by manual inspection. As a background control, we measured EGFP channel of cells expressing only mCherry fluorescence and we subtracted this value from our experimental data (see Supplemental Figure 2).
SAGA complex purification
Cells expressing a TAP-tagged (RH 7750, RH 7751, RH 7752, RH 7753) or untagged (RH2879, RH6867) SAGA complex protein, Hfi1p or Spt7p, were grown in 500 ml YPUAD to OD600 = 1.5. The cells were collected by centrifugation (10 min at 6500 × g, 4°C) and washed with 20 ml cold water, and the pellets were frozen at –80°C. The SAGA complex was purified by a single-step TAP Tag purification as described previously (Lempiainen et al., 2009) with some modifications. Glass beads were used instead of zirconium/silica, and proteins were eluted with 0.5M NH4OH/0.5 mM EDTA, pH 10, to reduce the release of IgG. The eluate was neutralized and analyzed by an 8% SDS–PAGE gel and silver staining (ProteoSilver Plus Silver Satin Kit [Sigma PROT-SIL]) as well as by liquid chromatography-mass spectrometry/mass spectrometry (LC-MS/MS).
LC-MS/MS analysis
For LC-MS/MS analysis, dried samples were resuspended in 6 M urea in 50 mM NH4HCO3, reduced with 10 mM Tris (2-carboxyethyl) phosphine hydrochloride for 30 min, and alkylated with 25 mM iodoacetamide for 30 min in the dark. Samples were diluted to 2 M urea with 50 mM NH4HCO3 and digested with trypsin (Promega; 1 μl of 0.5 μg/μl) in the presence of 1 mM CaCl2 for 12 h at 37°C. Peptides were acidified to a final concentration of 5% acetic acid, desalted over a self-packed C18 spin column, and dried. Peptides were analyzed by LC-MS/MS, and the MS data were processed with MaxQuant.
Peptides were resuspended in water with 0.1% formic acid (FA) and analyzed using Proxeon EASY-nLC 1000 nano-UHPLC coupled to QExactive Plus Quadrupole-Orbitrap mass spectrometer (Thermo Scientific). The chromatography column consisted of a 15 cm easy-spray column with 75 μm i.d. microcapillary, packed with 3 μm PepMap C18 particles (Thermo Scientific). LC solvents were 0.1% FA in H2O (Buffer A) and 0.1% FA in MeCN (Buffer B). Peptides were eluted into the mass spectrometer at a flow rate of 300 nl/min over a 240 min linear gradient (3–35% Buffer B) at 50°C. Data were acquired in data-dependent mode (top-20, NCE 30, R = 17′500) after full MS scan (R = 70,000, m/z 400-1300). Dynamic exclusion was set to 10s, peptide match to prefer, and isotope exclusion was enabled.
The MS data were analyzed with MaxQuant1 (V1.5.0.0) (Cox and Mann, 2008) and searched against the yeast proteome (UniProt, 6559 entries) and a common list of contaminants (included in MaxQuant). The first peptide search tolerance was set at 20 ppm, 7 ppm was used for the main peptide search, and fragment mass tolerance was set to 0.02 Da. The false discovery rate for peptides, proteins, and sites identification was set to 1%. The minimum peptide length was set to six amino acids, and peptide requantification and label-free quantification (MaxLFQ) were enabled. The minimal number of peptides per protein was set to two. Oxidized methionines and N-terminal acetylation and phosphorylation on serine, threonine, and tyrosine were searched as variable modifications. Carbamidomethylation of cysteines was searched as a fixed modification. Only proteins present in at least two replicates and with at least fourfold higher intensity over background were considered.
ChIP and analysis
ChIP assays were performed as described previously (Huber et al., 2011) with the following modifications. IPs were performed with 60 µl rabbit (Sigma; I5006)-coupled magnetic Epoxy beads (Dynabeads M-270; Dynal Biotech, Invitrogen) and were quantified by qPCR using Sso Advance Universal SYBR Green Supermix on a CFX Connect Real-Time PCR machine (Bio-Rad, Switzerland). The IPs were normalized using the GAL7 gene locus, and primers used and listed in Supplemental Table 4 were kindly provided by David Shore (University of Geneva). ChIP-Seq libraries were constructed from 5 ng of immunoprecipitated DNA according to the manufacturer’s instructions (Illumina). Sequencing was done using 50 base pair single-end reads on the Illumina 2500 HiSeq system according to the manufacturer’s specifications.
The mapping of the sequencing data was performed with Bowtie 2.1.0 in end-to-end mode, using the mapping module of the HTSstation analysis platform (David et al., 2014). Results can be downloaded (http://htsstation.epfl.ch/mapseq/jobs/e9IBR9xqFdd7scDcgId5/get_results).
For each condition (wt, wt-HFI1-TAP, wt-SPT7-TAP, erg3, erg3-HFI1-TAP, erg3-SPT7-TAP), genome-wide normalized read densities were calculated for forward and reverse-strand reads separately by counting the coverage at each position after cutting every read to the first 45 bases. This was then normalized by 10−7 times the total number of reads.
The normalized ChIP signal level was quantified by calculating the average in each gene promoter region (1 kb upstream to 100 base pairs downstream of every gene start as defined in the Ensembl database version 75 (Flicek et al., 2014)) using custom scripts (http://bioscript.epfl.ch/). Quantified signals in promoter regions were normalized by the median signal among all promoter regions in a given condition in order to compare results between the different conditions.
From the final table of signals, sorted by decreasing values of the signal ratio erg3-SPT7-TAP/erg3, we identified a set of genes of interest presented in Table 2.
Statistics
All statistical data are represented using the SEM and were analyzed pairwise using the t test.
Supplementary Material
Acknowledgments
We thank Marko Kaksonen’s lab and Jérôme Bosset for help and advice with microscopy, the Genomics Platform of the University of Geneva for help with the ChIP-Seq sequencing and data analysis, David Shore for helpful advice, and Takeshi Harayama and Kyohei Umebayashi for comments on the manuscript. This work was supported by funding from the Swiss National Science Foundation (A.A., H.R.) and the National Center for Competence in Research Chemical Biology (A.A., H.R.).
Abbreviations used:
- ChIP
chromatin immunoprecipitation
- EMS
ethanemethanesulfonate
- 5-FOA
5-fluoroorotic acid
- IP
immunoprecipitation
- LC-MS/MS
liquid chromatography, mass spectrometry with fragmentation
- Seq
sequencing
- TAP
tandem affinity purification
- qPCR
quantitative PCR.
Footnotes
This article was published online ahead of print in MBoC in Press (http://www.molbiolcell.org/cgi/doi/10.1091/mbc.E17-03-0169) on August 2, 2017.
REFERENCES
- Abramova NE, Cohen BD, Sertil O, Kapoor R, Davies KJ, Lowry CV. Regulatory mechanisms controlling expression of the DAN/TIR mannoprotein genes during anaerobic remodeling of the cell wall in Saccharomyces cerevisiae. Genetics. 2001;157:1169–1177. doi: 10.1093/genetics/157.3.1169. [DOI] [PMC free article] [PubMed] [Google Scholar]
- Balguerie A, Sivadon P, Bonneu M, Aigle M. Rvs167p, the budding yeast homolog of amphiphysin, colocalizes with actin patches. J Cell Sci. 1999;112(Pt 15):2529–2537. doi: 10.1242/jcs.112.15.2529. [DOI] [PubMed] [Google Scholar]
- Bradley PH, Brauer MJ, Rabinowitz JD, Troyanskaya OG. Coordinated concentration changes of transcripts and metabolites in Saccharomyces cerevisiae. PLoS Comput Biol. 2009;5:e1000270. doi: 10.1371/journal.pcbi.1000270. [DOI] [PMC free article] [PubMed] [Google Scholar]
- Carvalho M, Schwudke D, Sampaio JL, Palm W, Riezman I, Dey G, Gupta GD, Mayor S, Riezman H, Shevchenko A, et al. Survival strategies of a sterol auxotroph. Development. 2010;137:3675–3685. doi: 10.1242/dev.044560. [DOI] [PMC free article] [PubMed] [Google Scholar]
- Cashikar AG, Duennwald M, Lindquist SL. A chaperone pathway in protein disaggregation. Hsp26 alters the nature of protein aggregates to facilitate reactivation by Hsp104. J Biol Chem. 2005;280:23869–23875. doi: 10.1074/jbc.M502854200. [DOI] [PMC free article] [PubMed] [Google Scholar]
- Chandy M, Gutierrez JL, Prochasson P, Workman JL. SWI/SNF displaces SAGA-acetylated nucleosomes. Eukaryot Cell. 2006;5:1738–1747. doi: 10.1128/EC.00165-06. [DOI] [PMC free article] [PubMed] [Google Scholar]
- Cox J, Mann M. MaxQuant enables high peptide identification rates, individualized p.p.b.-range mass accuracies and proteome-wide protein quantification. Nat Biotechnol. 2008;26:1367–1372. doi: 10.1038/nbt.1511. [DOI] [PubMed] [Google Scholar]
- Creusot F, Verdiere J, Gaisne M, Slonimski PP. CYP1 (HAP1) regulator of oxygen-dependent gene expression in yeast. I. Overall organization of the protein sequence displays several novel structural domains. J Mol Biol. 1988;204:263–276. doi: 10.1016/0022-2836(88)90574-8. [DOI] [PubMed] [Google Scholar]
- Dastidar RG, Hooda J, Shah A, Cao TM, Henke RM, Zhang L. The nuclear localization of SWI/SNF proteins is subjected to oxygen regulation. Cell Biosci. 2012;2:30. doi: 10.1186/2045-3701-2-30. [DOI] [PMC free article] [PubMed] [Google Scholar]
- David FP, Delafontaine J, Carat S, Ross FJ, Lefebvre G, Jarosz Y, Sinclair L, Noordermeer D, Rougemont J, Leleu M. HTSstation: a web application and open-access libraries for high-throughput sequencing data analysis. PLoS One. 2014;9:e85879. doi: 10.1371/journal.pone.0085879. [DOI] [PMC free article] [PubMed] [Google Scholar]
- de Saint-Jean M, Delfosse V, Douguet D, Chicanne G, Payrastre B, Bourguet W, Antonny B, Drin G. Osh4p exchanges sterols for phosphatidylinositol 4-phosphate between lipid bilayers. J Cell Biol. 2011;195:965–978. doi: 10.1083/jcb.201104062. [DOI] [PMC free article] [PubMed] [Google Scholar]
- Desfarges L, Durrens P, Juguelin H, Cassagne C, Bonneu M, Aigle M. Yeast mutants affected in viability upon starvation have a modified phospholipid composition. Yeast. 1993;9:267–277. doi: 10.1002/yea.320090306. [DOI] [PubMed] [Google Scholar]
- Durand A, Bonnet J, Fournier M, Chavant V, Schultz P. Mapping the deubiquitination module within the SAGA complex. Structure. 2014;22:1553–1559. doi: 10.1016/j.str.2014.07.017. [DOI] [PubMed] [Google Scholar]
- Elliott K, Sakamuro D, Basu A, Du W, Wunner W, Staller P, Gaubatz S, Zhang H, Prochownik E, Eilers M, Prendergast GC. Bin1 functionally interacts with Myc and inhibits cell proliferation via multiple mechanisms. Oncogene. 1999;18:3564–3573. doi: 10.1038/sj.onc.1202670. [DOI] [PubMed] [Google Scholar]
- Flicek P, Amode MR, Barrell D, Beal K, Billis K, Brent S, Carvalho-Silva D, Clapham P, Coates G, Fitzgerald S, et al. Ensembl 2014. Nucleic Acids Res. 2014;42:D749–D755. doi: 10.1093/nar/gkt1196. [DOI] [PMC free article] [PubMed] [Google Scholar]
- Galea AM, Brown AJ. Special relationship between sterols and oxygen: were sterols an adaptation to aerobic life? Free Radic Biol Med. 2009;47:880–889. doi: 10.1016/j.freeradbiomed.2009.06.027. [DOI] [PubMed] [Google Scholar]
- Gallego O, Betts MJ, Gvozdenovic-Jeremic J, Maeda K, Matetzki C, Aguilar-Gurrieri C, Beltran-Alvarez P, Bonn S, Fernandez-Tornero C, et al. A systematic screen for protein-lipid interactions in Saccharomyces cerevisiae. Mol Syst Biol. 2010;6:430. doi: 10.1038/msb.2010.87. [DOI] [PMC free article] [PubMed] [Google Scholar]
- Gallo-Ebert C, Donigan M, Liu HY, Pascual F, Manners M, Pandya D, Swanson R, Gallagher D, Chen W, Carman GM, Nickels JT., Jr The yeast anaerobic response element AR1b regulates aerobic antifungal drug-dependent sterol gene expression. J Biol Chem. 2013;288:35466–35477. doi: 10.1074/jbc.M113.526087. [DOI] [PMC free article] [PubMed] [Google Scholar]
- Gasch AP, Spellman PT, Kao CM, Carmel-Harel O, Eisen MB, Storz G, Botstein D, Brown PO. Genomic expression programs in the response of yeast cells to environmental changes. Mol Biol Cell. 2000;11:4241–4257. doi: 10.1091/mbc.11.12.4241. [DOI] [PMC free article] [PubMed] [Google Scholar]
- Ghaemmaghami S, Huh WK, Bower K, Howson RW, Belle A, Dephoure N, O’Shea EK, Weissman JS. Global analysis of protein expression in yeast. Nature. 2003;425:737–741. doi: 10.1038/nature02046. [DOI] [PubMed] [Google Scholar]
- Gietz RD, Woods RA. Transformation of yeast by lithium acetate/single-stranded carrier DNA/polyethylene glycol method. Methods Enzymol. 2002;350:87–96. doi: 10.1016/s0076-6879(02)50957-5. [DOI] [PubMed] [Google Scholar]
- Goldstein JL, Brown MS. The low-density lipoprotein pathway and its relation to atherosclerosis. Annu Rev Biochem. 1977;46:897–930. doi: 10.1146/annurev.bi.46.070177.004341. [DOI] [PubMed] [Google Scholar]
- Goldstein JL, Brown MS. The LDL receptor. Arterioscler Thromb Vasc Biol. 2009;29:431–438. doi: 10.1161/ATVBAHA.108.179564. [DOI] [PMC free article] [PubMed] [Google Scholar]
- Gu J, Emerman M, Sandmeyer S. Small heat shock protein suppression of Vpr-induced cytoskeletal defects in budding yeast. Mol Cell Biol. 1997;17:4033–4042. doi: 10.1128/mcb.17.7.4033. [DOI] [PMC free article] [PubMed] [Google Scholar]
- Guan XL, Souza CM, Pichler H, Dewhurst G, Schaad O, Kajiwara K, Wakabayashi H, Ivanova T, Castillon GA, Piccolis M, et al. Functional interactions between sphingolipids and sterols in biological membranes regulating cell physiology. Mol Biol Cell. 2009;20:2083–2095. doi: 10.1091/mbc.E08-11-1126. [DOI] [PMC free article] [PubMed] [Google Scholar]
- Gueldener U, Heinisch J, Koehler GJ, Voss D, Hegemann JH. A second set of loxP marker cassettes for Cre-mediated multiple gene knockouts in budding yeast. Nucleic Acids Res. 2002;30:e23. doi: 10.1093/nar/30.6.e23. [DOI] [PMC free article] [PubMed] [Google Scholar]
- Hannich JT, Umebayashi K, Riezman H. Distribution and functions of sterols and sphingolipids. Cold Spring Harb Perspect Biol. 2011;3 doi: 10.1101/cshperspect.a004762. doi: 10.1101/cshperspect.a004762. [DOI] [PMC free article] [PubMed] [Google Scholar]
- Haslbeck M, Braun N, Stromer T, Richter B, Model N, Weinkauf S, Buchner J. Hsp42 is the general small heat shock protein in the cytosol of Saccharomyces cerevisiae. EMBO J. 2004;23:638–649. doi: 10.1038/sj.emboj.7600080. [DOI] [PMC free article] [PubMed] [Google Scholar]
- Huber A, French SL, Tekotte H, Yerlikaya S, Stahl M, Perepelkina MP, Tyers M, Rougemont J, Beyer AL, Loewith R. Sch9 regulates ribosome biogenesis via Stb3, Dot6 and Tod6 and the histone deacetylase complex RPD3L. EMBO J. 2011;30:3052–3064. doi: 10.1038/emboj.2011.221. [DOI] [PMC free article] [PubMed] [Google Scholar]
- Hughes AL, Todd BL, Espenshade PJ. SREBP pathway responds to sterols and functions as an oxygen sensor in fission yeast. Cell. 2005;120:831–842. doi: 10.1016/j.cell.2005.01.012. [DOI] [PubMed] [Google Scholar]
- Janke C, Magiera MM, Rathfelder N, Taxis C, Reber S, Maekawa H, Moreno-Borchart A, Doenges G, Schwob E, Schiebel E, Knop M. A versatile toolbox for PCR-based tagging of yeast genes: new fluorescent proteins, more markers and promoter substitution cassettes. Yeast. 2004;21:947–962. doi: 10.1002/yea.1142. [DOI] [PubMed] [Google Scholar]
- Jiang B, Brown JL, Sheraton J, Fortin N, Bussey H. A new family of yeast genes implicated in ergosterol synthesis is related to the human oxysterol binding protein. Yeast. 1994;10:341–353. doi: 10.1002/yea.320100307. [DOI] [PubMed] [Google Scholar]
- Jira PE, Waterham HR, Wanders RJ, Smeitink JA, Sengers RC, Wevers RA. Smith-Lemli-Opitz syndrome and the DHCR7 gene. Ann Hum Genet. 2003;67:269–280. doi: 10.1046/j.1469-1809.2003.00034.x. [DOI] [PubMed] [Google Scholar]
- Kaksonen M, Toret CP, Drubin DG. A modular design for the clathrin- and actin-mediated endocytosis machinery. Cell. 2005;123:305–320. doi: 10.1016/j.cell.2005.09.024. [DOI] [PubMed] [Google Scholar]
- Kamentsky L, Jones TR, Fraser A, Bray MA, Logan DJ, Madden KL, Ljosa V, Rueden C, Eliceiri KW, Carpenter AE. Improved structure, function and compatibility for CellProfiler: modular high-throughput image analysis software. Bioinformatics. 2011;27:1179–1180. doi: 10.1093/bioinformatics/btr095. [DOI] [PMC free article] [PubMed] [Google Scholar]
- Kenneth NS, Mudie S, van Uden P, Rocha S. SWI/SNF regulates the cellular response to hypoxia. J Biol Chem. 2009;284:4123–4131. doi: 10.1074/jbc.M808491200. [DOI] [PubMed] [Google Scholar]
- Kippert F. A rapid permeabilization procedure for accurate quantitative determination of beta-galactosidase activity in yeast cells. FEMS Microbiol Lett. 1995;128:201–206. doi: 10.1111/j.1574-6968.1995.tb07523.x. [DOI] [PubMed] [Google Scholar]
- Kirli K, Karaca S, Dehne HJ, Samwer M, Pan KT, Lenz C, Urlaub H, Gorlich D. A deep proteomics perspective on CRM1-mediated nuclear export and nucleocytoplasmic partitioning. Elife. 2015;4 doi: 10.7554/eLife.11466. doi: 10.7554/eLife.11466. [DOI] [PMC free article] [PubMed] [Google Scholar]
- Kurzchalia TV, Ward S. Why do worms need cholesterol. Nat Cell Biol. 2003;5:684–688. doi: 10.1038/ncb0803-684. [DOI] [PubMed] [Google Scholar]
- Laurent BC, Treitel MA, Carlson M. Functional interdependence of the yeast SNF2, SNF5, and SNF6 proteins in transcriptional activation. Proc Natl Acad Sci USA. 1991;88:2687–2691. doi: 10.1073/pnas.88.7.2687. [DOI] [PMC free article] [PubMed] [Google Scholar]
- Lempiainen H, Uotila A, Urban J, Dohnal I, Ammerer G, Loewith R, Shore D. Sfp1 interaction with TORC1 and Mrs6 reveals feedback regulation on TOR signaling. Mol Cell. 2009;33:704–716. doi: 10.1016/j.molcel.2009.01.034. [DOI] [PubMed] [Google Scholar]
- Lewis TL, Keesler GA, Fenner GP, Parks LW. Pleiotropic mutations in Saccharomyces cerevisiae affecting sterol uptake and metabolism. Yeast. 1988;4:93–106. doi: 10.1002/yea.320040203. [DOI] [PubMed] [Google Scholar]
- Lombardi R, Riezman H. Rvs161p and Rvs167p, the two yeast amphiphysin homologs, function together in vivo. J Biol Chem. 2001;276:6016–6022. doi: 10.1074/jbc.M008735200. [DOI] [PubMed] [Google Scholar]
- Longtine MS, McKenzie DJ, 3rd, Demarini A, Shah NG, Wach A, Brachat A, Philippsen P, Pringle JR. Additional modules for versatile and economical PCR-based gene deletion and modification in Saccharomyces cerevisiae. Yeast. 1998;14:953–961. doi: 10.1002/(SICI)1097-0061(199807)14:10<953::AID-YEA293>3.0.CO;2-U. [DOI] [PubMed] [Google Scholar]
- Messenguy F. Regulation of arginine biosynthesis in Saccharomyces cerevisiae: isolation of a cis-dominant, constitutive mutant for ornithine carbamoyltransferase synthesis. J Bacteriol. 1976;128:49–55. doi: 10.1128/jb.128.1.49-55.1976. [DOI] [PMC free article] [PubMed] [Google Scholar]
- Munn AL, Heese-Peck A, Stevenson BJ, Pichler H, Riezman H. Specific sterols required for the internalization step of endocytosis in yeast. Mol Biol Cell. 1999;10:3943–3957. doi: 10.1091/mbc.10.11.3943. [DOI] [PMC free article] [PubMed] [Google Scholar]
- Munn AL, Stevenson BJ, Geli MI, Riezman H. end5, end6, and end7: mutations that cause actin delocalization and block the internalization step of endocytosis in Saccharomyces cerevisiae. Mol Biol Cell. 1995;6:1721–1742. doi: 10.1091/mbc.6.12.1721. [DOI] [PMC free article] [PubMed] [Google Scholar]
- Myers MD, Ryazantsev S, Hicke L, Payne GS. Calmodulin promotes N-BAR domain-mediated membrane constriction and endocytosis. Dev Cell. 2016;37:162–173. doi: 10.1016/j.devcel.2016.03.012. [DOI] [PMC free article] [PubMed] [Google Scholar]
- Peterson CL, Dingwall A, Scott MP. Five SWI/SNF gene products are components of a large multisubunit complex required for transcriptional enhancement. Proc Natl Acad Sci USA. 1994;91:2905–2908. doi: 10.1073/pnas.91.8.2905. [DOI] [PMC free article] [PubMed] [Google Scholar]
- Platt FM, Wassif C, Colaco A, Dardis A, Lloyd-Evans E, Bembi B, Porter FD. Disorders of cholesterol metabolism and their unanticipated convergent mechanisms of disease. Annu Rev Genomics Hum Genet. 2014;15:173–194. doi: 10.1146/annurev-genom-091212-153412. [DOI] [PMC free article] [PubMed] [Google Scholar]
- Pyrzynska B, Pilecka I, Miaczynska M. Endocytic proteins in the regulation of nuclear signaling, transcription and tumorigenesis. Mol Oncol. 2009;3:321–338. doi: 10.1016/j.molonc.2009.06.001. [DOI] [PMC free article] [PubMed] [Google Scholar]
- Raitt DC, Johnson AL, Erkine AM, Makino K, Morgan B, Gross DS, Johnston LH. The Skn7 response regulator of Saccharomyces cerevisiae interacts with Hsf1 in vivo and is required for the induction of heat shock genes by oxidative stress. Mol Biol Cell. 2000;11:2335–2347. doi: 10.1091/mbc.11.7.2335. [DOI] [PMC free article] [PubMed] [Google Scholar]
- Rawson RB. The SREBP pathway–insights from Insigs and insects. Nat Rev Mol Cell Biol. 2003;4:631–640. doi: 10.1038/nrm1174. [DOI] [PubMed] [Google Scholar]
- Schuller C, Mamnun YM, Wolfger H, Rockwell N, Thorner J, Kuchler K. Membrane-active compounds activate the transcription factors Pdr1 and Pdr3 connecting pleiotropic drug resistance and membrane lipid homeostasis in saccharomyces cerevisiae. Mol Biol Cell. 2007;18:4932–4944. doi: 10.1091/mbc.E07-06-0610. [DOI] [PMC free article] [PubMed] [Google Scholar]
- Sermwittayawong D, Tan S. SAGA binds TBP via its Spt8 subunit in competition with DNA: implications for TBP recruitment. EMBO J. 2006;25:3791–3800. doi: 10.1038/sj.emboj.7601265. [DOI] [PMC free article] [PubMed] [Google Scholar]
- Sivadon P, Peypouquet MF, Doignon F, Aigle M, Crouzet M. Cloning of the multicopy suppressor gene SUR7: evidence for a functional relationship between the yeast actin-binding protein Rvs167 and a putative membranous protein. Yeast. 1997;13:747–761. doi: 10.1002/(SICI)1097-0061(19970630)13:8<747::AID-YEA137>3.0.CO;2-L. [DOI] [PubMed] [Google Scholar]
- Stamenova SD, Dunn R, Adler AS, Hicke L. The Rsp5 ubiquitin ligase binds to and ubiquitinates members of the yeast CIN85-endophilin complex, Sla1-Rvs167. J Biol Chem. 2004;279:16017–16025. doi: 10.1074/jbc.M313479200. [DOI] [PubMed] [Google Scholar]
- Ter Linde JJ, Steensma HY. A microarray-assisted screen for potential Hap1 and Rox1 target genes in Saccharomyces cerevisiae. Yeast. 2002;19:825–840. doi: 10.1002/yea.879. [DOI] [PubMed] [Google Scholar]
- Tkach JM, Yimit A, Lee AY, Riffle M, Costanzo M, Jaschob D, Hendry JA, Ou J, Moffat J, Boone C, et al. Dissecting DNA damage response pathways by analysing protein localization and abundance changes during DNA replication stress. Nat Cell Biol. 2012;14:966–976. doi: 10.1038/ncb2549. [DOI] [PMC free article] [PubMed] [Google Scholar]
- Volkman JK. Sterols in microorganisms. Appl Microbiol Biotechnol. 2003;60:495–506. doi: 10.1007/s00253-002-1172-8. [DOI] [PubMed] [Google Scholar]
- Wach A, Brachat A, Pohlmann R, Philippsen P. New heterologous modules for classical or PCR-based gene disruptions in Saccharomyces cerevisiae. Yeast. 1994;10:1793–1808. doi: 10.1002/yea.320101310. [DOI] [PubMed] [Google Scholar]
- Wang R, Brattain MG. The maximal size of protein to diffuse through the nuclear pore is larger than 60 kDa. FEBS Lett. 2007;581:3164–3170. doi: 10.1016/j.febslet.2007.05.082. [DOI] [PMC free article] [PubMed] [Google Scholar]
- Wu PY, Winston F. Analysis of Spt7 function in the Saccharomyces cerevisiae SAGA coactivator complex. Mol Cell Biol. 2002;22:5367–5379. doi: 10.1128/MCB.22.15.5367-5379.2002. [DOI] [PMC free article] [PubMed] [Google Scholar]
- Yang H, Tong J, Lee CW, Ha S, Eom SH, Im YJ. Structural mechanism of ergosterol regulation by fungal sterol transcription factor Upc2. Nat Commun. 2015;6:6129. doi: 10.1038/ncomms7129. [DOI] [PubMed] [Google Scholar]
- Youn JY, Friesen H, Kishimoto T, Henne WM, Kurat CF, Ye W, Ceccarelli DF, Sicheri F, Kohlwein SD, McMahon HT, Andrews BJ. Dissecting BAR domain function in the yeast Amphiphysins Rvs161 and Rvs167 during endocytosis. Mol Biol Cell. 2010;21:3054–3069. doi: 10.1091/mbc.E10-03-0181. [DOI] [PMC free article] [PubMed] [Google Scholar]
Associated Data
This section collects any data citations, data availability statements, or supplementary materials included in this article.