

Asymmetrically dividing yeast cells segregate determinants of aging, and sphingolipids play a role in restricting the diffusion, and thus the mixing, of young and aged plasma membrane proteins.
Abstract
One proposed mechanism of cellular aging is the gradual loss of certain cellular components that are insufficiently renewed. In an earlier study, multidrug resistance transporters (MDRs) were postulated to be such aging determinants during the yeast replicative life span (RLS). Aged MDR proteins were asymmetrically retained by the aging mother cell and did not diffuse freely into the bud, whereas newly synthesized MDR proteins were thought to be deposited mostly in the bud before cytokinesis. In this study, we further demonstrate the proposed age asymmetry of MDR proteins in dividing yeast cells and investigate the mechanism that controls diffusive properties of MDR proteins to maintain this asymmetry. We found that long-chain sphingolipids, but not the septin/endoplasmic reticulum–based membrane diffusion barrier, are important for restricting MDR diffusion. Depletion of sphingolipids or shortening of their long acyl chains resulted in an increase in the lateral mobility of MDR proteins, causing aged MDR protein in the mother cell to enter the bud. We used a mathematical model to understand the effect of diminished MDR age asymmetry on yeast cell aging, the result of which was qualitatively consistent with the observed RLS shortening in sphingolipid mutants.
INTRODUCTION
Aging is a process associated with gradual decline in many physiological functions (Kirkwood, 2008). Although aging in multicellular organisms is complex and diverse (Kirkwood, 2005; Shmookler Reis, 2012), fundamental mechanisms on the cellular level appear to be conserved across organisms ranging from rodents, nematodes, and fruit flies to the single-celled yeast (Wasko and Kaeberlein, 2014). This is evidenced by the finding that common genetic and environmental interventions extend the life span of these organisms (Fontana et al., 2010; Longo et al., 2015). The budding yeast Saccharomyces cerevisiae has been established as a useful model system for studying the basic mechanism of cellular aging because of its highly stereotypic pattern of aging during proliferation and short generation time and the existence of a convenient tool kit for genetic, cell biological, and genomic manipulations. Each S. cerevisiae cell divides asymmetrically through budding and generates a finite number of daughter cells (buds; 20–30 for wild-type [WT] laboratory yeast growing under standard conditions) during its lifetime (Mortimer and Johnston, 1959). The number of buds generated in the lifetime of yeast is referred to as the replicative life span (RLS). Replicative aging in yeast has been attributed to progressive and asymmetric accumulation of the detrimental factors (Henderson and Gottschling, 2008), such as extrachromosomal ribosomal DNA circles (Sinclair and Guarente, 1997) and oxidatively damaged proteins (Aguilaniu et al., 2003; Erjavec et al., 2007), as well as the gradual decline of organellar activities, such as those of mitochondria (McFaline-Figueroa et al., 2011; Delaney et al., 2013) or vacuoles (Hughes and Gottschling, 2012). Recent studies in animal models and mammalian stem-like cells have begun to suggest that lessons learned in yeast may be particularly relevant to stem cell replicative aging (Liu and Rando, 2011; Schultz and Sinclair, 2016), which underlies the gradual deterioration of organisms’ capacity for loss of tissue repair and regeneration during organismal aging.
Our previous work revealed that the decline of certain plasma membrane (PM) functions during aging may be associated with the unusual dynamics of multidrug resistance (MDR) proteins during yeast cell division (Eldakak et al., 2010). MDRs are multipass transmembrane proteins that play essential function in nutrient uptake and removal of environmental toxins or harmful metabolites from the cell (Ernst et al., 2005). We found that a subset of MDR proteins localize asymmetrically in the mother cell before mitosis, but the proteins are deposited into the bud before cytokinesis (Eldakak et al., 2010). These MDRs have long half-lives and also lack diffusive mobility in the PM. These observations led us to propose that MDRs are recessive aging determinants that are segregated asymmetrically between bud and mother based on the age of the protein. Whereas the mother cell maintains its own original pool of MDRs, the bud cell receives the newly synthesized pool during the cell cycle in which it is born. The list of such asymmetrically deposited proteins was expanded in a later study that used a systematic approach to identify genes encoding long-lived and asymmetrically retained proteins in the yeast genome (Thayer et al., 2014).
In this study, we used the method of recombination-induced tag exchange (RITE) (Thayer et al., 2014) to directly observe protein age-dependent asymmetric MDR inheritance during mitosis. We then investigated the mechanism that controls the diffusive properties of MDR proteins to maintain this asymmetry. We show that long-chain sphingolipids, but not the septin/endoplasmic reticulum (ER)-based membrane diffusion barrier, are critical for the restricted MDR diffusion and maintenance of protein age asymmetry. Sphingolipid depletion or shortening of the acyl chains resulted in an increase in the lateral mobility, leading to a diminished mother–bud asymmetry of MDR proteins. We used a quantitative model to evaluate the concept of replicative age determination through asymmetric deposition of MDR proteins. Budding yeast with either reduced sphingolipid levels or sphingolipids of shorter fatty-acyl chains exhibited reduced RLS, consistent with model predictions.
RESULTS
Age asymmetry of Tpo1 protein is independent of the membrane diffusion barrier at the bud neck
To directly observe asymmetric segregation of MDR proteins according to protein age during mitosis, we used the polyamine transporter Tpo1 as the model protein, as in the previous study (Eldakak et al., 2010), and tagged it with the RITE cassette at the TPO1 genomic locus (Thayer et al., 2014). Here Tpo1 was tagged at the C-terminus with mCherry (mCh) followed by a stop codon. mCh and the stop codon were flanked by two loxP sites, with the more C-terminal one followed by green fluorescent protein (GFP; Figure 1a). In this manner, Tpo1 would be initially tagged with mCh, but after Cre-induced recombination between the two loxP sites, Tpo1 would be linked to GFP. The Cre recombinase was controlled by the estrogen receptor/estradiol system and was activated upon estradiol addition and shifting cells to 37°C for 60 min. Cre-induced cells express newly synthesized Tpo1 protein with GFP that can be distinguished from old Tpo1 protein with mCh. We used time-lapse movies to follow the cell cycle progression of unbudded G1 cells expressing Tpo1-mCh on the PM after induction of Cre-mediated recombination. During the early stage of the budding, the small bud was mostly devoid of Tpo1 with either tag (Figure 1b), consistent with our previous observation. In large, budded cells after the initiation of anaphase, as marked by elongation of mCh-Tub1 (Figure 1c), Tpo1-GFP was deposited on the bud PM during spindle elongation, while the mother cell PM retained Tpo1-mCh and gained a small amount of Tpo1-GFP.
FIGURE 1:

Age asymmetry of Tpo1 is independent of septin diffusion barrier at the bud neck. (a) Schematics showing the design of RITE approach to distinguish old and new proteins. (b) Montage of WT cells showing segregation of new (GFP-labeled) and old (mCh-labeled) Tpo1 protein. Scale bar: 5 μm. (c) Initiation of anaphase as marked by elongation of mCh-Tub1 coincides with Tpo1-GFP deposition in bud. (d) Distribution of new (GFP-labeled) and old (mCh-labeled) Tpo1 protein in Δerv14 mutant. Scale bar: 5 μm. (e) Localization and distribution of new (GFP-labeled) and old (mCh-labeled) Tpo1 protein in WT, cdc12-6, Δepo1, Δshs1, or Δscs2 mutant. Scale bar: 5 μm. (f) Average fluorescence recovery traces for Tpo1-GFP in WT (red, n = 14), cdc12-6 (magenta, n = 18) at the nonpermissive temperature, WT (black, n = 16), Δepo1 (green, n = 15), Δshs1 (blue, n = 14), and Δscs2 (cyan, n = 14) mutants, more than three independent biological replicates. Mean ± SEM is indicated.
The age asymmetry of Tpo1 was dependent on its PM localization. In Δerv14 mutant, Tpo1, like many long transmembrane domain PM proteins, was trapped in the cortical ER (Herzig et al., 2012). This was validated by total internal reflection microscopy (TIRF) imaging (Supplemental Figure S1, a–c), as well as in the mutant Δtether (Δist2 Δscs2/22 Δtcb1/2/3) (Manford et al., 2012), where the cortical ER is collapsed. In the latter mutant combined with Δerv14, Tpo1 “collapsed” with cortical ER. In the Δerv14 mutant, fluorescence recovery after photobleaching (FRAP) analysis showed that Tpo1 recovered much faster than WT cells (Supplemental Figure S1e), and the new (GFP-tagged) and old (mCh-tagged) Tpo1 were fully mixed between the bud and the mother (Figure 1d). It is known that septin assembly creates a diffusion barrier for PM proteins at the bud-neck region between mother and bud (Gladfelter et al., 2001; Caudron and Barral, 2009; Mostowy and Cossart, 2012; Ong et al., 2014). This barrier is accomplished by a triad of Scs2 (an ER integral membrane protein), Shs1 (a septin subunit), and Epo1 (an ER-associated protein) (Chao et al., 2014). To examine whether this barrier complex is responsible for the age asymmetry of Tpo1 in dividing cells, we tagged Tpo1 with the RITE cassette in cdc12-6, Δepo1, Δshs1, and Δscs2 mutants. As shown in Figure 1e, the age asymmetry of Tpo1 protein was not perturbed in cdc12-6 at the nonpermissive temperature or in any of the deletion mutants, suggesting that the segregation of new and aged proteins was not maintained by the septin/ER barrier at the bud neck. A lack of requirement for the membrane diffusion barrier at the bud neck for the observed Tpo1 age asymmetry can be explained by its poor diffusive ability in the PM, as shown by FRAP of Tpo1-GFP (Figure 1f). As expected, the lack of recovery of Tpo1-GFP near the bud neck was not altered by mutations disrupting the septin-ER diffusion barrier (Figure 1f).
Sphingolipids maintain Tpo1 asymmetry at the mother cortex
Lipids in biological membranes are known to play a crucial role in defining the structure, stability, and function of membrane proteins (Phillips et al., 2009; Dowhan and Bogdanov, 2011). Lipids have been shown to directly interact with membrane proteins such as MDRs (Koshy et al., 2013; Laganowsky et al., 2014; Hegedus et al., 2015; Martens et al., 2016). Because MDR proteins pass through the PM multiple times (Supplemental Table S1), we hypothesized that lipid–protein interactions could help restrict diffusion of the asymmetrically inherited proteins. To test this, we analyzed Tpo1 localization and diffusion in a Δcho1 mutant that was shown to exhibit an altered lipidome lacking phosphatidylserine and phosphatidylethanolamine with a significant increase in phosphatidylcholine and phosphatidylinositol (Fairn et al., 2011). As shown in Figure 2a, Tpo1 localizes asymmetrically to the mother cortex in small-budded Δcho1 cells, similar to WT cells. Further, no significant difference in Tpo1 mobility was observed at mother cortex between Δcho1 and WT cells (Figure 2, b and c).
FIGURE 2:

Sphingolipids help to maintain Tpo1 asymmetry by restricting its lateral diffusion in the PM. (a) Localization, (b) average fluorescence recovery traces, and (c) percent mobile fraction, of Tpo1-GFP in WT (n = 11) and Δcho1 (n = 12) cells (more than three independent biological replicates). Arrows point to the growing daughter in dividing yeast. Scale bar: 5 μm. Values indicate mean ± SEM. (d) Schematic of sphingolipid biosynthetic pathway in yeast showing steps of actions for the two specific inhibitors: myriocin and ABA. Myriocin inhibits condensation of serine and palmitoyl–coenzyme A, the first step of sphingolipid biosynthesis, whereas ABA inhibits synthesis of IPC in the sphingolipid pathway. (e) Localization of Tpo1-GFP under control, myriocin, and ABA treatment conditions. Cells were independently treated with 10 µM myriocin and 5 µg/ml ABA, whereas an equivalent amount of methanol was added to WT (control) at a cell density of (3–4) × 107/ml. Arrows point to the growing daughter in dividing yeast. Scale bar: 5 μm. (f) The box plot shows Tpo1 asymmetry from quantification of Tpo1-GFP intensity ratio between bud (1/3 size of mother) and mother (Ibud/Imother) in dividing yeast cells in control (black, n = 51), myriocin (magenta, n = 39), and ABA (blue, n = 31) treatment conditions. The box size indicates the SEM; the line inside each box indicates the median; and the whiskers mark the SD 90/10 percentile range. p values are reported with respect to WT control: *, p < 0.05; **, p < 0.001; ***, p < 0.0001. (g) Average fluorescence recovery traces in control (black, n = 22), myriocin (blue, n = 24), and ABA (green, n = 20) treatment conditions. (h) Histograms show percent mobile fractions for Tpo1-GFP in control and myriocin- and ABA-treated cells. Values indicate mean ± SEM. (i) Kymographs of Tpo1-GFP in controland myriocin- and ABA-treated conditions from FRAP experiment. Note Tpo1-GFP recovery from lateral areas to the center in myriocin- and ABA-treated conditions (see Supplemental Movies S1, S2, and S3). (j) Graph indicates percent mobile fractions for Tpo1-GFP at mother cortex in control (n = 15), 100 μM LatA (n = 16), myriocin (n = 12), and myriocin + 100 μM LatA (n = 11). Mean ± SEM is indicated. ***, p < 0.0001.
Upon analyzing the transmembrane sequence lengths of the asymmetrically maintained MDR proteins in budding yeast, we noticed that a majority of them contained multiple long transmembrane sequences of 24 amino acids or more (Supplemental Table S1). Interestingly, sphingolipids in yeast also carry an unusually long fatty-acyl chain of 26 carbons in length, as compared with other phospholipids that carry mostly 16- to 18-carbon fatty-acyl chains (Oh et al., 1997; Ejsing et al., 2009). Thus sphingolipids could provide a hydrophobic match to long transmembrane domains of MDR proteins and restrict their mobility at the PM. To test this, we inhibited sphingolipid biosynthesis using myriocin and aureobasidin A (ABA), two specific inhibitors for sphingolipid biosynthesis. Myriocin acts at the first step of sphingolipid biosynthesis (Wadsworth et al., 2013), whereas ABA (Endo et al., 1997) inhibits the conversion of ceramide into inositol phosphorylcholine (first sphingolipid) in budding yeast (Figure 2d). Exponentially growing yeast cells expressing Tpo1-GFP were independently treated with 10 μM myriocin or 5 μg/ml ABA for 2 h. As shown in Figure 2e, Tpo1-GFP localizes to the bud PM of small-budded cells under sphingolipid-depleted conditions. Quantification of Tpo1-GFP between bud and mother suggests that asymmetric distribution between mother and bud is compromised under sphingolipid-depletion conditions (Figure 2f).
FRAP data showed that fluorescence recovery speed and the mobile fraction of Tpo1-GFP were increased in sphingolipid-depleted cells (Figure 2, g and h, and Supplemental Movies S1, S2, and S3). Because sterols and sphingolipids are known to form ordered domains in the PM (Guan et al., 2009; Hannich et al., 2011), we monitored the mobility of Tpo1-GFP upon alteration of ergosterol levels in yeast PM using pharmacological inhibitors, including lovastatin and terbinafine, and mutants affecting the ergosterol biosynthetic pathway. We did not observe any significant alteration in the Tpo1-GFP mobility under ergosterol-altered conditions (Supplemental Figure S2). Fluorescence recovery of Tpo1-GFP under sphingolipid depletion could either be due to an increase in lateral diffusion or endocytic recycling. Kymographs generated from mother cell cortex show no change in Tpo1 fluorescence with time in the bleached region for control, whereas fluorescence recovered in the bleached region in myriocin- or ABA-treated cells over time (Figure 2i), with a concomitant loss of fluorescence from adjacent (nonbleached) regions, suggesting that Tpo1 recovered through lateral diffusion. Furthermore, to rule out a role for endocytic recycling, endocytosis was blocked by treatment with the actin polymerization inhibitor latrunculin A (LatA) (Ayscough et al., 1997) under sphingolipid depletion. LatA treatment did not prevent the enhanced Tpo1-GFP recovery under sphingolipid depletion (Figure 2j), excluding the contribution of endocytic recycling for Tpo1 recovery at the PM. These results suggest that sphingolipids are required for the restricted mobility of Tpo1 in the PM.
Sphingolipids restrict the mobility of asymmetrically inherited PM proteins in general
To determine the generality of sphingolipids in maintaining asymmetric inheritance of PM proteins, we monitored the localization and lateral diffusion of other asymmetrically inherited proteins under sphingolipid depletion. As shown in Figure 3a, Pma1-GFP, Mrh1-GFP, Hxt3-GFP, and Mid2-GFP exhibited asymmetric distribution in control conditions, whereas this asymmetry was compromised upon myriocin treatment. FRAP analysis showed that all the asymmetrically inherited proteins tested exhibited a significant increase in the mobile fractions under myriocin treatment as compared with control (Figure 3b). To examine the specificity of sphingolipids toward asymmetrically inherited proteins in PM, we analyzed the mobility of GFP-Sso1, a tSNARE protein, under sphingolipid depletion. Sso1 carries a single transmembrane domain that is 21 amino acid residues in length. In agreement with an earlier report (Valdez-Taubas and Pelham, 2003), Sso1 distributed symmetrically between bud and mother PM at all stages in both control and myriocin treatment conditions (Figure 3c). Even under the solvent control condition, GFP-Sso1 exhibited faster recovery than asymmetrically inherited proteins, and myriocin treatment did not result in any significant change in its mobility (Figure 3, d and e). These results further confirmed that sphingolipids specifically restrict the mobility of long transmembrane domain proteins and facilitate their age-dependent asymmetric partitioning between the bud and mother.
FIGURE 3:

Sphingolipids maintain stable association at the mother cortex for all asymmetrically inherited proteins by restricting their mobility. (a) Localization of Pma1-GFP, Mrh1-GFP, Hxt3-GFP, and Mid2-GFP proteins in control and myriocin-treated conditions in dividing cells. Scale bar: 5 μm. (b) Histogram indicates percent mobile fractions for Tpo1-GFP (n = 13), Pma1-GFP (n = 15), Mrh1-GFP (n = 11), Hxt3-GFP (n = 10), and Mid2-GFP (n = 14) in control (gray) and myriocin-treated (black) conditions. FRAP analysis included here were more than three independent biological replicates for each GFP-labeled protein. (c) Localization of GFP-Sso1 in control and myriocin-treated conditions. Scale bar: 5 μm. (d) Graph shows average fluorescence recovery traces of GFP-Sso1 in control (blue, n = 15) and myriocin treatment (black, n = 14) conditions from more than three biological replicates. Mean ± SEM is indicated. (e) Percent mobile fractions for GFP-Sso1 in control and myriocin-treated cells. Mean ± SEM is indicated. *, p < 0.05; **, p < 0.001; ***, p < 0.0001.
Sphingolipids’ role in restricting PM protein mobility is conserved in fission yeast
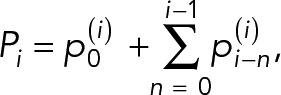
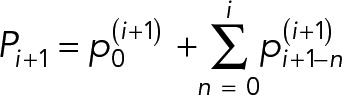
We next examined whether the role for sphingolipid in restricting the mobility of PM proteins is conserved in the evolutionarily distant fission yeast. Fission yeast divides symmetrically by forming a septum in the middle of the long axis. After cytokinesis, the resulting daughter cells grow linearly first at the old end (monopolar growth) and later at both ends (bipolar growth) (Mitchison and Nurse, 1985). The growing ends in fission yeast are thus equivalent to a growing bud, and the middle part of fission yeast is equivalent to the nongrowing mother in budding yeast. We tagged Mfs3, a Tpo1 homologue in fission yeast, with GFP at the C-terminus. Similar to Tpo1, Mfs3 is also predicted to have multiple long transmembrane sequences. In growing fission yeast cells, Mfs3 is localized to the PM in the middle section of the rod-shaped cells but absent at the growing ends in the control (Figure 4a). Myriocin treatment resulted in an even and homogeneous distribution of Mfs3-GFP along the cell cortex (Figure 4a). FRAP experiments showed that Mfs3 mobility in the PM was significantly increased with increasing concentration of myriocin treatment as compared with the control (Figure 4, b and c). These observations suggest that the physical role for sphingolipids in maintaining immobile pools of PM proteins is conserved between these two distantly related yeasts, despite the fact that fission yeast cells do not partition age asymmetrically during cell division under normal conditions (Coelho et al., 2013).
FIGURE 4:
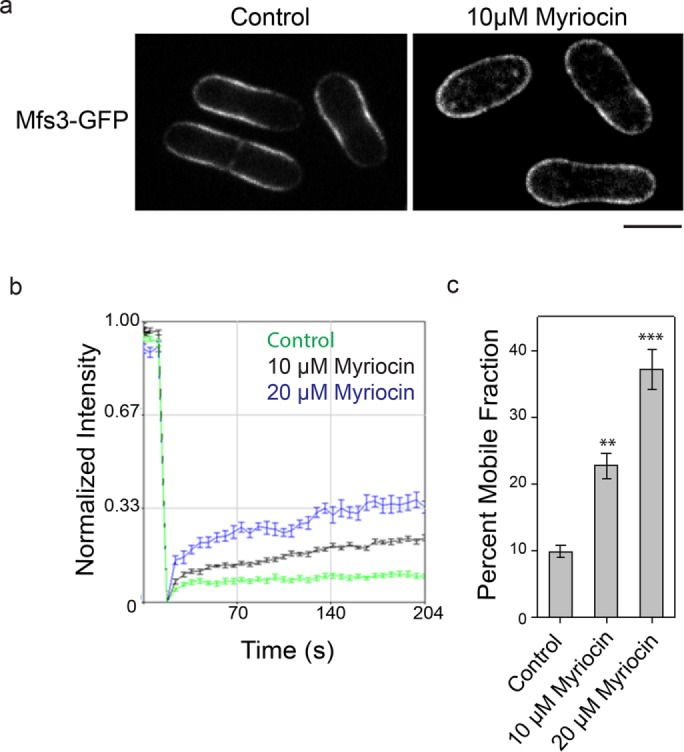
Sphingolipids restrict distribution and diffusion of Mfs3-GFP, a Tpo1 homologue, in fission yeast. (a) Localization of Mfs3-GFP in control and myriocin-treated fission yeast cells. Scale bar: 5 μm. (b) Average fluorescence recovery traces of Mfs3-GFP in control (green, n = 14) and 10 μM (black, n = 10) and 20 μM (blue, n = 11) myriocin-treated cells. Mean ± SEM is indicated. (c) Percent mobile fractions for Mfs3-GFP in control and 10 μM and 20 μM myriocin-treated cells. Mean ± SEM is indicated. **, p < 0.001; ***, p < 0.0001.
Long acyl chain of sphingolipids is required for maintaining the asymmetry of aged PM proteins
We next examined whether the long acyl chain of sphingolipids is required for the maintenance of age asymmetry of PM proteins by restricting their diffusion. Lag1 and Lac1p are two redundant ceramide synthases present in budding yeast, and an Δlag1Δlac1 double-deletion strain exhibits reduced synthesis of ceramide and downstream sphingolipids (Epstein et al., 2012). A yeast strain was engineered to produce sphingolipids carrying almost exclusively C18 fatty-acyl chains (C18SL). This was achieved by introducing the cotton LAG1 gene into the Δlag1Δlac1 strain background (Epstein et al., 2012). We tagged Tpo1 with RITE cassette in the C18SL strain and found that age asymmetry of Tpo1 between the bud and mother was compromised. As shown in Figure 5, a and b, a significant amount of aged Tpo1 protein leaked into the daughter in the C18SL strain, and Tpo1 exhibited higher mobility in the C18SL mutant than that in WT (Figure 5, c and d). Treatment of C18SL strain with 10 µM myriocin resulted in only a small but significant increase in Tpo1 mobility (Figure 5, c and d). These results support the notion that long fatty-acyl chains of sphingolipids are important for limiting the mobility of PM proteins by providing a hydrophobic match to their unusually long transmembrane domains.
FIGURE 5:

Sphingolipid chain shortening compromises Tpo1 asymmetry between mother and daughter at the cell cortex. (a) Localization of old (mCh-labeled) and new (GFP-labeled) Tpo1 protein in control, myriocin-treated, and C18SL mutant cells. Scale bar: 5 μm. (b) Graph shows the ratio of old Tpo1 (mCh) between bud and mother in all Cre-induced cells for control (n = 92), myriocin-treated (n = 97), and C18SL (n = 81) mutant. The box spans the first and third quartile; the line inside each box indicates the median; and the whiskers mark the SD 90/10 percentile range. p values are reported with respect to control: ***, p < 0.0001. (c) Average fluorescence recovery traces for Tpo1-GFP in control (green, n = 39), C18SL (blue, n = 32), and C18SL + myriocin-treated (black, n = 27) cells. Mean ± SEM is indicated. (d) Histogram shows percent mobile fractions for Tpo1-GFP in control, C18SL, and C18SL + myriocin-treated cells. Mean ± SEM is indicated. ***, p < 0.0001.
A quantitative model for MDR asymmetric inheritance under sphingolipid-altered conditions
To quantitatively assess and predict the role of MDR asymmetric partitioning in yeast replicative aging, we refined and expanded a model (Eldakak et al., 2010) to predict the dynamics of MDR protein population over RLS under normal or sphingolipid-altered conditions. The model assumes deposition of newly synthesized MDR protein at the cell’s birth. This pool of protein molecules follows a decay rate of α and is slightly replenished with newly synthesized protein (by the fractional amount p0) during each subsequent cell division. For determination of α, Tpo1 expression was induced briefly using the GAL1 promoter, which was then shut off by addition of glucose, and the turnover of Tpo1-GFP was monitored using single-cell imaging on a microfluidics device (Supplemental Figure S3a). Tpo1-GFP fluorescence decayed and plateaued after 15 h. The fluorescence decay as exponentially fitted led to an estimated decay rate of α = 0.13 h−1. p0 was estimated to be on average 0.20 by quantification of mother cell fluorescence increase as a fraction of fluorescence deposition in the daughter during mitosis. Our current model considers a small amount of aged protein diffusing from mother cell into the bud in WT (control) (∼5%) and sphingolipid-altered condition (∼15%) as an experimentally determined fraction of the existing protein at each cell division using the RITE cassette. Based on these parameter estimates, simulations showed a gradual decline in Tpo1 level as a function of the cell’s replicative age in WT (Supplemental Figure S3, b and c). This was confirmed by our experimental observation of changes in Tpo1-GFP level under the native promoter up to 16 generations using a microfluidics device (Supplemental Figure S3d). The enhanced diffusion of Tpo1 from the mother into the bud in sphingolipid mutants predicted a larger reduction in Tpo1 level during RLS (Figure 6a). The activity of Tpo1 and its related polyamine transporters was assessed by the uptake of spermidine at alkaline pH. As shown in Figure 6b, young cells exhibited higher spermidine uptake as compared with 14- to 16-generation-old cells. Young cells of WT, Δlag1Δlac1, and C18SL mutants did not exhibit significant differences in total spermidine uptake. However, a dramatic reduction in spermidine uptake was observed for 14- to 16-generation-old sphingolipid mutants (C18SL and Δlag1Δlac1) compared with WT cells of the same replicative age (Figure 6b). This result is consistent with the model prediction (Figure 6a) that, as replicative age advances, cells lose their polyamine transport function, which is further exacerbated with alteration in sphingolipid level or shortening of fatty-acyl chain lengths.
FIGURE 6:

Changes in Tpo1 level and function correlate with RLS under sphingolipid-altered conditions. (a) Tpo1 levels and activity were simulated over the cell’s RLS for WT and sphingolipid mutants based on experimentally determined parameters. Protein level in mother cells is depicted in WT (blue), Δlag1Δlac1 (green), and C18SL (red) cells. Plot for protein level is depicted by a solid line, while protein activity is represented as dotted lines for the same strains. (b) Graph shows spermidine uptake in young cells and 14- to 16-generation-old WT (blue), Δlag1Δlac1 (green), and C18SL (red) mutant cells. Old cells are represented by a solid line, whereas young cells are represented by dotted lines for the same strain. Experimental measurements were done on three biological replicates in duplicate. Mean ± SEM is indicated. (c) RLS measurement of WT (blue, n = 58), Δlag1Δlac1 (green, n = 59), and C18SL (red, n = 50) mutant strains. Graph shows the number of surviving cells after the indicated number of divisions. The median survival age for the tested strains is indicated in parentheses. *, p < 0.05; **, p < 0.001; ***, p < 0.0001.
To experimentally determine the impact of shortening of fatty-acyl chain length on RLS, we used the classic micromanipulation assay (Steffen et al., 2009) to measure the RLS for WT, Δlag1Δlac1, and C18SL strains. As shown in Figure 6c, WT exhibited a median RLS value of 25, in agreement with a previously reported RLS value for WT strain of S288C genetic background (Steffen et al., 2009), whereas C18SL exhibited a significant reduction in its RLS value (median = 21, by 12%; p = 0.025, Gehan-Breslow-Wilcoxon test; p = 0.0068 log-rank [Mantel-Cox] test). Δlag1Δlac1 also exhibited a marked reduction in its RLS (median = 17, by 32%) as compared with WT, but the median RLS of Δlag1 Δlac1 was statistically nonsignificant in comparison to C18SL (p = 0.25, Gehan-Breslow-Wilcoxon test; p = 0.1929 log-rank [Mantel-Cox] test). The maximum RLS values observed for WT, C18SL, and Δlag1 Δlac1 were 43, 34, and 32, respectively. Assuming a threshold level of polyamine based on the RLS of WT cells, the model predicts an ∼25% reduction of RLS in the C18SL mutant, which is larger than the observed 16% reduction in the mutant compared with WT. This is not surprising, however, as there are almost certainly additional mechanisms contributing to reduced cellular fitness during aging than the loss of MDR proteins.
DISCUSSION
Aging in mammals is associated with reduced capacity in tissue repair and an increase in degenerative diseases. Because stem cells maintain tissue homeostasis in multicellular organisms, stem cell loss with age directly contributes to organismal aging (Sharpless and DePinho, 2007). Many types of stem cells divide asymmetrically for both self-renewal and replacement of damaged and lost cells during aging (Inaba and Yamashita, 2012), but little is known about whether and how cellular age and replicative potential are segregated in stem cells. Like stem cells, S. cerevisiae divides asymmetrically and is shown to inherit aged MDRs to the aging mother cell. MDR transporter proteins belong to a highly conserved family of proteins that play important roles in the maintenance of cellular fitness. Interestingly, several MDR transporter proteins are well-known stem cell markers and are proposed to be important for maintaining the long-term proliferative potential of stem cells (Bunting, 2002). Therefore it will be interesting to investigate in future studies whether the pattern of MDR protein inheritance observed in yeast may be relevant in stem cells.
The main finding of our study is that sphingolipids maintain mother-specific retention of certain aged PM proteins by restricting their lateral diffusion. This function relies on the long fatty-acyl chain in yeast sphingolipids. Sphingolipid depletion or shortening of their acyl chains resulted in an increase in the protein lateral mobility, leading to loss of protein from the mother PM. Biological membranes are made up of a large variety of lipid species differing in the shape and length of their hydrophobic moieties and their head groups. Interestingly, the long fatty-acyl chains of the yeast sphingolipids are matched with the abnormally long transmembrane domains of the asymmetrically inherited proteins. Our observation that sphingolipid depletion and/or shortening of sphingolipid acyl chains increased the mobility of PM proteins supports a role for hydrophobic matching in restricting the diffusion of the MDR proteins. These findings are consistent with studies in which thicker membranes composed of lipids with longer hydrophobic-chain lengths were found to reduce the lateral diffusion of the transmembrane peptides and integral proteins in the plane of the membrane bilayer in giant unilamellar vesicles (Ramadurai et al., 2010a,b).
A previous study reported that sphingolipids and ceramides participate in the formation of a lateral diffusion barrier in ER at the yeast bud neck, where it helps confine misfolded proteins of the ER to the mother cell (Clay et al., 2014). Our experiments showed that this ER diffusion barrier does not restrict the lateral mobility of MDRs. First, in an Δerv14 mutant where Tpo1 was trapped in the cortical ER, Tpo1 diffused rapidly and distributed evenly between the mother and the bud. Second, mutations that disrupt the septin-ER barrier at the bud neck had no effect on Tpo1 mobility or asymmetric retention. Therefore the mechanism of function of sphingolipids characterized in our study is likely to be quite different from its proposed function as diffusion barrier in ER at the yeast bud neck.
Our previous study provided functional evidence that MDR proteins are positive regulators of RLS in budding yeast, as deletion of these proteins reduces RLS, whereas an increased TPO1 copy number extended RLS (Eldakak et al., 2010). The present study provides evidence that alterations in the sphingolipid level/structure result in loss of Tpo1 protein from the mother at each cell division leading to a progressive decline in the total protein level in mother. The protein loss due to turnover, albeit slow, and damage to those long-lived proteins over time could explain the observed decline in spermidine uptake in aged cells. This is further exacerbated in aged sphingolipid mutants, possibly due to leakage into the bud as a result of less-restricted mobility. It is known that polyamine levels are positively correlated to the long life span in yeast, Drosophila, and humans (Eisenberg et al., 2009; Minois, 2014). This is consistent with our observation that sphingolipid mutants with greater loss of polyamine importing activity during aging exhibit shorter RLS. Recently, Yang and colleagues reported a small but progressive increase in the expression of certain mother-enriched proteins with advancement in replicative age and proposed that their accumulation is likely to limit the life span of cell (Yang et al., 2015). However, we did not observe an increase in the Tpo1 level, but rather the Tpo1 level exhibited a decline by ∼30% at ∼16 generations according to single-cell time-lapse imaging. This finding is also consistent with the earlier findings that deletion of Tpo1 results in shortened yeast RLS, whereas expression of an extra copy of TPO1 significantly lengthens yeast replicative life span (Eldakak et al., 2010). It is possible that a slight increase in certain MDR proteins during aging reflects a stress response to compensate for the age-related decline of certain long-lived proteins such as Tpo1, and this may explain the observed reduction in RLS that is less extensive than the model-predicted reduction based purely on changes in Tpo1 level.
Sphingolipids are important structural constituents of PMs in eukaryotes. Sphingolipid levels have been suggested as markers and biological modulators of healthy aging in humans, proposed to provide better antioxidant capacity and a well-developed membrane-lipid remodeling process (Collino et al., 2013; Montoliu et al., 2014). A Drosophila mutant that exhibits >70% reduction in sphingolipid content displays an increased PM fluidity and enhanced oxidative damage to cellular proteins due to increased susceptibility to reactive oxygen species. This in turn results in shorter life span in Drosophila (Rao et al., 2007). Interestingly, a significant reduction in glucosylceramide sphingolipid was also observed in aged CD4+ T-cells. Further, it was shown that reductions in glucosylceramide abundance using pharmacological inhibitors resulted in age-related impairments in CD4+ T-cell function (Molano et al., 2012). These findings indicate that sphingolipids are likely to have aging-related functions in a many different organisms.
In yeast, down-regulation of sphingolipids using pharmacological and genetic approaches by inhibiting serine palmitoyl transferase activity, the first enzyme in sphingolipid biosynthesis, extends chronological life span (CLS) in budding yeast (Huang et al., 2012; Liu et al., 2013). CLS is determined by postmitotic aging in budding yeast, in which cells stay in the stationary phase without undergoing cell division. In CLS, the cell displays metabolic changes that are quite distinct from RLS. For example, sphingolipid level increases in budding yeast in stationary-phase culture, which does not happen in normal cycling cells (Lester et al., 2013). In addition, during replicative aging, yeast is subject to a variety of morphological and physiological changes that result in the intrinsic age-related decline in function, also called functional senescence (Jazwinski, 2002), which cannot be extended to stationary-phase cells during CLS. Because the biological aging process is the product of functional senescence, RLS may be a better model of stem cell aging than CLS.
Fission yeast (Schizosaccharomyces pombe) and budding yeast diverged from each other ∼420–330 million years ago (Sipiczki, 2000). Although both are unicellular eukaryotes of the same phylum and exhibit extensive homology in their genome and proteome, they differ considerably in various cellular processes. For example, fission yeast divides symmetrically with no apparent age asymmetry between the progeny cells (Coelho et al., 2013), whereas in budding yeast, the daughter cell is born as bud through asymmetric cell division. Consistently, the aged protein of Mfs3, the fission yeast homologue of Tpo1, is reserved to the midpart of the rod-shaped cells and is absent from the PM of the two growing ends. S. cerevisiae has three classes of sphingolipids: inositol phosphorylceramide (IPC), mannosylinositol phosphorylceramide (MIPC), and mannosyldiinositol phosphorylceramide, whereas analysis of sphingolipid composition demonstrated that MIPC is the terminal and most abundant complex sphingolipid in S. pombe (Nakase et al., 2010). In addition, it is believed that sphingolipids in fission yeast also carry longer fatty-acyl chains than phospholipids (Nakase et al., 2010). Myriocin treatment results in an even distribution of Mfs3 throughout the PM and a concomitant increase in MDR diffusion in fission yeast. These results suggest that the role for sphingolipids in maintaining immobile pools of PM proteins to meet a specific pattern of inheritance is conserved between these two distantly related yeasts.
MATERIALS AND METHODS
Yeast strains and genetic methods
All budding yeast strains were derivatives of the S288C background and are listed in Supplemental Table S2. Gene deletion and fluorescent protein tagging were performed with PCR-mediated homologous recombination, and correct integrations were confirmed by PCR. Budding yeast cell culture and genetic manipulations were performed by using standard methods as previously described (Gardner and Jaspersen, 2014). WT haploid fission yeast (S. pombe) strains are derived in the 972 h- background using standard gene manipulation methods (Forsburg and Rhind, 2006). Fission yeast strains were grown at 30°C in YES medium (5 g/l yeast extract plus 30 g/l glucose and supplements, 225 mg/l each of uracil, adenine, leucine, histidine, and lysine) unless otherwise indicated (Forsburg and Rhind, 2006).
Inhibitor treatments
Myriocin, lovastatin, terbinafine, and LatA were purchased from Sigma. ABA was purchased from Clontech.
Fluorescence microscopy and image quantification
Overnight grown cultures expressing Tpo1-GFP in synthetic medium were harvested, and A600 was adjusted to 0.3. Cultures were grown for 2 h at 30°C. Live-cell imaging was performed at 23°C using a Yokagawa (Tokyo, Japan) CSU-10 spinning disk on the side port of a Carl Zeiss (Jena, Germany) 200 m inverted microscope, a Perkin Elmer-Cetus (Waltham, MA) Ultraview VoX system equipped with Zeiss Definite Focus, or a Carl Zeiss LSM-780. 488/561-nm excitation was used to excite GFP/RFPs, and emission was collected through the appropriate filters onto a Hamamatsu C9100-13 EMCCD on the spinning-disk systems or the photomultiplier tube on the Confocor 3. All GFP images were acquired through a 500- to 550-nm filter. RFP images were acquired with a 580-nm long-pass filter on the Confocor 3 at LSM780 and CSU-10, and a 420–475/502–544/582–618/663–691 multiband filter on the Ultraview. All images were acquired in a multitrack, alternating-excitation configuration so as to avoid GFP bleedthrough. The CSU-10 and Ultraview systems used a 100×/1.45 NA Plan-Apochromat objective, while the Confocor 3 used a 63×/1.2 NA Plan-Apochromatic oil-immersion objective with a pinhole of 1 airy unit. For FRAP experiments, only budded cells were chosen, and a small region of the mother cell cortex was bleached. FRAP data were acquired on spinning-disk confocal microscope (UltraVIEW) using a PhotoKinesis accessory (Perkin Elmer-Cetus) integrated with Volocity acquisition software with a 100×/1.46 NA objective, whereas the Zen acquisition software was used to carry out bleaching and acquisition with a 63×/1.46 NA objective on an LSM780 (Karl Zeiss). Cells were imaged at the rate of 10 frames/min for a total of 42 frames with 488-nm and exposure at 300 ms. Tpo1-GFP at the mother cortex was bleached after frame 5. Fluorescence recovery was monitored over the indicated time range. Fluorescence intensity was analyzed using ImageJ software (National Institutes of Health [NIH]), and fluorescence intensity was plotted against time after normalizing it to prebleach intensity.
Kymograph generation
Kymographs were generated by averaging a thickness of 6 pixels along the cell perimeter (cortex) using a custom plug-in in ImageJ. All the plug-ins can be found at the Stowers Institute ImageJ Plugins website (http://research.stowers.org/imagejplugins/laser_switching_protocol.html).
Isolation of cells with advanced replicative age
Cells with advanced replicative age were obtained by magnetic sorting, as described previously (Lindstrom and Gottschling, 2009). Exponentially growing cells were collected and washed twice with ice-cold phosphate-buffered saline (PBS), pH 8.0. About 4 × 10⁷ cells were labeled with 0.3 mg/ml Sulfo-NHS-LC Biotin (Pierce) at room temperature for 30 min with gentle shaking. These cells were used as mother (M-cells). The cells were then washed three times with 1 ml cold PBS to get rid of free biotin and grown in a 1-l flask containing 200 ml media for ∼16 h (∼7–10 generations). The separation of M-cells was carried out by incubating cells with 20 μl anti-biotin microbeads (MACS) in 30 ml PBS (pH 7.2) containing 0.5% bovine serum albumin for 1 h. Unbounded beads were removed by three washes with PBS. M-cells were isolated with a magnetic sorter, and regrown in a 1-l flask containing 200 ml fresh media for another 24 h (∼16–18 generations). Successful acquisition of cells with advanced replicative age was verified by staining of buds scars with calcofluor.
Quantification of leakage of aged Tpo1 from mother to bud
Cells were grown overnight in SC-Leu + 200 μg/ml Clonat and then diluted into fresh SC-Leu and shifted to 37°C to grow for 1 h in the presence of 1 μM 17β-estradiol to induce recombination of the RITE tag. Subsequently cells were shifted back to 23°C and checked for GFP expression regularly. Cells generally start expressing Tpo1-GFP ∼90 min after the shift to 23°C. Thirteen z-stack (0.5-μm steps) images in GFP, RFP channels were taken. A minimum of 80 original mother cells (with Tpo1-mCh in the PM) were quantified in all experiments.
Determination of RLS
Life span analyses were carried out by using micromanipulation as described previously (Steffen et al., 2009). Yeast extract–peptone–dextrose agar plates containing (2% [wt/vol] glucose and 2% [wt/vol] agar) were prepared in sterile water (Sigma). Plates were incubated at 30°C during micromanipulation assay and sealed with parafilm every time after microdissection. Plates were shifted to 4°C for overnight incubation. The numbers of cells tracked were 58, 50, and 59, for WT, C18SL, and Δlag1Δlac1, respectively. For statistical significance, RLS data sets were analyzed by using the Gehan-Breslow-Wilcoxon test and log-rank (Mantel-Cox) test. For all strains tested, mean RLS and p values were calculated from pooled experiments in which each strain of interest was compared with its respective WT strain, which was examined in the same experiment.
Spermidine uptake assay
Polyamine import assays for both young and old populations were performed as described previously (Tomitori et al., 2001). Briefly, young and yeast cells with advanced replicative age harvested from the same culture were washed twice with 5 ml of 20 mM Na-HEPES buffer (pH 7.5) containing 2% glucose and suspended in the same buffer at OD 2/ml, and incubated at 25°C with gentle shaking. The uptake was initiated by the addition of [3H]spermidine (37 MBq/mmol) to a final concentration of 10 μM, and 0.2-ml aliquots were filtered through nylon filters (pore size: 0.45 mm) at 0-, 15-, 30-, 45-, and 60-min intervals. The radioactivity trapped on the filters was counted in a liquid scintillation counter.
Microfluidic experiments and time-lapse microscopy
Microfluidic devices were fabricated by adopting a design described in Jo et al. (2015). An array of microfeatures for single-cell trapping with a height of 5 µm was fabricated on a silicon wafer using standard lithographic techniques (Xia and Whitesides, 1998). A mixture of a polydimethylsiloxane (PDMS) pre-polymer and a curing agent in a 10:1 ratio (Sylard 184; Dow Corning) was cast against the mold and incubated at 70°C overnight. The cured PDMS slab containing the transferred microstructures was peeled off the mold, and an inlet and an outlet were drilled using a 1-mm-diameter biopsy punch. The PDMS slab was bonded with a clean coverglass by plasma exposure. The device was incubated for additional 15 min at 70°C to strengthen the bonding between the glass and the PDMS. Two separate microtubings were inserted into the inlet and outlet holes and sealed completely with an epoxy glue. Yeast cells suspended at ∼106–107 cells/ml concentration were slowly loaded onto the device through the inlet until single cells were captured in features at the desired occupancy. Subsequently, fresh synthetic defined media was applied at the constant flow rate by a syringe pump (Fusion 200; Chemyx). An initial flow rate (50 μl/min) was applied to remove bubbles and wash out nontrapped cells. Thereafter, it was reduced to 5 μl/min to keep trapped mother cells under a positive pressure and to wash out daughter cells consistently. During the incubation, the temperature remained constant at 25°C, and time-lapse images at multiple positions were acquired by an epifluorescence microscope equipped with an objective lens Plan Fluar 40×/1.3 differential interference contrast MN2 with 1.5 digital zoom (Nikon Ti-E; Nikon, Tokyo, Japan). Bright-field and fluorescence images of cells expressing Tpo1-GFP under endogenous promoter were recorded for 50 h at 30-min intervals. For determination of Tpo1 decay rate, Tpo1-GFP expression was induced for 4 h under GAL1 promoter as described previously (Eldakak et al., 2010); this was followed by glucose shutoff and time-lapse imaging for 24 h at 30-min intervals. The time-lapse images on microfluidics allowed us to trace the Tpo1-GFP level in single cells along the RLS. Total Tpo1-GFP intensity in the whole cell was analyzed by ImageJ (NIH).
Modeling of Tpo1 level and function in the mother cell over its RLS
The current model is an extension of the previously published model (Eldakak et al., 2010). For modeling total Tpo1 protein level and its function in mother cells during RLS progression, the following assumptions were made:
We considered a progressive increase in the cell doubling time with advancement in replicative age, which is mostly attributed to an increase in the G1 phase (Lee et al., 2012).
Our mathematical model takes a new bud as the starting node. In this model, we account for the loss of protein from the mother cell at each cell division in WT and sphingolipid mutants. This value, expressed as a ratio, x, of existing protein was estimated to be ∼5% and ∼15% for WT and sphingolipid mutants, respectively, based on the experimental observations.
Equations for modeling.
We consider that the cell cycle time, ti, for the ith generation-old cell follows a quadratic function with progress in RLS. In this model, total protein at the end of the ith cell cycle, Pi, is the sum of the partial protein amounts  , n = 0, 1, ..., i which are, respectively, (i − n) generations old and are given by the following equation:
 |
where  is the new protein that diffuses from bud to mother as replenishment. We assumed protein diffusion rate from mother to bud, x, and protein decay rate, α, to be constant over generations. For example, the ith generations-old mother cell becomes an (i + 1)th generations-old mother after giving birth to a daughter, and the protein distribution in the cell changes to
 |
where  .
.
Parameter estimation.
We estimated protein decay rate, α = 0.1325 ± 0.0277 h−1 by fitting a single exponential curve to the single-cell Tpo1-GFP decay profile in the curve-fitting toolbox of Matlab 2016b (MathWorks, Natick, MA). A similar quadratic model for the cell cycle period was used, as described previously (Eldakak et al., 2010):
where we used experimentally determined cell cycle periods for newborn WT and the mutant cells: B0 = 1.7, 1.9, and 2.1 h for WT, C18SL mutant, and Δlag1Δlac1 mutants, respectively, and B1 = 0 was used for all cell types. The B2 values of 0.0017 h for WT and 0.0083 h for both mutants were taken to account for the increase in the cell doubling time in mutants.
To account for the heterogeneity in the population, we grouped the experimental observations into three classes g ∈ {1,2,3} depending on the replenishment rate, and estimated the rate (p0,g) for each of these groups based on experimental data. We assumed that the three classes exist in the population according to the ratio βg with 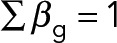 . In this case, the total Tpo1 level of the population, PT,i is given as the sum
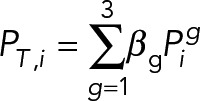 |
where  , is the Tpo1 level of the g subclass, given by Eq. 1 with the appropriate p0,g
The normalized activity of Tpo1 in the population, AT,i is given by,
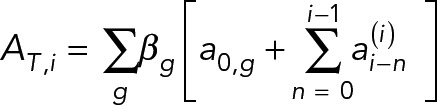 |
where 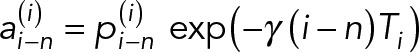 , and a0,g = p0,g and γ is the activity decay constant obtained numerically as follows:
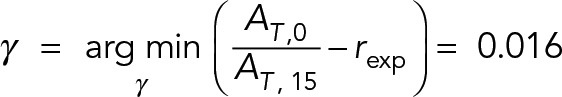 |
where is the experimental uptake ratio for WT cells. This minimization was performed numerically by calculating the function for a range of values of γ. The activity decay constant is assumed to be the same for both mutants. Note that our protein activity decay model assumes age-dependent activity loss for proteins.
Supplementary Material
Acknowledgments
We thank Brian Slaughter, Jay Unruh, and Sarah Smith (Stowers Institute for Medical Research) for technical help and suggestions in microscopy experiments; Howard Riezman (University of Geneva) for providing sphingolipid mutant strains; Scott Emr (Weill Institute for Cell and Molecular Biology) for providing the Δtether yeast mutant; and Michael Knops (University of Heidelberg) and Daniel Gottschling (Fred Hutchinson Cancer Research Center) for plasmids. We thank Lidong Qin (Houston Methodist Research Institute) for providing AutoCAD files for the design yeast microfluidics chip and the Konstantinos Konstantopoulos lab (Johns Hopkins University) for help with microfluidics technology. This work was supported by grant R35 GM118172 from the NIH to R.L. This work was supported by the Howard Hughes Medical Institute (B.C.K. and T. H.) and the National Science Foundation Physics Frontier Center (grant PHY 1430124 to T.H.).
Abbreviations used:
- ABA
aureobasidin A
- C18SL
C18 fatty-acyl chain
- CLS
chronological life span
- ER
endoplasmic reticulum
- FRAP
fluorescence recovery after photobleaching
- GFP
green fluorescent protein
- IPC
inositol phosphorylceramide
- LatA
latrunculin A
- MDR
multidrug resistance
- MIPC
mannosylinositol phosphorylceramide
- PBS
phosphate-buffered saline
- PDMS
polydimethylsiloxane
- PM
plasma membrane
- RITE
recombination-induced tag exchange
- RLS
replicative life span
- TIRF
total internal reflection microscopy
- WT
wild type.
Footnotes
This article was published online ahead of print in MBoC in Press (http://www.molbiolcell.org/cgi/doi/10.1091/mbc.E17-05-0335) on August 2, 2017.
REFERENCES
- Aguilaniu H, Gustafsson L, Rigoulet M, Nystrom T. Asymmetric inheritance of oxidatively damaged proteins during cytokinesis. Science. 2003;299:1751–1753. doi: 10.1126/science.1080418. [DOI] [PubMed] [Google Scholar]
- Ayscough KR, Stryker J, Pokala N, Sanders M, Crews P, Drubin DG. High rates of actin filament turnover in budding yeast and roles for actin in establishment and maintenance of cell polarity revealed using the actin inhibitor latrunculin-A. J Cell Biol. 1997;137:399–416. doi: 10.1083/jcb.137.2.399. [DOI] [PMC free article] [PubMed] [Google Scholar]
- Bunting KD. ABC transporters as phenotypic markers and functional regulators of stem cells. Stem Cells. 2002;20:11–20. doi: 10.1002/stem.200011. [DOI] [PubMed] [Google Scholar]
- Caudron F, Barral Y. Septins and the lateral compartmentalization of eukaryotic membranes. Dev Cell. 2009;16:493–506. doi: 10.1016/j.devcel.2009.04.003. [DOI] [PubMed] [Google Scholar]
- Chao JT, Wong AK, Tavassoli S, Young BP, Chruscicki A, Fang NN, Howe LJ, Mayor T, Foster LJ, Loewen CJ. Polarization of the endoplasmic reticulum by ER-septin tethering. Cell. 2014;158:620–632. doi: 10.1016/j.cell.2014.06.033. [DOI] [PubMed] [Google Scholar]
- Clay L, Caudron F, Denoth-Lippuner A, Boettcher B, Buvelot Frei S, Snapp EL, Barral Y. A sphingolipid-dependent diffusion barrier confines ER stress to the yeast mother cell. Elife. 2014;3:e01883. doi: 10.7554/eLife.01883. [DOI] [PMC free article] [PubMed] [Google Scholar]
- Coelho M, Dereli A, Haese A, Kuhn S, Malinovska L, DeSantis ME, Shorter J, Alberti S, Gross T, Tolic-Norrelykke IM. Fission yeast does not age under favorable conditions, but does so after stress. Curr Biol. 2013;23:1844–1852. doi: 10.1016/j.cub.2013.07.084. [DOI] [PMC free article] [PubMed] [Google Scholar]
- Collino S, Montoliu I, Martin FP, Scherer M, Mari D, Salvioli S, Bucci L, Ostan R, Monti D, Biagi E, et al. Metabolic signatures of extreme longevity in northern Italian centenarians reveal a complex remodeling of lipids, amino acids, and gut microbiota metabolism. PLoS One. 2013;8:e56564. doi: 10.1371/journal.pone.0056564. [DOI] [PMC free article] [PubMed] [Google Scholar]
- Delaney JR, Murakami C, Chou A, Carr D, Schleit J, Sutphin GL, An EH, Castanza AS, Fletcher M, Goswami S, et al. Dietary restriction and mitochondrial function link replicative and chronological aging in Saccharomyces cerevisiae. Exp Gerontol. 2013;48:1006–1013. doi: 10.1016/j.exger.2012.12.001. [DOI] [PMC free article] [PubMed] [Google Scholar]
- Dowhan W, Bogdanov M. Lipid-protein interactions as determinants of membrane protein structure and function. Biochem Soc Trans. 2011;39:767–774. doi: 10.1042/BST0390767. [DOI] [PMC free article] [PubMed] [Google Scholar]
- Eisenberg T, Knauer H, Schauer A, Buttner S, Ruckenstuhl C, Carmona-Gutierrez D, Ring J, Schroeder S, Magnes C, Antonacci L, et al. Induction of autophagy by spermidine promotes longevity. Nat Cell Biol. 2009;11:1305–1314. doi: 10.1038/ncb1975. [DOI] [PubMed] [Google Scholar]
- Ejsing CS, Sampaio JL, Surendranath V, Duchoslav E, Ekroos K, Klemm RW, Simons K, Shevchenko A. Global analysis of the yeast lipidome by quantitative shotgun mass spectrometry. Proc Natl Acad Sci USA. 2009;106:2136–2141. doi: 10.1073/pnas.0811700106. [DOI] [PMC free article] [PubMed] [Google Scholar]
- Eldakak A, Rancati G, Rubinstein B, Paul P, Conaway V, Li R. Asymmetrically inherited multidrug resistance transporters are recessive determinants in cellular replicative ageing. Nat Cell Biol. 2010;12:799–805. doi: 10.1038/ncb2085. [DOI] [PMC free article] [PubMed] [Google Scholar]
- Endo M, Takesako K, Kato I, Yamaguchi H. Fungicidal action of aureobasidin A, a cyclic depsipeptide antifungal antibiotic, against Saccharomyces cerevisiae. Antimicrob Agents Chemother. 1997;41:672–676. doi: 10.1128/aac.41.3.672. [DOI] [PMC free article] [PubMed] [Google Scholar]
- Epstein S, Castillon GA, Qin Y, Riezman H. An essential function of sphingolipids in yeast cell division. Mol Microbiol. 2012;84:1018–1032. doi: 10.1111/j.1365-2958.2012.08087.x. [DOI] [PubMed] [Google Scholar]
- Erjavec N, Larsson L, Grantham J, Nystrom T. Accelerated aging and failure to segregate damaged proteins in Sir2 mutants can be suppressed by overproducing the protein aggregation-remodeling factor Hsp104p. Genes Dev. 2007;21:2410–2421. doi: 10.1101/gad.439307. [DOI] [PMC free article] [PubMed] [Google Scholar]
- Ernst R, Klemm R, Schmitt L, Kuchler K. Yeast ATP-binding cassette transporters: cellular cleaning pumps. Methods Enzymol. 2005;400:460–484. doi: 10.1016/S0076-6879(05)00026-1. [DOI] [PubMed] [Google Scholar]
- Fairn GD, Hermansson M, Somerharju P, Grinstein S. Phosphatidylserine is polarized and required for proper Cdc42 localization and for development of cell polarity. Nat Cell Biol. 2011;13:1424–1430. doi: 10.1038/ncb2351. [DOI] [PubMed] [Google Scholar]
- Fontana L, Partridge L, Longo VD. Extending healthy life span—from yeast to humans. Science. 2010;328:321–326. doi: 10.1126/science.1172539. [DOI] [PMC free article] [PubMed] [Google Scholar]
- Forsburg SL, Rhind N. Basic methods for fission yeast. Yeast. 2006;23:173–183. doi: 10.1002/yea.1347. [DOI] [PMC free article] [PubMed] [Google Scholar]
- Gardner JM, Jaspersen SL. Manipulating the yeast genome: deletion, mutation, and tagging by PCR. Methods Mol Biol. 2014;1205:45–78. doi: 10.1007/978-1-4939-1363-3_5. [DOI] [PubMed] [Google Scholar]
- Gladfelter AS, Pringle JR, Lew DJ. The septin cortex at the yeast mother-bud neck. Curr Opin Microbiol. 2001;4:681–689. doi: 10.1016/s1369-5274(01)00269-7. [DOI] [PubMed] [Google Scholar]
- Guan XL, Souza CM, Pichler H, Dewhurst G, Schaad O, Kajiwara K, Wakabayashi H, Ivanova T, Castillon GA, Piccolis M, et al. Functional interactions between sphingolipids and sterols in biological membranes regulating cell physiology. Mol Biol Cell. 2009;20:2083–2095. doi: 10.1091/mbc.E08-11-1126. [DOI] [PMC free article] [PubMed] [Google Scholar]
- Hannich JT, Umebayashi K, Riezman H. Distribution and functions of sterols and sphingolipids. Csh Perspect Biol. 2011;3 doi: 10.1101/cshperspect.a004762. [DOI] [PMC free article] [PubMed] [Google Scholar]
- Hegedus C, Telbisz A, Hegedus T, Sarkadi B, Ozvegy-Laczka C. Lipid regulation of the ABCB1 and ABCG2 multidrug transporters. Adv Cancer Res. 2015;125:97–137. doi: 10.1016/bs.acr.2014.10.004. [DOI] [PubMed] [Google Scholar]
- Henderson KA, Gottschling DE. A mother’s sacrifice: what is she keeping for herself. Curr Opin Cell Biol. 2008;20:723–728. doi: 10.1016/j.ceb.2008.09.004. [DOI] [PMC free article] [PubMed] [Google Scholar]
- Herzig Y, Sharpe HJ, Elbaz Y, Munro S, Schuldiner M. A systematic approach to pair secretory cargo receptors with their cargo suggests a mechanism for cargo selection by Erv14. PLoS Biol. 2012;10:e1001329. doi: 10.1371/journal.pbio.1001329. [DOI] [PMC free article] [PubMed] [Google Scholar]
- Huang X, Liu J, Dickson RC. Down-regulating sphingolipid synthesis increases yeast lifespan. PLoS Genet. 2012;8:e1002493. doi: 10.1371/journal.pgen.1002493. [DOI] [PMC free article] [PubMed] [Google Scholar]
- Hughes AL, Gottschling DE. An early age increase in vacuolar pH limits mitochondrial function and lifespan in yeast. Nature. 2012;492:261–265. doi: 10.1038/nature11654. [DOI] [PMC free article] [PubMed] [Google Scholar]
- Inaba M, Yamashita YM. Asymmetric stem cell division: precision for robustness. Cell Stem Cell. 2012;11:461–469. doi: 10.1016/j.stem.2012.09.003. [DOI] [PubMed] [Google Scholar]
- Jazwinski SM. Growing old: metabolic control and yeast aging. Annu Rev Microbiol. 2002;56:769–792. doi: 10.1146/annurev.micro.56.012302.160830. [DOI] [PubMed] [Google Scholar]
- Jo MC, Liu W, Gu L, Dang W, Qin L. High-throughput analysis of yeast replicative aging using a microfluidic system. Proc Natl Acad Sci USA. 2015;112:9364–9369. doi: 10.1073/pnas.1510328112. [DOI] [PMC free article] [PubMed] [Google Scholar]
- Kirkwood TB. Understanding the odd science of aging. Cell. 2005;120:437–447. doi: 10.1016/j.cell.2005.01.027. [DOI] [PubMed] [Google Scholar]
- Kirkwood TB. Understanding ageing from an evolutionary perspective. J Intern Med. 2008;263:117–127. doi: 10.1111/j.1365-2796.2007.01901.x. [DOI] [PubMed] [Google Scholar]
- Koshy C, Schweikhard ES, Gartner RM, Perez C, Yildiz O, Ziegler C. Structural evidence for functional lipid interactions in the betaine transporter BetP. EMBO J. 2013;32:3096–3105. doi: 10.1038/emboj.2013.226. [DOI] [PMC free article] [PubMed] [Google Scholar]
- Laganowsky A, Reading E, Allison TM, Ulmschneider MB, Degiacomi MT, Baldwin AJ, Robinson CV. Membrane proteins bind lipids selectively to modulate their structure and function. Nature. 2014;510:172–175. doi: 10.1038/nature13419. [DOI] [PMC free article] [PubMed] [Google Scholar]
- Lee SS, Avalos Vizcarra I, Huberts DH, Lee LP, Heinemann M. Whole lifespan microscopic observation of budding yeast aging through a microfluidic dissection platform. Proc Natl Acad Sci USA. 2012;109:4916–4920. doi: 10.1073/pnas.1113505109. [DOI] [PMC free article] [PubMed] [Google Scholar]
- Lester RL, Withers BR, Schultz MA, Dickson RC. Iron, glucose and intrinsic factors alter sphingolipid composition as yeast cells enter stationary phase. Biochim Biophys Acta. 2013;1831:726–736. doi: 10.1016/j.bbalip.2012.12.012. [DOI] [PMC free article] [PubMed] [Google Scholar]
- Lindstrom DL, Gottschling DE. The mother enrichment program: a genetic system for facile replicative life span analysis in Saccharomyces cerevisiae. Genetics. 2009;183:413, 1SI–422. doi: 10.1534/genetics.109.106229. [DOI] [PMC free article] [PubMed] [Google Scholar]
- Liu J, Huang X, Withers BR, Blalock E, Liu K, Dickson RC. Reducing sphingolipid synthesis orchestrates global changes to extend yeast lifespan. Aging Cell. 2013;12:833–841. doi: 10.1111/acel.12107. [DOI] [PMC free article] [PubMed] [Google Scholar]
- Liu L, Rando TA. Manifestations and mechanisms of stem cell aging. J Cell Biol. 2011;193:257–266. doi: 10.1083/jcb.201010131. [DOI] [PMC free article] [PubMed] [Google Scholar]
- Longo VD, Antebi A, Bartke A, Barzilai N, Brown-Borg HM, Caruso C, Curiel TJ, de Cabo R, Franceschi C, Gems D, et al. Interventions to slow aging in humans: are we ready? Aging Cell. 2015;14:497–510. doi: 10.1111/acel.12338. [DOI] [PMC free article] [PubMed] [Google Scholar]
- Manford AG, Stefan CJ, Yuan HL, Macgurn JA, Emr SD. ER-to-plasma membrane tethering proteins regulate cell signaling and ER morphology. Dev Cell. 2012;23:1129–1140. doi: 10.1016/j.devcel.2012.11.004. [DOI] [PubMed] [Google Scholar]
- Martens C, Stein RA, Masureel M, Roth A, Mishra S, Dawaliby R, Konijnenberg A, Sobott F, Govaerts C, McHaourab HS. Lipids modulate the conformational dynamics of a secondary multidrug transporter. Nat Struct Mol Biol. 2016;23:744–751. doi: 10.1038/nsmb.3262. [DOI] [PMC free article] [PubMed] [Google Scholar]
- McFaline-Figueroa JR, Vevea J, Swayne TC, Zhou C, Liu C, Leung G, Boldogh IR, Pon LA. Mitochondrial quality control during inheritance is associated with lifespan and mother-daughter age asymmetry in budding yeast. Aging Cell. 2011;10:885–895. doi: 10.1111/j.1474-9726.2011.00731.x. [DOI] [PMC free article] [PubMed] [Google Scholar]
- Minois N. Molecular basis of the “anti-aging” effect of spermidine and other natural polyamines—a mini-review. Gerontology. 2014;60:319–326. doi: 10.1159/000356748. [DOI] [PubMed] [Google Scholar]
- Mitchison JM, Nurse P. Growth in cell length in the fission yeast Schizosaccharomyces pombe. J Cell Sci. 1985;75:357–376. doi: 10.1242/jcs.75.1.357. [DOI] [PubMed] [Google Scholar]
- Molano A, Huang Z, Marko MG, Azzi A, Wu D, Wang E, Kelly SL, Merrill AH, Jr, Bunnell SC, Meydani SN. Age-dependent changes in the sphingolipid composition of mouse CD4+ T cell membranes and immune synapses implicate glucosylceramides in age-related T cell dysfunction. PLoS One. 2012;7:e47650. doi: 10.1371/journal.pone.0047650. [DOI] [PMC free article] [PubMed] [Google Scholar]
- Montoliu I, Scherer M, Beguelin F, DaSilva L, Mari D, Salvioli S, Martin FP, Capri M, Bucci L, Ostan R, et al. Serum profiling of healthy aging identifies phospho- and sphingolipid species as markers of human longevity. Aging (Albany NY) 2014;6:9–25. doi: 10.18632/aging.100630. [DOI] [PMC free article] [PubMed] [Google Scholar]
- Mortimer RK, Johnston JR. Life span of individual yeast cells. Nature. 1959;183:1751–1752. doi: 10.1038/1831751a0. [DOI] [PubMed] [Google Scholar]
- Mostowy S, Cossart P. Septins: the fourth component of the cytoskeleton. Nat Rev Mol Cell Biol. 2012;13:183–194. doi: 10.1038/nrm3284. [DOI] [PubMed] [Google Scholar]
- Nakase M, Tani M, Morita T, Kitamoto HK, Kashiwazaki J, Nakamura T, Hosomi A, Tanaka N, Takegawa K. Mannosylinositol phosphorylceramide is a major sphingolipid component and is required for proper localization of plasma-membrane proteins in Schizosaccharomyces pombe. J Cell Sci. 2010;123:1578–1587. doi: 10.1242/jcs.059139. [DOI] [PubMed] [Google Scholar]
- Oh CS, Toke DA, Mandala S, Martin CE. ELO2 and ELO3, homologues of the Saccharomyces cerevisiae ELO1 gene, function in fatty acid elongation and are required for sphingolipid formation. J Biol Chem. 1997;272:17376–17384. doi: 10.1074/jbc.272.28.17376. [DOI] [PubMed] [Google Scholar]
- Ong K, Wloka C, Okada S, Svitkina T, Bi E. Architecture and dynamic remodelling of the septin cytoskeleton during the cell cycle. Nat Commun. 2014;5:5698. doi: 10.1038/ncomms6698. [DOI] [PMC free article] [PubMed] [Google Scholar]
- Phillips R, Ursell T, Wiggins P, Sens P. Emerging roles for lipids in shaping membrane-protein function. Nature. 2009;459:379–385. doi: 10.1038/nature08147. [DOI] [PMC free article] [PubMed] [Google Scholar]
- Ramadurai S, Duurkens R, Krasnikov VV, Poolman B. Lateral diffusion of membrane proteins: consequences of hydrophobic mismatch and lipid composition. Biophys J. 2010a;99:1482–1489. doi: 10.1016/j.bpj.2010.06.036. [DOI] [PMC free article] [PubMed] [Google Scholar]
- Ramadurai S, Holt A, Schafer LV, Krasnikov VV, Rijkers DT, Marrink SJ, Killian JA, Poolman B. Influence of hydrophobic mismatch and amino acid composition on the lateral diffusion of transmembrane peptides. Biophys J. 2010b;99:1447–1454. doi: 10.1016/j.bpj.2010.05.042. [DOI] [PMC free article] [PubMed] [Google Scholar]
- Rao RP, Yuan C, Allegood JC, Rawat SS, Edwards MB, Wang X, Merrill AH, Jr, Acharya U, Acharya JK. Ceramide transfer protein function is essential for normal oxidative stress response and lifespan. Proc Natl Acad Sci USA. 2007;104:11364–11369. doi: 10.1073/pnas.0705049104. [DOI] [PMC free article] [PubMed] [Google Scholar]
- Schultz MB, Sinclair DA. When stem cells grow old: phenotypes and mechanisms of stem cell aging. Development. 2016;143:3–14. doi: 10.1242/dev.130633. [DOI] [PMC free article] [PubMed] [Google Scholar]
- Sharpless NE, DePinho RA. How stem cells age and why this makes us grow old. Nat Rev Mol Cell Biol. 2007;8:703–713. doi: 10.1038/nrm2241. [DOI] [PubMed] [Google Scholar]
- Shmookler Reis RJ. Coming to terms with complexity: limits to a reductionist view of aging. Front Genet. 2012;3:149. doi: 10.3389/fgene.2012.00149. [DOI] [PMC free article] [PubMed] [Google Scholar]
- Sinclair DA, Guarente L. Extrachromosomal rDNA circles—a cause of aging in yeast. Cell. 1997;91:1033–1042. doi: 10.1016/s0092-8674(00)80493-6. [DOI] [PubMed] [Google Scholar]
- Sipiczki M. Where does fission yeast sit on the tree of life? Genome Biol. 2000;1:REVIEWS1011. doi: 10.1186/gb-2000-1-2-reviews1011. [DOI] [PMC free article] [PubMed] [Google Scholar]
- Steffen KK, Kennedy BK, Kaeberlein M. Measuring replicative life span in the budding yeast. J Vis Exp. 2009;2009:1209. doi: 10.3791/1209. [DOI] [PMC free article] [PubMed] [Google Scholar]
- Thayer NH, Leverich CK, Fitzgibbon MP, Nelson ZW, Henderson KA, Gafken PR, Hsu JJ, Gottschling DE. Identification of long-lived proteins retained in cells undergoing repeated asymmetric divisions. Proc Natl Acad Sci USA. 2014;111:14019–14026. doi: 10.1073/pnas.1416079111. [DOI] [PMC free article] [PubMed] [Google Scholar]
- Tomitori H, Kashiwagi K, Asakawa T, Kakinuma Y, Michael AJ, Igarashi K. Multiple polyamine transport systems on the vacuolar membrane in yeast. Biochem J. 2001;353:681–688. doi: 10.1042/0264-6021:3530681. [DOI] [PMC free article] [PubMed] [Google Scholar]
- Valdez-Taubas J, Pelham HRB. Slow diffusion of proteins in the yeast plasma membrane allows polarity to be maintained by endocytic cycling. Curr Biol. 2003;13:1636–1640. doi: 10.1016/j.cub.2003.09.001. [DOI] [PubMed] [Google Scholar]
- Wadsworth JM, Clarke DJ, McMahon SA, Lowther JP, Beattie AE, Langridge-Smith PR, Broughton HB, Dunn TM, Naismith JH, Campopiano DJ. The chemical basis of serine palmitoyltransferase inhibition by myriocin. J Am Chem Soc. 2013;135:14276–14285. doi: 10.1021/ja4059876. [DOI] [PubMed] [Google Scholar]
- Wasko BM, Kaeberlein M. Yeast replicative aging: a paradigm for defining conserved longevity interventions. FEMS Yeast Res. 2014;14:148–159. doi: 10.1111/1567-1364.12104. [DOI] [PMC free article] [PubMed] [Google Scholar]
- Xia YN, Whitesides GM. Soft lithography. Annu Rev Mater Sci. 1998;28:153–184. [Google Scholar]
- Yang J, McCormick MA, Zheng J, Xie Z, Tsuchiya M, Tsuchiyama S, El-Samad H, Ouyang Q, Kaeberlein M, Kennedy BK, Li H. Systematic analysis of asymmetric partitioning of yeast proteome between mother and daughter cells reveals “aging factors” and mechanism of lifespan asymmetry. Proc Natl Acad Sci USA. 2015;112:11977–11982. doi: 10.1073/pnas.1506054112. [DOI] [PMC free article] [PubMed] [Google Scholar]
Associated Data
This section collects any data citations, data availability statements, or supplementary materials included in this article.