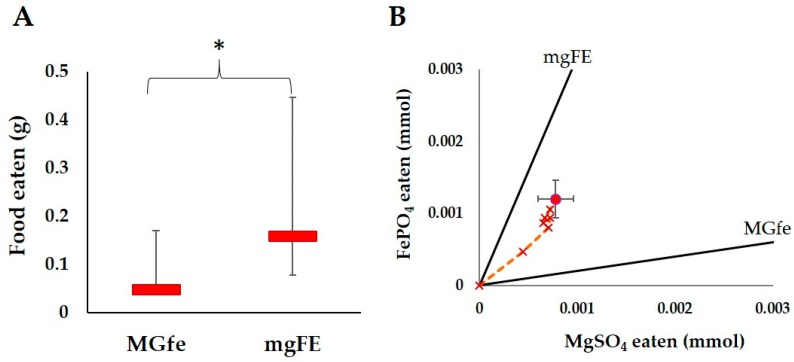
Figure 3.
Results of the feeding trial in termites exposed to the food varying in MgSO4 and FePO4 (MGfe and mgFE diets). (A) Medians (red bar) and quartiles (error bars) of the total amount of food eaten for all colonies (N = 10) after 14 days. The “*” indicates a significant difference between the amount of each diet consumed (p < 0.01); (B) The nutritional intake of the termites for MgSO4 and FePO4 over a 14 days period. The lines and symbols are the same as in Figure 2, except the large circle and x’s are in red and the nutrient rails represent the ratio of MgSO4 and FePO4 in both food types.

