 A two-step model of interfacial electron transfer is proposed along with a practical approach to screening dye-sensitizers based on a calculation of the percentage of electron density on the linker group and the number of available semiconductor acceptor states.
Abstract
Interfacial electron transfer (IET) is one of the crucial steps in the light-harvesting process that occurs in various assemblies for solar energy conversion, such as dye-sensitized solar cells or dye-sensitized photoelectrosynthesis cells. Computational studies of IET in dye–semiconductor assemblies employ a variety of approaches, ranging from phenomenological models such as Fermi’s golden rule to more complex methods relying on explicit solutions of the time-dependent Schrödinger equation. This work investigates IET in a model pyridine–TiO2 assembly, with the goals of assessing the validity of Fermi’s golden rule for calculation of the IET rates, understanding the importance of conformational sampling in modeling the IET process, and establishing an approach to rapid computational screening of dye-sensitizers that undergo fast IET into the semiconductor. Our results suggest that IET is a two-step process, in which the electron is first transferred into the semiconductor surface states, followed by diffusion of the electron into the nanoparticle bulk states. Furthermore, while Fermi’s golden rule and related approaches are appropriate for predicting the initial IET rate (i.e., the initial transfer of an electron from the dye into the semiconductor surface states), they are not reliable for prediction of the overall IET rate. The inclusion of conformational sampling at room temperature into the model offers a more complete picture of the IET process, leading to a distribution of IET rates with a median rate faster than the IET rate obtained for the fully-optimized structure at 0 K. Finally, the two most important criteria for determination of the initial IET rate are the percentage of electron density on the linker in the excited state as well as the number of semiconductor acceptor states available at the energy of the excited state. Both of these can be obtained from relatively simple electronic structure calculations at either ab initio or semiempirical levels of theory and can thus be used for rapid screening of dyes with the desired properties.
Introduction
Photoactive transition metal complexes and organic molecules anchored to semiconductor surfaces play an important role as chromophores in artificial systems for solar energy conversion, such as dye-sensitized solar cells (DSSCs)1–3 and photocatalytic systems.4–6 Light harvesting in these systems is an intricate multi-step process that begins with the absorption of sunlight by the dye and subsequent interfacial electron transfer (IET) between the excited dye and the conduction band (CB) of the semiconductor. Due to its importance for solar energy conversion,2 photocatalysis,5 and molecular electronics applications,7 IET has been the subject of numerous experimental and computational studies over the past several decades.8–16
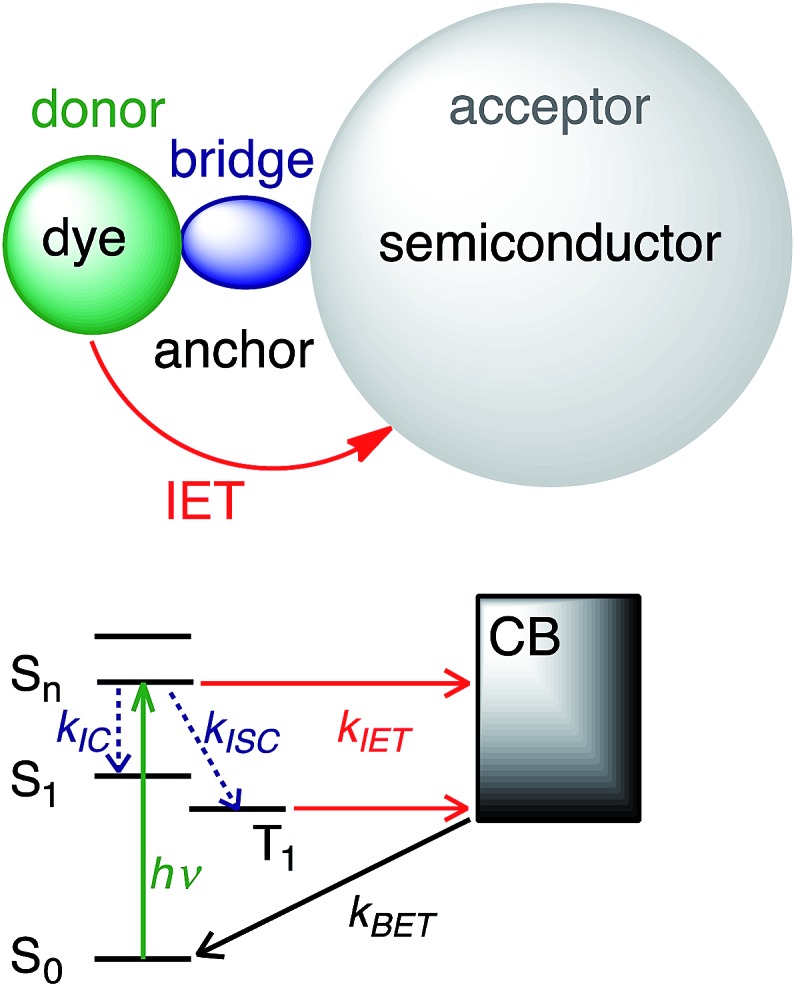
The current understanding of IET in dye–semiconductor assemblies relies on the donor–bridge–acceptor model, in which the dye serves as an electron donor and the semiconductor serves as an electron acceptor (see Fig. 1). Upon excitation with visible light, the dye undergoes IET through the molecular spacer and anchoring group (bridge) that link the dye with the nanoparticle surface. IET competes with other photoinduced processes, such as internal conversion (IC) and intersystem crossing (ISC). Electron injection is followed by electron relaxation and diffusion processes in the semiconductor, which further compete with the recombination of the injected electron with the oxidized dye via back electron transfer (BET).8,9
Fig. 1. IET in dye–semiconductor assemblies. Top: Representation of the donor–bridge–acceptor system. Bottom: Schematic of donor and acceptor energy levels and photoinduced processes.
IET at the molecule–semiconductor interface is a nonadiabatic process in which an electron transfers from a discrete donor dye state into a continuum of semiconductor acceptor states.8,9 A starting point for its theoretical description is Fermi’s golden rule, derived from first-order time-dependent perturbation theory. In this framework, the rate of electron transfer is given by:17–19
 |
1 |
where V DA(E) is the electronic coupling between the excited state of the dye and the semiconductor averaged over all the acceptor states available at energy E, ρ accept(E) is the density of the acceptor states at energy E, and λ corresponds to the reorganization energy. ΔG 0 is the driving force, while k B and T represent the Boltzmann constant and temperature, respectively. The expression in eqn (1) assumes an insignificant electron population in the conduction band of the semiconductor in the initial state and is valid only in the high temperature limit.
Interestingly, measurements of the IET rate often yield non-single exponential injection kinetics. The presence of different adsorption sites, crystal surfaces, adsorption geometries and the conformational flexibility of the dyes at room temperature lead to a distribution of electronic coupling elements V DA and thereby injection rates.20 IET also competes with other nonadiabatic processes, such as IC and ISC into new states that are also capable of undergoing IET, albeit at different rates.21,22 Despite its inherent simplifications, Fermi’s golden rule provides an important foundation for understanding how various properties of the dye, semiconductor and environment impact the IET.
Computational modelling of IET is a very active area of research. A variety of approaches are utilized, ranging from simple analytical models that rely on eqn (1) and its various modifications,23–25 to time evolution of the density matrix,26–28 to simulation methods that solve the time-dependent Schrödinger equation using either an exact quantum mechanical treatment or semi-classical and quantum-classical approximations (see ref. 10 and 13 for detailed reviews). Methodologies relying on explicit solutions of the time-dependent Schrödinger equation are in principle capable of describing not only the IET, but also other competing processes that occur on the same time scale. In contrast, analytical approaches based on transition state theory or Fermi’s golden rule are usually only focused on obtaining a rate constant for a single process. Our approach to IET modelling employs a quantum dynamics method originally developed by Rego and Batista29 that propagates the electronic wavefunction by solving the time-dependent Schrödinger equation with an extended Hückel (EH) Hamiltonian. The application of this semiempirical Hamiltonian allows one to model systems composed of hundreds of atoms, employing only modest computing resources. This method was previously used to describe IET in a number of different dye–nanoparticle assemblies,29–45 as well as excited state energies and charge transfer processes in molecular systems.46–48 Despite its inherent simplicity and a tendency to overestimate the calculated rates,46,49 it has been shown to reliably reproduce experimental trends in the IET rates in a number of dye–TiO2 assemblies.31,32,40,41,49
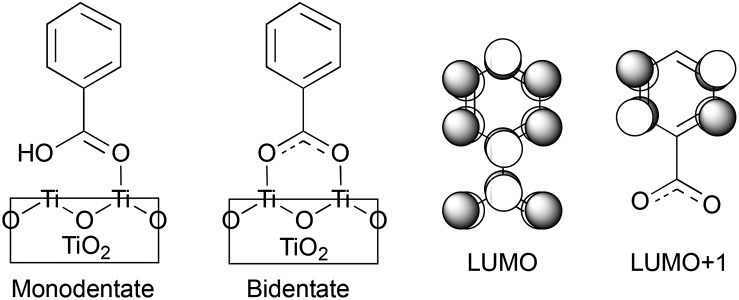
In this work, we perform quantum dynamics simulations to study the IET of a prototype isonicotinic acid–TiO2 semiconductor assembly (see Fig. 2). Isonicotinic acid (pyCA) is a model for carboxylated pyridyl rings, which are common binding motifs for a variety of metal polypyridine dyes,2 thus a detailed understanding of this system can be used to assist in the rational design of efficient dye sensitizers. First, we investigate how different attachment modes of the linker on the surface (monodentate vs. bidentate) and the distribution of adsorbate conformations at room temperature affect the IET. Second, we evaluate the dependence of the calculated IET rates on various properties of the semiconductor and adsorbate featured in eqn (1) (i.e., electronic coupling, density of acceptor states on the semiconductor, and driving force), thus gaining insight into the validity of Fermi’s golden rule for a theoretical description of the IET process. Such analysis allows us to identify structural and electronic features of the dyes and semiconductors that directly influence the IET rates and thus allow for rapid screening of dye–nanoparticle assemblies with the desired properties. Finally, based on the results of our simulations as well as insights from previous experimental work,4,50 we propose a two-step model of the IET process in dye–semiconductor assemblies that consists of an initial electron injection into the surface semiconductor states and subsequent electron diffusion into the TiO2 bulk states.
Fig. 2. Model system for this work. Left: pyCA–TiO2 semiconductor assemblies with monodentate and bidentate attachment modes. Right: nodal structure of LUMO and LUMO+1 of pyCA.
Methods
Structure optimization
The Vienna Ab initio Simulation Package (VASP)51–54 was employed to optimize the structures of bulk TiO2 anatase and (101) TiO2 surfaces functionalized with pyCA in monodentate and bidentate attachment modes. The optimizations were done at the PBE55,56 level of theory with the projector augmented wave method,57,58 and the plane wave basis set expansion terminated at 500 eV. The PBE functional was chosen over hybrid functionals, such as B3LYP, because of computational efficiency considerations. Note that structure optimizations employing PBE and B3LYP functionals result in very similar Ti–O and Ti–C bond lengths.59 As reported previously,39,40 the unit cell for bulk anatase was obtained with 13 × 13 × 13 k-point sampling, resulting in a tetragonal lattice with lattice vectors a = b = 3.81 Å and c = 9.77 Å. The optimized anatase TiO2 bulk unit cell was used to construct a slab model of the (101) TiO2 surface functionalized with pyCA in both bidentate and monodentate attachment modes. These two binding motifs were chosen as the two most probable attachment modes for the adsorption of the carboxylic acid group onto the TiO2 surface, based on previous work.60–65 The top two layers of Ti atoms and the top four layers of O atoms were then relaxed using 5 × 3 × 1 k-point sampling. During relaxation, the lattice vectors were fixed at a = 15.25 Å, b = 10.49 Å, and c = 26.00 Å. The two relaxed supercells were used in all the IET simulations.
Molecular dynamics on pyCA–TiO2 assemblies and sample selection
A density functional-based tight binding (DFTB) method was employed for the molecular dynamics (MD) simulations using the DFTB+ software suite.66 The mio parameter set and tiorg parameter set were used for all simulations.67,68 A detailed description of the DFTB method can be found elsewhere.67
Ten NVT simulations with different seed numbers were set up for both the monodentate and bidentate attachment modes with a temperature of 298.15 K and time step of 1 fs, for a total of 42 ps. The Nosé–Hoover thermostat69,70 with a chain length of 5 and a coupling frequency of 3600 cm–1 was used in all the MD simulations. Only the top layer of Ti atoms, top two layers of O atoms, and pyCA were allowed to move during the MD simulations. The first 12 ps of each simulation were used for equilibration. Twenty samples were chosen randomly from the 12 to 42 ps period of every MD simulation, leading to a total of 400 randomly chosen structures for pyCA on the TiO2 surface, with 200 representing the dye–TiO2 assembly in the monodentate binding mode, and 200 in the bidentate binding mode.
The electron density on the carboxylic acid group in the LUMO (lowest unoccupied molecular orbital) and LUMO+1 for different structures was obtained by Mulliken population analysis from single point calculations at the EH71–74 level of theory for each of the structures. Gaussian 09 (revision D.01) was used for all molecular calculations.75
Interfacial electron transfer simulations
Quantum dynamics simulations were performed on all the sampled dynamic structures as well as the DFT-optimized structures to investigate the IET in the pyCA–TiO2 assemblies using the method developed by Rego and Batista.29 This method employs an EH Hamiltonian to propagate the time-dependent wavefunction, and is described in detail elsewhere.29,34 A standard EH parameter set (as implemented in the YAeHMOP) was employed in all the calculations.76,77 The same parameter set was utilized in previous simulations of IET in dye–semiconductor assemblies that contain pyCA–TiO2 and related binding motifs, and successfully reproduced the experimental trends.31,32,39–41
The LUMO and LUMO+1 of pyCA were utilized as the initial particle states for time evolution on the entire dye–TiO2 assembly. All quantum dynamics simulations were run for 2 ps with a time step of 0.1 fs. Atomic positions were fixed during the quantum dynamics simulations. Periodic boundary conditions with a supercell of 15.25 × 10.49 × 40.00 Å3 and k-point sampling of 1 × 1 × 1 were used for all model systems. To avoid artificial recurrences caused by the limited number of TiO2 layers, an imaginary absorbing potential was added to the diagonal elements of the EH Hamiltonian for the bottom layer of Ti atoms.29
The survival probabilities obtained from the IET simulations were fitted with a linear combination of exponential functions,
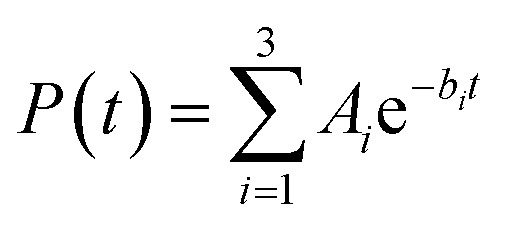 |
2 |
with the following constraints:
 |
3 |
The characteristic IET times (τ) were obtained from the expectation values of the survival probabilities as
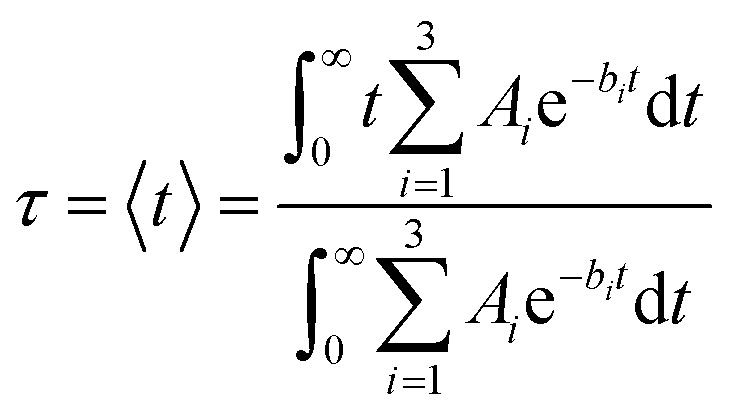 |
4 |
This simple fitting model gives results identical to those obtained from more sophisticated models, such as upper envelope fitting or inclusion of the cos or sin functions (see ESI, Fig. S1†). The overall characteristic times (τ) were obtained by fitting the survival probabilities for 2 ps, while the initial characteristic times (τ ini) were obtained by fitting the initial 5 fs of the survival probability curves.
Least absolute shrinkage and selection operator
The least absolute shrinkage and selection operator (LASSO)71 is employed to select the most relevant parameter sets for describing τ and τ ini of the sampled structures. Consider a multi-dimensional linear regression problem,
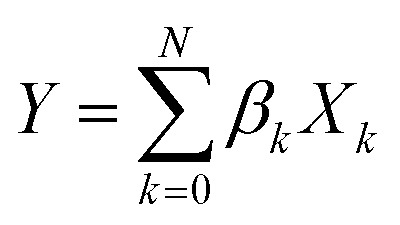 |
5 |
where the function Y = [y 1, y 2, …, y M] is estimated by a linear combination of different factors {X k = [x k1, x k2, …, x kM]}, and β k is the coefficient for each factor. The LASSO is designed to select a set of important factors {X′k} from the original set. To achieve the parameter set selection, a penalty term is added to the objective function for linear regression. The objective function for the LASSO is
 |
6 |
where the first term is the objective function for the least squares linear regression, and the second term is the penalty term. By scanning the weight λ from 0 to 1, the coefficients of the less important factors will be set to be zero earlier than those for the terms with higher importance. The non-zero parameter set with the largest λ, such that the mean squared error (MSE) of the regression is within one standard error of the smallest MSE, is selected as the parameter set in our work.
Results and discussion
DFT-optimized structures
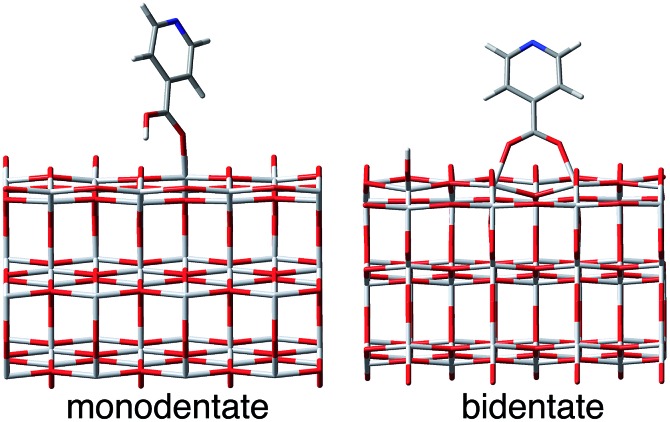
The optimized slabs of pyCA attached to the (101) TiO2 anatase surface via the carboxylic acid in the monodentate and bidentate binding modes are shown in Fig. 3. The distances between the O atom of the carboxylic acid and the nearest Ti atom on the TiO2 surface are significantly different for the two attachment modes. The two shortest O–Ti distances for the monodentate attachment mode are 2.09 Å and 4.26 Å, indicating a single O–Ti bond between the surface and the adsorbate. In contrast to this, the two shortest O–Ti bond lengths in the bidentate attachment are 2.05 Å and 2.07 Å, suggesting that the carboxylic acid linker is bound to the surface via both O atoms.
Fig. 3. Optimized pyCA–TiO2 slabs in the monodentate (left) and bidentate (right) attachment modes.
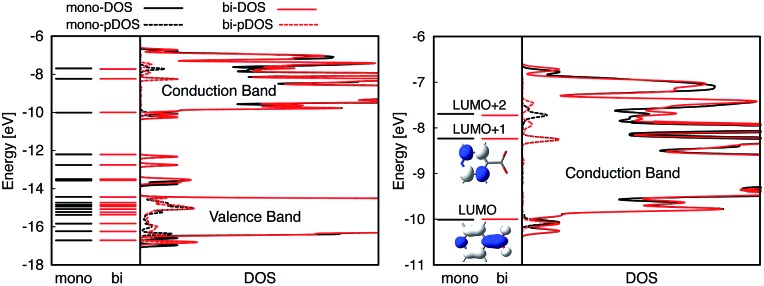
Fig. 4 displays the LUMO and LUMO+1 of the adsorbate in the bidentate attachment mode (the adsorbate MOs in the monodentate and bidentate attachment modes are virtually identical). While the LUMO has a substantial amount of electron density on the carboxylic acid linker (35%), the percentage of electron density on the linker in the LUMO+1 is virtually zero (<0.1%). The excited state of the adsorbate, characterized by the population of the LUMO+1 orbital, will therefore only display weak coupling with the TiO2 acceptor states despite having a greater driving force.
Fig. 4. Left: DOS and pDOS for both the valence and conduction bands of the pyCA–TiO2 assembly obtained at the EH level of theory for the monodentate (black) and bidentate (red) attachment modes. The energy levels of the isolated pyCA are shown on the left. Right: Details of the DOS and pDOS for the conduction band of the pyCA–TiO2 assembly. The LUMO and LUMO+1 for the adsorbate in the bidentate attachment mode obtained at the EH level of theory are also shown.
Fig. 4 displays the overall density of states (DOS) for the pyCA–TiO2 assemblies, as well as the DOS projected onto the energy levels of the adsorbate (pDOS), for the monodentate and bidentate attachment modes. The DOS and pDOS for both attachment modes are very similar. The LUMO of the adsorbate lies approximately 0.4 eV above the lower edge of the conduction band of the TiO2 semiconductor, limiting the number of available states on TiO2 capable of accepting electrons via IET. Previous computational studies of the pyCA–TiO2 system performed at the DFT level of theory placed the LUMO of the carboxylic acid 0.19–0.53 eV relative to the TiO2 anatase conduction band edge,78,79 in agreement with our calculated values.
IET in the pyCA–TiO2 assemblies with DFT-optimized (0 K) structures
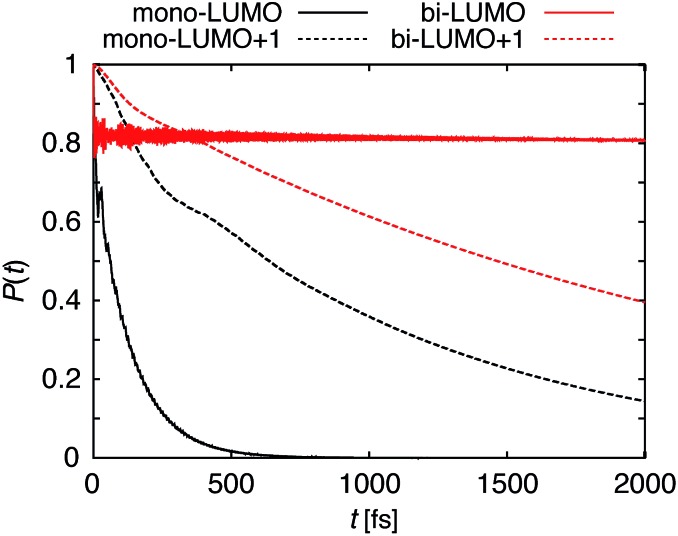
The survival probabilities resulting from the IET simulations on the DFT-optimized pyCA–TiO2 assemblies are shown in Fig. 5. While the DOS and pDOS plots are almost identical for the slabs with monodentate and bidentate attachment modes (see Fig. 4), the IET in these assemblies displays very different long-term behaviors. This is true especially for the simulations with the initial state created by population of the LUMO, where the characteristic time for electron transfer into the semiconductor, τ, is several orders of magnitude faster for the slab with the monodentate attachment (125 fs vs. 99 ps, also see Fig. 5). Large differences in the IET rates in the adsorbate–TiO2 assemblies with monodentate and bidentate binding modes were also observed in our previous work on Fe(ii)–polypyridine sensitized TiO2.41
Fig. 5. Survival probabilities, P(t), describing the IET in the DFT-optimized pyCA–TiO2 assemblies with monodentate (black) and bidentate (red) binding modes. The solid and dashed lines correspond to the IET from the LUMO and LUMO+1, respectively.
Interestingly, the characteristic IET times obtained from fitting the survival probabilities for the initial 5 fs, τ ini, are more similar for the two attachment modes, and are at least within an order of magnitude of each other. τ and τ ini for both of the attachment modes are summarized in Table 1. The overall characteristic time is longer than the initial characteristic time in all instances, with the differences reaching up to three orders of magnitude in the case of the LUMO initial state. This indicates that while the initial wavepacket transfer between the excited pyCA and the TiO2 surface is very fast, the wavepacket propagation inside the TiO2 nanoparticle slows down significantly. As will be discussed later, this is due to the small driving force and low density of the semiconductor acceptor states available for coupling at the LUMO energy level (also see Fig. 4).
Table 1. Initial and overall characteristic IET times of the DFT-optimized and MD-sampled structures.
| Initial state (attachment mode) | DFT-optimized |
MD-sampled (median) |
||
| τ | τ ini | τ | τ ini | |
| LUMO (monodentate) | 124.9 fs | 20.14 fs | 99.06 fs | 16.62 fs |
| LUMO (bidentate) | 99.12 ps | 13.46 fs | 1.643 ps | 15.59 fs |
| LUMO+1 (monodentate) | 1.109 ps | 775.8 fs | 231.5 fs | 102.3 fs |
| LUMO+1 (bidentate) | 2.229 ps | 2.057 ps | 164.2 fs | 105.2 fs |
MD-sampled structures at room temperature
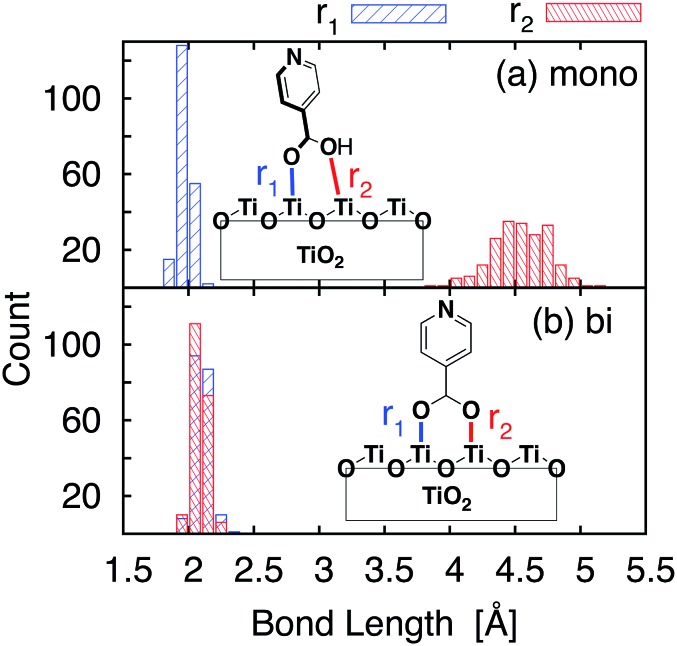
Important structural features of the MD-sampled conformations are summarized in Fig. 6 and 7. As can be seen from the distribution of the O–Ti bond lengths shown in Fig. 6, we did not observe interconversion between the monodentate and bidentate attachment modes in the course of the MD simulations. The distribution of the distances between the O atom of the carboxylic acid and the nearest Ti atom on the TiO2 surface is significantly different for the two attachment modes, just like in the case of the DFT-optimized structures. The O–Ti distances for the slab with the monodentate attachment are distributed around two different lengths, ∼4.5 Å and ∼2.0 Å, while the two O–Ti distances for the bidentate attachment mode can be found in the same region, at ∼2.1 Å. This suggests that both of these attachments are relatively stable and can co-exist on the TiO2 surface at room temperature.
Fig. 6. O–Ti bond length distributions for the sampled structures. The result for the monodentate structure is shown in (a), and the result for the bidentate structure is shown in (b). The two O–Ti distances are represented by different colors.
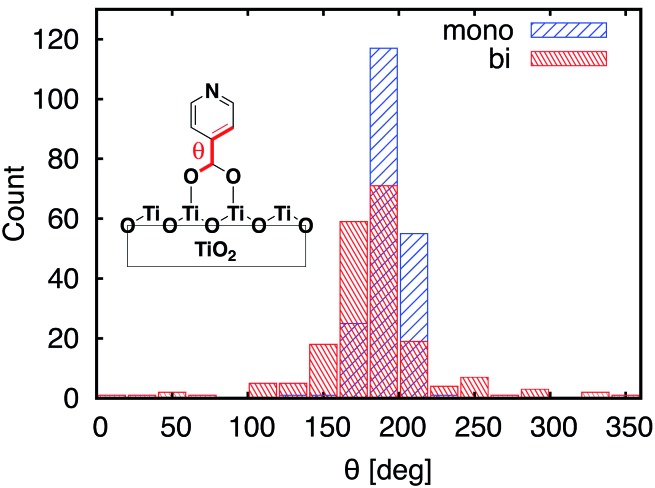
Fig. 7. Distribution of dihedral angles between the carboxylic acid anchoring group and pyridine for the MD-sampled structures of the monodentate (blue) and bidentate (red) slabs.
One of the most significant structural changes the adsorbate undergoes during the MD simulation is the change in the dihedral angle (θ) between the pyridine ring and the carboxylic acid group (see Fig. 7). These two moieties are coplanar (θ = 180°) in the DFT-optimized structure, but θ varies widely over the course of the MD simulations. Notably, the θ angle distribution is much wider for the bidentate than the monodentate attachment mode, with all values of θ between 0° and 360° present in the distribution for the bidentate attachment mode (see Fig. 7). The –OH group of the carboxylic acid in the monodentate attachment is only weakly bound to the TiO2 surface, hence the motion (or rotation) of the pyridine ring is coupled with the motion of the –OH group, so the dihedral angle θ stays relatively close to 180° at all times. Conversely, the two terminal O atoms of the carboxylate group are bound more strongly to the TiO2 surface in the bidentate attachment mode. Therefore, the carboxylic acid group is not able to follow the rotation of the pyridine ring as easily, and the π-conjugation between the two moieties breaks in the process.
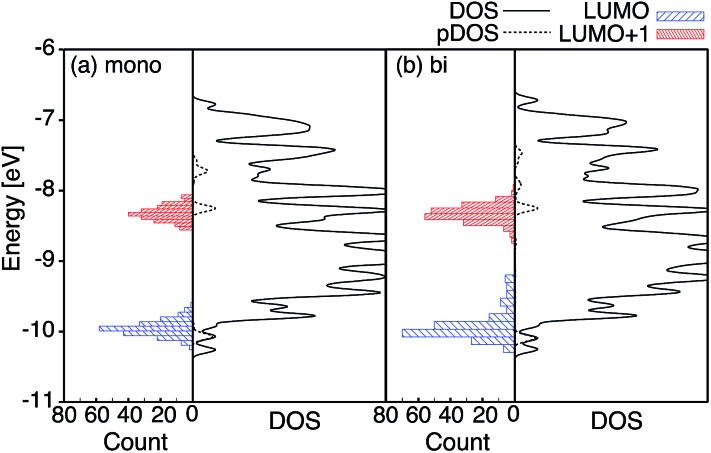
Fig. 8 shows the distribution of the LUMO and LUMO+1 energies for the adsorbates in the MD-sampled structures with monodentate and bidentate attachment modes. The LUMO and LUMO+1 are well separated in energy, and no crossover is observed between these two orbitals (i.e., the nodal shape of the LUMO and LUMO+1 is the same for all the sampled structures) for either binding mode. Since the adsorbate in the bidentate attachment displays a wider range of dihedral θ angles, its orbital energies are distributed more widely than those in the monodentate attachment. Additionally, the LUMO energies are distributed over a larger range than the LUMO+1 energies for both attachment modes. Recall that the LUMO has electron density on the carboxylic acid linker, while the electron density in the LUMO+1 is almost exclusively localized on the pyridine ring (see Fig. 4). Therefore, the energy of the LUMO is more significantly affected by the pyridine ring rotation and the subsequent breaking of the π-conjugation, leading to a wider distribution of orbital energies across the sampled structures. As will be discussed in detail below, it is this feature that results in the significantly shorter initial lifetimes of the bidentate mode once the molecular motion has been accounted for, which suggests that dramatically different results can be obtained when this molecular motion is neglected.
Fig. 8. Distribution of the extended Hückel orbital energies of the LUMO (blue) and LUMO+1 (red) for the monodentate (left) and bidentate (right) attachment modes. For convenience, DOS (solid line) and pDOS (dashed line) for the corresponding DFT-optimized structures are shown to the right of the energy distributions.
IET in the pyCA–TiO2 assemblies with MD-sampled structures
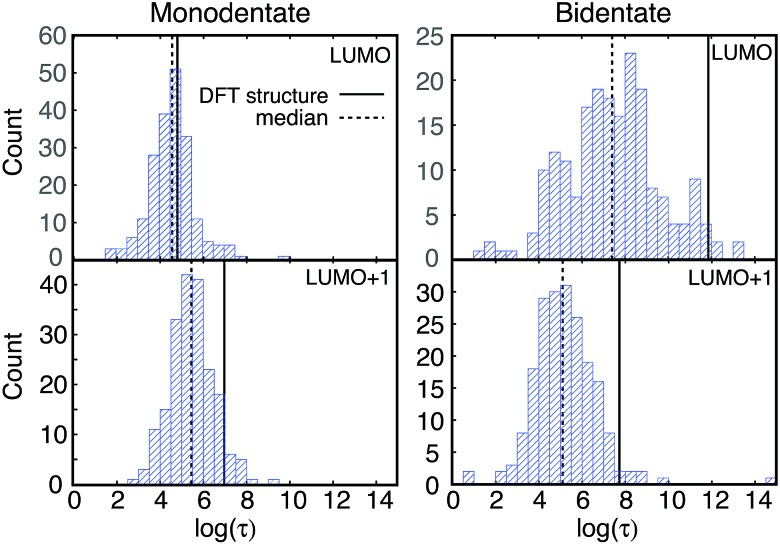
IET simulations were run on the structures randomly selected from the MD simulations (200 for each attachment mode). The distributions of characteristic IET times obtained from the simulations with different initial states (LUMO and LUMO+1) and attachment modes (monodentate and bidentate) are shown in Fig. 9. In all instances, more than half of the sampled structures show a shorter characteristic IET time than the DFT-optimized (0 K) structures. Interestingly, previous work by Abuabara et al. that utilized MD-coupled quantum dynamics simulations to study the influence of thermal fluctuations on IET in catechol-sensitized TiO2 also showed that thermal fluctuations speed up IET dynamics and suggested that this is due to the emergence of additional relaxation pathways.30 The overall trends in the IET rates are, however, the same between the MD-sampled and DFT-optimized structures: the monodentate attachment with the LUMO initial state displays the fastest IET rate, followed by the IET rate from the LUMO+1 initial state in both the monodentate and bidentate attachments, with the electron injection being the slowest from the LUMO initial state in the bidentate attachment mode (see Table 1 and Fig. 9 and 10). The IET rates are more widely distributed for the MD-sampled structures of the adsorbate–TiO2 assembly with the bidentate attachment mode, which is a result of the wider distribution of geometries, and consequently orbital energies, in comparison to those for the monodentate attachment mode.
Fig. 9. Distribution of τ values (log scale) for injection from the LUMO and LUMO+1 initial states of the two attachment modes. The τ values for the DFT-optimized structures are shown with solid lines, and the median τ values for the sampled structures are indicated by dashed lines.
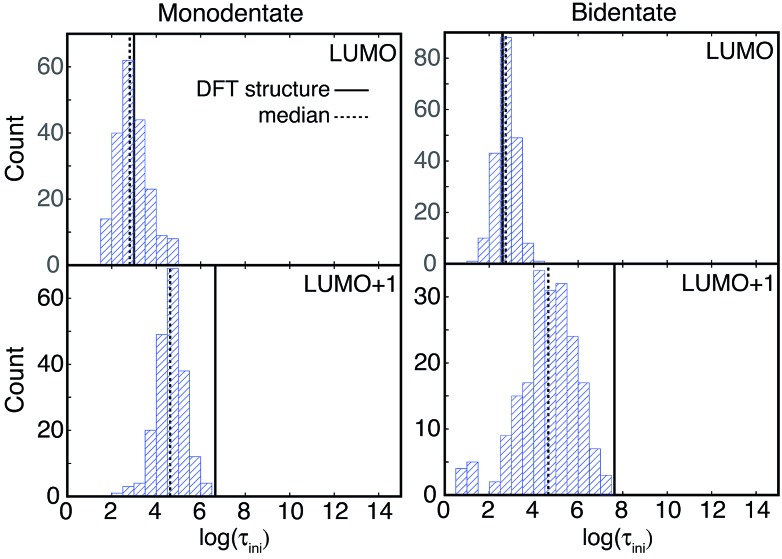
Fig. 10. Distribution of τ ini values (log scale) for injection from the LUMO and LUMO+1 initial states of the two attachment modes. The τ ini values for the DFT-optimized structures are indicated by solid lines, and the median τ values for the sampled structures are shown as dashed lines.
The initial IET characteristic times, τ ini, for the MD-sampled structures obtained by fitting the first 5 fs of the survival probability function are shown in Fig. 10. The distribution of τ ini is not as wide as the distribution of τ, with τ ini being consistently shorter than τ for all the investigated structures (τ ini < τ). Additionally, we found that the differences between the median τ ini and τ values are significantly smaller for the simulations with the LUMO+1 initial state, which is in agreement with the results obtained for the DFT-optimized structures (see Table 1). Moreover, the distribution of τ ini is considerably wider for the structures with the bidentate attachment mode. These results indicate that the conformation of pyCA attached to the TiO2 surface affects the initial IET rate, which describes the electron transfer from the dye into the semiconductor surface, as well as the overall IET rate, which also accounts for the propagation of the electron inside the TiO2 nanoparticle.
Comparison of wavepacket dynamics with the Newns–Anderson approach
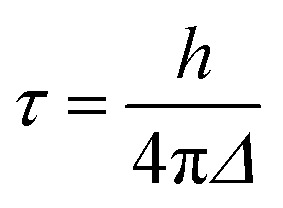
A variation of the Newns–Anderson approach, introduced by Persson, Lunell, and Ojamäe, provides another simple way to estimate the electron injection rates and characteristic times in dye–nanoparticle assemblies.25,72,73 In this approach, τ is obtained as
 |
7 |
where h is Planck’s constant and Δ represents the half-width at half-maximum of the adsorbate’s pDOS. Utilizing this approach, we have obtained τ from the LUMO and LUMO+1 initial states for the DFT-optimized structures, as well as an average rate for the MD-sampled structures (see Table 2), based on the DOS and pDOS obtained from the EH calculations.
Table 2. τ predicted from the Newns–Anderson approach obtained from DOS broadening with Gaussian functions with full-width at half-maximum equal to 0.1 eV. Lifetime broadening Δ utilized in computing τ for the MD-sampled structures was generated from the average pDOS of all the sampled structures.
| Initial state (attachment mode) |
τ [fs] |
|
| DFT-optimized structures | MD-sampled structures | |
| LUMO (monodentate) | 6.82 | 2.30 |
| LUMO (bidentate) | 6.60 | 2.59 |
| LUMO+1 (monodentate) | 6.53 | 2.25 |
| LUMO+1 (bidentate) | 6.69 | 3.26 |
Interestingly, this model predicts very small values of τ (i.e., fast injection rates) for all structures and both initial states, regardless of the binding mode (monodentate vs. bidentate). This is in contrast to the characteristic IET times obtained from the quantum dynamics simulations, which differ by several orders of magnitude depending on the initial state and the attachment mode (see Table 1). A comparison of the results obtained through these two approaches suggests that the “lifetime broadening” (Δ) of the initial states is not the determining factor for the IET rates in the investigated dye–nanoparticle systems. This further suggests that even in simple cases such as TiO2 sensitized with isonicotinic acid, the Newns–Anderson approach should be used with caution. Since the Newns–Anderson method essentially estimates the IET rate based on the strength of the electronic coupling between the adsorbate and the semiconductor, we attribute this apparent disagreement to a poor correlation between the electronic coupling and the overall IET rate, as shown in the following sections. Finally, it is worth noting that the characteristic IET times reported in Table 2 are in good agreement with the characteristic times calculated for the same system utilizing the lifetime broadening obtained at the B3LYP level of theory (5 fs and 17 fs) in two different computational studies.78,80
Structural and electronic factors that influence the characteristic IET time
The results presented in the previous sections suggest that the overall and initial IET rates are strongly influenced by the conformation of the dye on the TiO2 surface. This raises two important questions: (1) what are the structural and electronic features of the dye and dye–TiO2 interface that are responsible for the differences in the IET process between the excited dye and the semiconductor at different conformations? (2) Can the results of our simulations be used to extract design principles to guide the development of dyes with more efficient IET?
Looking at the IET in dye–semiconductor assemblies through the lens of Fermi’s golden rule (see eqn (1)), three factors have been previously identified as the most important for determining the efficiency of the IET in dye–semiconductor assemblies: (1) the driving force for the injection, (2) density of the semiconductor acceptor states, ρ accept, and (3) electronic coupling between the donor states of the dye and the acceptor states of the semiconductor.2,8,81
In general, the driving force depends on the energy difference between the donor (excited) state of the dye and the lower edge of the CB of the semiconductor (ΔE MO-edge). It can be determined experimentally as the energy difference between the redox potential of the excited dye and the edge of the semiconductor CB. In our simple model, the driving force is proportional to the energy of the initially populated state, the LUMO or LUMO+1, which strongly varies with the structure (see Fig. 8). The density of the TiO2 acceptor states, ρ accept, can be obtained by integrating the DOS curve over the energy region centered at the energy of the initially populated dye state that covers 85% of the pDOS peak (see ESI, Fig. S2†). Finally, the electronic coupling, or orbital overlap between the dye donor state and TiO2 acceptor states, is proportional to the amount of electron density on the linker anchoring the dye to the semiconductor in the excited state of the dye (%ρ linker).41,42
Based on the above considerations, the dependence of τ and τ ini on the MO energies of the initial states (LUMO, LUMO+1), the number of available TiO2 acceptor states, and the percentage of electron density on the linker group in the initial state was investigated. Investigating the dependence of the characteristic times on these parameters individually did not reveal any strong correlations (see ESI, Tables S1, S2 and Fig. S3–S6†), with the exception of the strong dependence of the initial characteristic time (τ ini) on the percentage of electron density on the linker (see ESI, Fig. S6†).
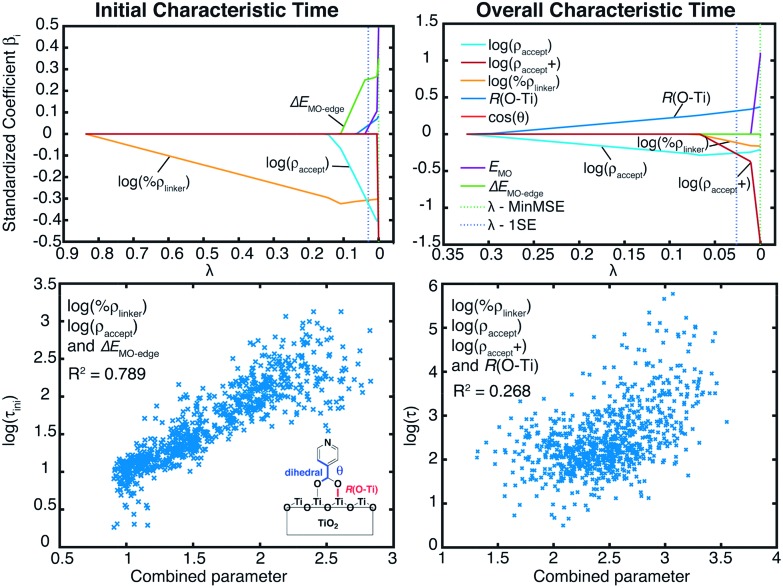
Fig. 11 summarizes the results of the LASSO regression, along with the multiple linear regression analysis utilizing the reduced parameter set. Seven parameters were included in the LASSO analysis: ρ accept, the number of available TiO2 states between the energy of the initially populated dye state and the lower edge of the conduction band of TiO2 (ρ accept+), %ρ linker, the energy of the initial state (E MO), ΔE MO-edge, the shortest distance between an O atom of the linker and a Ti atom of the TiO2 surface, R(O–Ti), and the cosine of the dihedral angle between the planes of the pyridine ring and the carboxylic acid linker (cos(θ)).
Fig. 11. LASSO regression analysis for τ ini and τ (top). Linear regression for variables selected from the LASSO regression analysis (bottom).
Based on the results of the LASSO analysis, the three parameters with the most important impact on τ ini are %ρ linker, ρ accept, and ΔE MO-edge. The τ ini value has a moderately strong dependence on a combination of these three parameters, with R 2 equal to 0.79 for the fit (see Fig. 11). It is worth emphasizing again that each of these parameters is related to one of the factors featured in Fermi’s golden rule: %ρ linker is related to the electronic coupling, ρ accept represents the density of the available acceptor states, and ΔE MO-edge is associated with the driving force. The strong relationship between %ρ linker, ρ accept, ΔE MO-edge and τ ini indicates that Fermi’s golden rule is an excellent model for predicting the short-term behaviour of the IET process in dye–nanoparticle assemblies.
In contrast to the initial characteristic time, there is only a weak correlation (R 2 = 0.27) between the overall characteristic time, τ, and four parameters determined from the LASSO analysis: %ρ linker, ρ accept, ρ accept+ and R(O–Ti). This suggests that there are other important structural or electronic properties with strong influences on the τ value that we failed to include in our analysis. The observed weak correlation also indicates that while Fermi’s golden rule provides an excellent model for the determination of the initial IET rates, it may not be as successful at predicting longer-term behaviour of the IET process, and there are additional factors relevant to the properties of the nanoparticle that impact the overall IET rate.
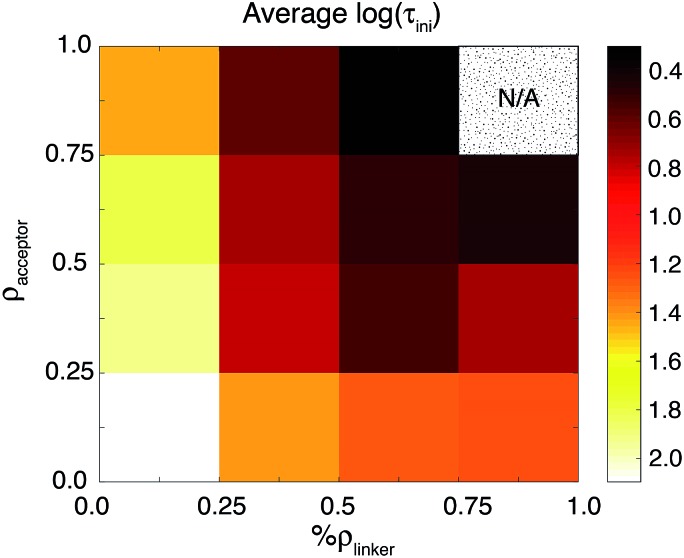
The results of the LASSO analysis and linear regression suggest that the two most important electronic factors that impact both τ ini and τ are %ρ linker and ρ accept. Fig. 12 further illustrates the strong relationship between these two parameters and τ ini. IET occurs most efficiently for cases where the values of these properties are maximized. Also, these parameters can help us understand the differences in injection rates between the DFT-optimized structures and room-temperature conformations. As shown in Table 3, the room-temperature conformations have a higher number of acceptor states than the DFT-optimized structures. Additionally, the LUMO+1 state of the MD-sampled structures has a larger %ρ linker on the linker group than the DFT structures.
Fig. 12. The relationship between %ρ linker, ρ accept, and τ ini. The τ ini values are represented by colors. Both variables are normalized by setting the new variable equal to x′ = (x – x min)/(x max – x min). The top-right region is labeled N/A because there are no data points from the room-temperature conformations that fall into this block.
Table 3. %ρ linker, ρ accept, and ΔE MO-edge for the DFT-optimized and MD-sampled structures.
| DFT-optimized |
MD-sampled (median) |
|||||
| %ρ linker [%] | ρ accept | ΔE MO-edge [eV] | %ρ linker [%] | ρ accept | ΔE MO-edge [eV] | |
| Monodentate LUMO | 38.9 | 1.25 | 0.49 | 38.1 | 3.08 | 0.41 |
| Bidentate LUMO | 39.2 | 1.27 | 0.50 | 39.2 | 7.20 | 0.40 |
| Monodentate LUMO+1 | 0.00 | 7.77 | 2.27 | 0.01 | 10.42 | 2.05 |
| Bidentate LUMO+1 | 0.00 | 6.08 | 2.26 | 0.01 | 16.61 | 2.05 |
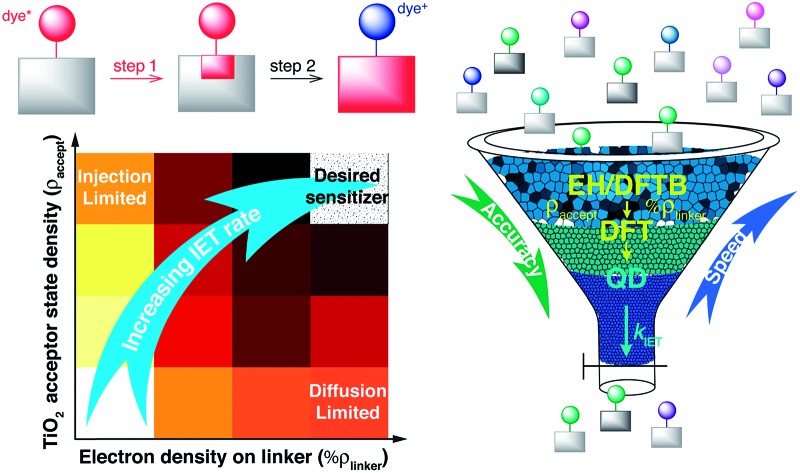
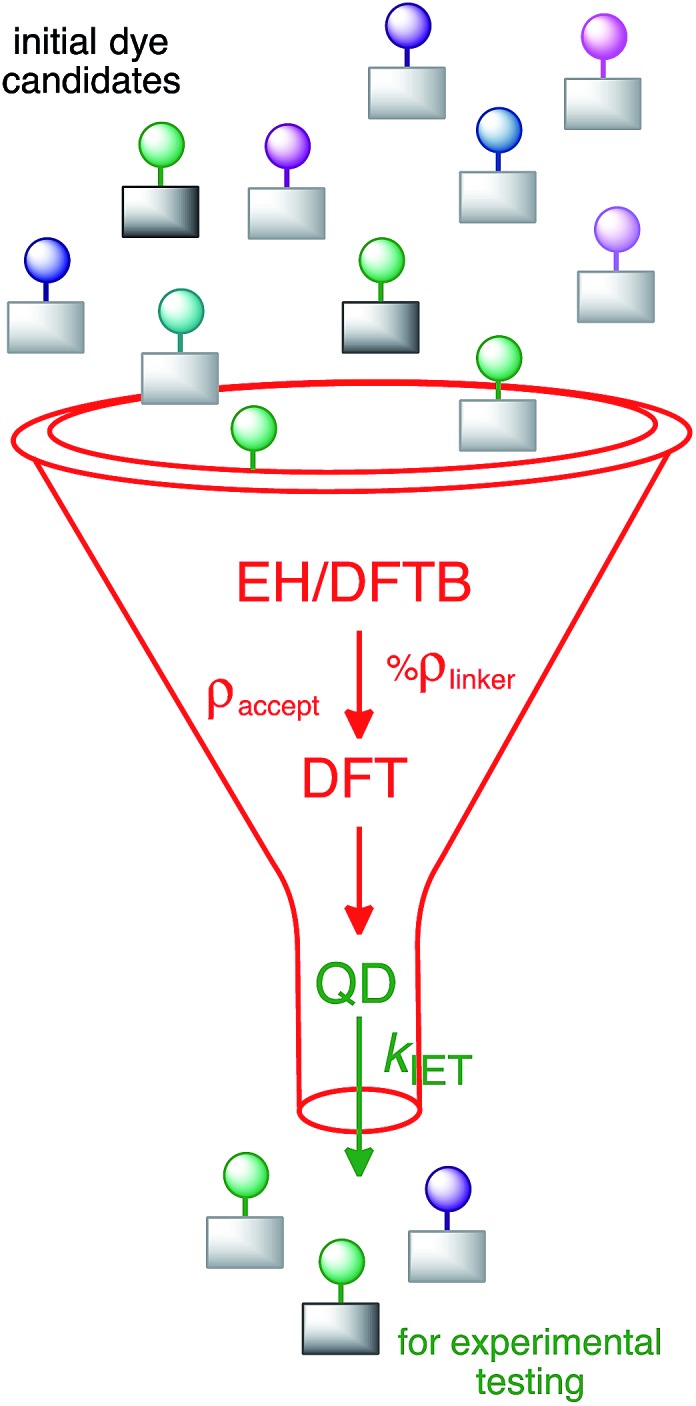
The parameters with the highest influence on the initial IET characteristic time, %ρ linker and ρ accept, can be obtained from relatively simple electronic structure calculations on dye–semiconductor assemblies utilizing properly parameterized tight-binding methods such as DFTB and EH. Their determination will allow the ranking of dye-sensitizers by the efficiency of the initial IET process without the need to perform costly quantum dynamics simulations. After screening dyes utilizing tight binding methods, more accurate DFT calculations may be carried out to obtain refined geometries, electronic coupling constants, the number of available acceptor states, the driving force, or even the lifetime broadening, in order to screen out dyes with slow initial IET rates. As the correlation between the overall IET rate and the identified properties is weak, such pre-screening will need to be followed by quantum dynamics simulations, allowing one to identify dye–nanoparticle assemblies with the most efficient IET (see Fig. 13). This strategy can thus be employed for computational screening of a large number of candidates for dyes in DSSCs.
Fig. 13. Suggested screening process for dye-sensitizers.
Finally, it is important to note that the proposed screening procedure will only identify dye–nanoparticle assemblies with an efficient IET process. While a fast and efficient IET is crucial for the function of a solar cell, the overall DSSC efficiency will depend on many additional factors, such as dye regeneration through interactions with an electrolyte, the rate of back electron transfer, and the ability of the dye to absorb sunlight.82 Therefore, the dye–nanoparticle assemblies identified by our screening procedure will need to be tested further for their suitability based on additional criteria.
Two-step model of the interfacial electron transfer
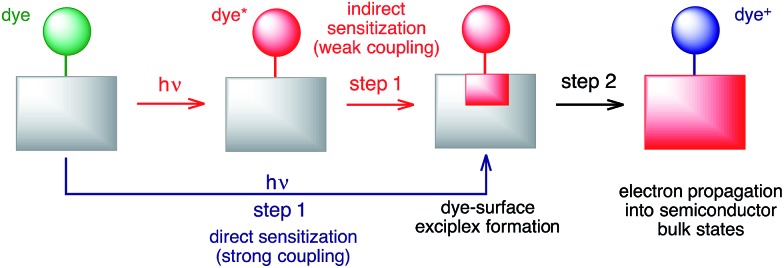
The large discrepancies between the long-term and short-term IET behaviours observed for both the DFT-optimized and MD-sampled structures (see Table 1 and Fig. 9 and 10) are an indication of the multi-step nature of the IET between the excited dye and the semiconductor. Based on our simulations, we propose a two-step model for the IET between the excited dye and the nanoparticle (see Fig. 14), in which the electron is first transferred from the excited dye into the surface states of the nanoparticle localized in the vicinity of the dye attachment site (step 1), followed by the diffusion of the electron wavepacket into the bulk states of the semiconductor (step 2).
Fig. 14. Schematic of the proposed 2-step model for IET.
It is important to emphasize that Fermi’s golden rule, our quantum dynamics simulations, and the proposed model (the red pathway in Fig. 14) assume weak coupling between the excited dye and the nanoparticle surface states. This is not always the case, since in the limit of strong coupling the electron will directly transfer into the surface states of the semiconductor upon excitation,83 creating a dye–surface exciplex as a result of the initial excitation (the blue pathway in Fig. 14). One could argue that due to the large amount of electron density on the linker, the lowest energy excited state that populates the LUMO in pyridine dye will be strongly coupled with the TiO2 nanoparticle. In the strong coupling limit, our quantum dynamics simulations are able to compensate for this problem by populating the surface semiconductor states within the first few femtoseconds of the simulation, so the overall calculated IET rate should not be significantly affected. However, the creation of an initial state in the form of a dye–nanoparticle exciplex would be a more appropriate way to perform such IET simulations. On the other hand, Fermi’s golden rule will be unable to properly describe IET processes due to direct sensitization and will always predict a very fast IET in the strong coupling limit, not accounting for electron propagation into the semiconductor bulk states. Finally, whether the sensitization mechanism is direct or indirect, the dye–surface exciplex will play a role in both IET processes.
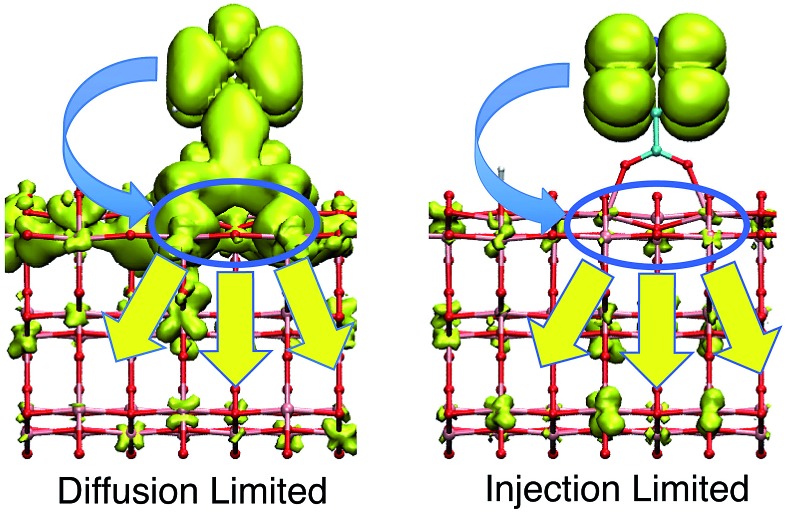
Within the proposed 2-step model, two limiting cases are observed: (1) diffusion limited and (2) injection limited (see Fig. 15). The diffusion limited case is characterized by a large difference between the initial and overall characteristic IET times, τ ≫ τ ini. The rate-limiting step for the IET in this case is the diffusion of the electron from the surface state into the nanoparticle. An example of such a case is the IET from the LUMO initial state in the bidentate attachment mode (see Table 1). In this case, the driving force for the IET is relatively small, as the LUMO lies near the edge of the CB of TiO2, but the electronic coupling between the excited dye and the TiO2 acceptor states is strong, as the initial state has a large amount of electron density on the carboxylic acid linker. As a result, the initial IET rate is very fast (τ ini = 13–16 fs), but there is a bottleneck for the propagation of the injected electron from the surface states into the TiO2 bulk, resulting in an overall IET rate that is several orders of magnitude slower (τ = 1–100 ps).
Fig. 15. Diffusion and injection limited cases of IET.
In the injection limited case, the initial and overall rates have approximately the same order of magnitude (τ ini ≈ τ). Here, the rate-limiting step is the electron transfer from the dye into the semiconductor surface states. An example is the IET from the LUMO+1 initial state in either the monodentate or bidentate attachment mode (see Table 1). In this case, the initial state is situated higher in the CB of TiO2, and the electronic coupling between the excited dye and the semiconductor is weaker. The propagation of the electron in the nanoparticle is either faster than the initial injection, or occurs at approximately the same rate, so the bottleneck for the IET is the initial electron injection from the excited dye into the surface states near the attachment site.
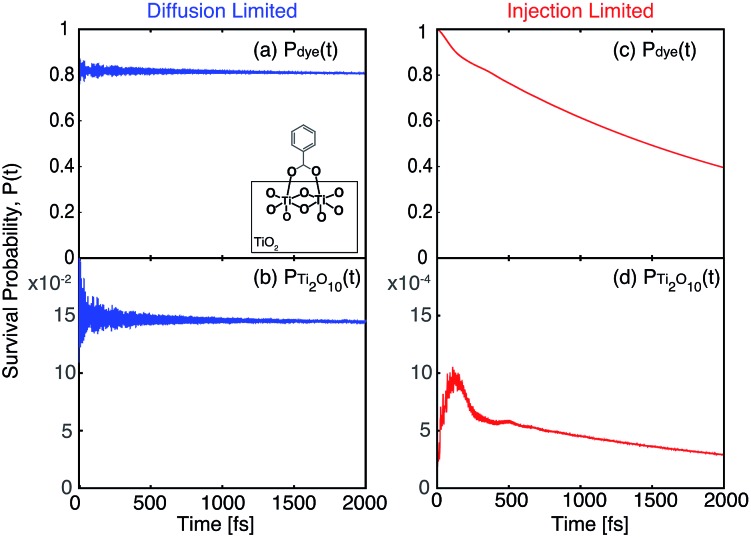
The survival probabilities of the wavepacket on the dye (P dye) and the first surface layer of TiO2 near the dye attachment site (P surface) for one of the diffusion limited cases are shown in Fig. 16a and b. P dye is characterized by a fast initial drop and subsequent slow decay, which is mirrored in the fast initial increase and subsequent decay of P surface. On the other hand, P dye of the injection limited case displays almost single exponential behaviour, with P surface displaying a small build-up of electron density followed by exponential decay (Fig. 16c and d). Note that the maximum build-up of electron density on the surface in the injection limited case is approximately two orders of magnitude smaller than the build-up of electron density in the diffusion limited case, suggesting that electron propagation inside the TiO2 nanoparticle in the injection limited case is fast relative to the initial injection step. As a consequence, the overall rate for the IET in the injection limited case will be described well by Fermi’s golden rule, while that in the diffusion limited case will mainly depend on the properties of the acceptor (surface and bulk) states of the semiconductor.
Fig. 16. Survival probabilities of the dye and Ti2O10 surface cluster directly attached to the dye in the bidentate attachment mode. The survival probabilities for the monodentate case can be found in the ESI, Fig. S7.† .
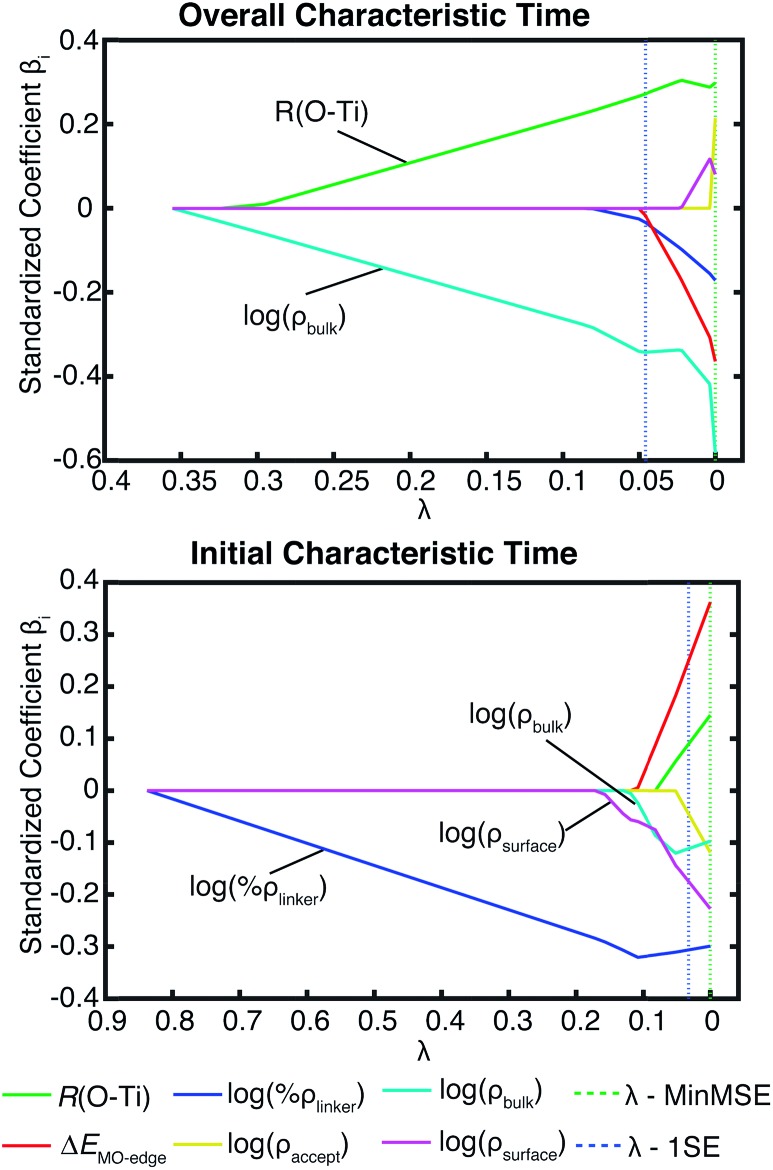
Additional evidence for the two-step model comes from linear regression analysis. Fig. 17 shows the results for the LASSO regression with two additional parameters, acceptor states in the surface region (ρ surface) and the bulk region (ρ bulk). As expected in our two-step model, the acceptor states in the bulk region are the most important parameter for τ, however for τ ini, the states in the surface region are more important than the states in the bulk region. R 2 equals 0.226 for the linear regression of τ vs. [ρ bulk, R(O–Ti)], and 0.803 for τ ini vs. [ρ surface, ρ bulk, ΔEMO-edge, %ρ linker, R(O–Ti)]. For τ, if we use ρ accept instead of ρ bulk, R 2 drops slightly to 0.213. Similarly, for τ ini, if we change ρ bulk and ρ surface to ρ accept, then R 2 drops to 0.795. These results show that we obtain a better description of the IET process by separating the surface part and the bulk part of the TiO2 slab.
Fig. 17. LASSO regression analysis for τ and τini with the original parameter set and number of acceptor states in the surface region (ρ surface) and bulk region (ρ bulk) on TiO2.
Stier and Prezhdo performed IET simulations in a related pyCA–TiO2 rutile assembly utilizing a quantum-classical mean-field approximation with a DFT Hamiltonian.84 In their work, the change in the total electron density on the dye at each time step (a quantity related to the survival probability from our IET simulations) was decomposed into adiabatic and nonadiabatic transfer terms. The calculated trajectories showed a mixture of adiabatic and nonadiabatic behaviour, with the nonadiabatic pathways dominating early in the IET process and both contributions becoming nearly equivalent at later times. The efficiency of the nonadiabatic transfer was also found to depend on the number of semiconductor states localized close to the molecular donor state in terms of both space and energy. Significantly, Stier and Prezhdo’s simulations also exhibited substantial localization of the initial electron acceptor states near the dye attachment site, which is reminiscent of the dye–surface exciplex formation identified in our quantum dynamics simulations. Finally, they suggested that nonadiabatic electron transfer rate expressions, such as Fermi’s golden rule, can be rigorously applied only for the fastest 30% of the electron transfer process. This finding is complementary to our observations that Fermi’s golden rule is most useful for the prediction of initial IET rates.
The multi-step nature of IET was also proposed previously to explain the multi-exponential behaviour of the measured electron injection rates in various dye–semiconductor assemblies.4,50 For example, Furube et al. proposed a two-step model for electron injection in a ZnO nanocrystal sensitized with a [Ru(dcbpy)2(NCS)2] (N3) dye (dcbpy = cis-bis-(4,4′-dicarboxy-2,2′-bipyridine)). In this model, the first step corresponds to the formation of an intermediate state by partial electron transfer from the photoexcited N3 dye into the surface states of the ZnO semiconductor. The intermediate state then relaxes to generate charge carriers (electrons) in the CB of the bulk TiO2.50 A two-step model of the IET in which electrons are first injected into non-mobile TiO2 states (step 1) and subsequently decay into mobile CB states (step 2) was also invoked more recently by Schmuttenmaer and co-workers to explain the discrepancies between the electron injection rates obtained from transient absorbance measurements and those obtained from time-resolved terahertz spectroscopy in Ru(ii)–polypyridine-sensitized TiO2.4 We propose that in principle, every IET process in dye–semiconductor assemblies can be understood in terms of these two steps. Whether or not both steps can be observed experimentally, or need to be considered by a theoretical explanation or incorporated into a computational model of an IET process in a particular dye–semiconductor assembly, will ultimately depend on the relative rates of the injection and diffusion steps.
Conclusions
In this work, a model pyCA–TiO2 assembly was investigated, with the aims of (1) understanding the impact of the conformational flexibility of the pyCA adsorbate at room temperature on the IET process, and (2) evaluating the limits of Fermi’s golden rule description of the IET. The calculated initial and overall IET characteristic times for the sampled room-temperature structures were found to be distributed over a wide range of values. For more than half of the samples, speeding up of both the long-term and short-term IET rates was observed in comparison to the IET rates obtained for the structures optimized at 0 K. To explain the observed distribution of the IET rates, various electronic and structural parameters were examined using a linear regression method. The short-term behaviour was found to be well described by Fermi’s golden rule, with the initial rates highly correlated with the driving force, electronic coupling strength, and density of available acceptor states. On the other hand, the long-term IET behaviour is poorly described in terms of these parameters.
A two-step model was proposed to explain the differences between the calculated long-term and short-term IET rates. An electron in the excited state of the sensitizer is first transferred into the available nanoparticle surface states, creating a dye–surface exciplex (first step, injection). Following this, the wavepacket propagates from the surface into the bulk semiconductor states (second step, diffusion). For initial states that have a large coupling strength but low density of available acceptor states in the nanoparticle bulk, the initial IET rate will be significantly faster than the overall IET rate (e.g., injection from the LUMO initial state in the pyCA–TiO2 assembly). As the overall IET rate is largely determined by the rate of the diffusion step, we call this the “diffusion limited” case. The “injection limited” case, on the other hand, arises when the excited state of the dye displays weak coupling with the TiO2 acceptor states, but is energetically well aligned with the CB of TiO2, resulting in a large density of available TiO2 acceptor states. The overall IET rate in the “injection limited” case is thus determined by the rate of the first injection step. Such behaviour was observed for the IET from the LUMO+1 initial state in the model assemblies investigated in this work.
Finally, the percentage of electron density on the linker group (%ρ linker) and the number of available semiconductor states (ρ accept) were identified as the electronic parameters having the highest correlation with the initial IET rates determined from quantum dynamics simulations. These two parameters can be obtained from relatively simple and straightforward electronic structure calculations at the EH or DFT levels of theory and can be thus utilized to quickly pre-screen a large number of dye-sensitizer candidates. Such pre-screening can then be followed by determination of the overall IET rates from quantum dynamics simulations, with the most viable candidates tested experimentally. The proposed screening process can be used as a practical strategy for the computational design of new dyes for DSSCs that will exhibit fast IET into the semiconductor.
Acknowledgments
We gratefully acknowledge the support from the U.S. Army Research Office under Contract W911NF-15-1-0124. We also acknowledge the use of the computing resources of the High-Performance Computing Centre at NCSU.
Footnotes
References
- Ardo S., Meyer G. J. Chem. Soc. Rev. 2009;38:115–164. doi: 10.1039/b804321n. [DOI] [PubMed] [Google Scholar]
- Hagfeldt A., Boschloo G., Sun L., Kloo L., Pettersson H. Chem. Rev. 2010;110:6595–6663. doi: 10.1021/cr900356p. [DOI] [PubMed] [Google Scholar]
- Martín C., Ziółek M., Douhal A. J. Photochem. Photobiol., C. 2016;26:1–30. [Google Scholar]
- Swierk J. R., McCool N. S., Nemes C. T., Mallouk T. E., Schmuttenmaer C. A. J. Phys. Chem. C. 2016;120:5940–5948. doi: 10.1021/acs.jpclett.6b01528. [DOI] [PubMed] [Google Scholar]
- Brennaman M. K., Dillon R. J., Alibabaei L., Gish M. K., Dares C. J., Ashford D. L., House R. L., Meyer G. J., Papanikolas J. M., Meyer T. J. J. Am. Chem. Soc. 2016;138:13085–13102. doi: 10.1021/jacs.6b06466. [DOI] [PubMed] [Google Scholar]
- House R. L., Iha N. Y. M., Coppo R. L., Alibabaei L., Sherman B. D., Kang P., Brennaman M. K., Hoertz P. G., Meyer T. J. J. Photochem. Photobiol., C. 2015;25:32–45. [Google Scholar]
- Nitzan A. Annu. Rev. Phys. Chem. 2001;52:681–750. doi: 10.1146/annurev.physchem.52.1.681. [DOI] [PubMed] [Google Scholar]
- Anderson N. A., Lian T. Annu. Rev. Phys. Chem. 2005;56:491–519. doi: 10.1146/annurev.physchem.55.091602.094347. [DOI] [PubMed] [Google Scholar]
- Anderson N. A., Lian T. Coord. Chem. Rev. 2004;248:1231–1246. [Google Scholar]
- Akimov A. V., Neukirch A. J., Prezhdo O. V. Chem. Rev. 2013;113:4496–4565. doi: 10.1021/cr3004899. [DOI] [PubMed] [Google Scholar]
- Le Bahers T., Pauporté T., Lainé P. P., Labat F., Adamo C., Ciofini I. J. Phys. Chem. Lett. 2013;4:1044–1050. doi: 10.1021/jz400046p. [DOI] [PubMed] [Google Scholar]
- De Angelis F., Di Valentin C., Fantacci S., Vittadini A., Selloni A. Chem. Rev. 2014;114:9708–9753. doi: 10.1021/cr500055q. [DOI] [PubMed] [Google Scholar]
- Wang L., Long R., Prezhdo O. V. Annu. Rev. Phys. Chem. 2015;66:549–579. doi: 10.1146/annurev-physchem-040214-121359. [DOI] [PubMed] [Google Scholar]
- Hagfeldt A., Graetzel M. Chem. Rev. 1995;95:49–68. [Google Scholar]
- Kamat P. V. Chem. Rev. 1993;93:267–300. [Google Scholar]
- Ashley D. C., Jakubikova E. Coord. Chem. Rev. 2017;337:97–111. [Google Scholar]
- Gao Y. Q., Georgievskii Y., Marcus R. A. J. Chem. Phys. 2000;112:3358–3369. [Google Scholar]
- Gao Y. Q., Marcus R. A. J. Chem. Phys. 2000;113:6351. [Google Scholar]
- Gosavi S., Marcus R. A. J. Phys. Chem. B. 2000;104:2067–2072. [Google Scholar]
- Asbury J. B., Wang Y. Q., Lian T. Q. J. Phys. Chem. B. 1999;103:6643–6647. [Google Scholar]
- Asbury J. B., Hao E., Wang Y. Q., Ghosh H. N., Lian T. Q. J. Phys. Chem. B. 2001;105:4545–4557. [Google Scholar]
- Asbury J. B., Anderson N. A., Hao E. C., Ai X., Lian T. Q. J. Phys. Chem. B. 2003;107:7376–7386. [Google Scholar]
- Labat F., Le Bahers T., Ciofini I., Adamo C. Acc. Chem. Res. 2012;45:1268–1277. doi: 10.1021/ar200327w. [DOI] [PubMed] [Google Scholar]
- Labat F., Ciofini I., Hratchian H. P., Frisch M., Raghavachari K., Adamo C. J. Am. Chem. Soc. 2009;131:14290–14298. doi: 10.1021/ja902833s. [DOI] [PubMed] [Google Scholar]
- Persson P., Lunell S., Ojamäe L. Chem. Phys. Lett. 2002;364:469–474. [Google Scholar]
- Pimachev A., Kolesov G., Chen J., Wang W., Dahnovsky Y. J. Chem. Phys. 2012;137:244704. doi: 10.1063/1.4772742. [DOI] [PubMed] [Google Scholar]
- Kilin D. S., Micha D. A. J. Phys. Chem. C. 2009;113:3530–3542. [Google Scholar]
- Rashwan K., Sereda G., Kilin D. Mol. Phys. 2015;114:1–11. [Google Scholar]
- Rego L. G. C., Batista V. S. J. Am. Chem. Soc. 2003;125:7989–7997. doi: 10.1021/ja0346330. [DOI] [PubMed] [Google Scholar]
- Abuabara S. G., Rego L. G., Batista V. S. J. Am. Chem. Soc. 2005;127:18234–18242. doi: 10.1021/ja055185u. [DOI] [PubMed] [Google Scholar]
- Abuabara S. G., Cady C. W., Baxter J. B., Schmuttenmaer C. A., Crabtree R. H., Brudvig G. W., Batista V. S. J. Phys. Chem. C. 2007;111:11982–11990. [Google Scholar]
- McNamara W. R., Snoeberger R. C., Li G., Schleicher J. M., Cady C. W., Poyatos M., Schmuttenmaer C. A., Crabtree R. H., Brudvig G. W., Batista V. S. J. Am. Chem. Soc. 2008;130:14329–14338. doi: 10.1021/ja805498w. [DOI] [PubMed] [Google Scholar]
- Jakubikova E., Chen W., Dattelbaum D. M., Rein F. N., Rocha R. C., Martin R. L., Batista E. R. Inorg. Chem. 2009;48:10720–10725. doi: 10.1021/ic901477m. [DOI] [PubMed] [Google Scholar]
- Jakubikova E., Snoeberger III R. C., Batista V. S., Martin R. L., Batista E. R. J. Phys. Chem. A. 2009;113:12532–12540. doi: 10.1021/jp903966n. [DOI] [PubMed] [Google Scholar]
- Li G., Richter C. P., Milot R. L., Cai L., Schmuttenmaer C. A., Crabtree R. H., Brudvig G. W., Batista V. S. Dalton Trans. 2009:10078–10085. doi: 10.1039/b908686b. [DOI] [PubMed] [Google Scholar]
- Jakubikova E., Martin R. L., Batista E. R. Inorg. Chem. 2010;49:2975–2982. doi: 10.1021/ic902504y. [DOI] [PubMed] [Google Scholar]
- Brewster T. P., Konezny S. J., Sheehan S. W., Martini L. A., Schmuttenmaer C. A., Batista V. S., Crabtree R. H. Inorg. Chem. 2013;52:6752–6764. doi: 10.1021/ic4010856. [DOI] [PubMed] [Google Scholar]
- Monti A., Negre C. F. A., Batista V. S., Rego L. G. C., de Groot H. J. M., Buda F. J. Phys. Chem. Lett. 2015;6:2393–2398. doi: 10.1021/acs.jpclett.5b00876. [DOI] [PubMed] [Google Scholar]
- Bowman D. N., Blew J. H., Tsuchiya T., Jakubikova E. Inorg. Chem. 2013;52:14449. doi: 10.1021/ic4007839. [DOI] [PubMed] [Google Scholar]
- Bowman D. N., Blew J. H., Tsuchiya T., Jakubikova E. Inorg. Chem. 2013;52:8621–8628. doi: 10.1021/ic4007839. [DOI] [PubMed] [Google Scholar]
- Bowman D. N., Mukherjee S., Barnes L. J., Jakubikova E. J. Phys.: Condens. Matter. 2015;27:134205. doi: 10.1088/0953-8984/27/13/134205. [DOI] [PubMed] [Google Scholar]
- Jakubikova E., Bowman D. N. Acc. Chem. Res. 2015;48:1441–1449. doi: 10.1021/ar500428t. [DOI] [PubMed] [Google Scholar]
- Mukherjee S., Bowman D. N., Jakubikova E. Inorg. Chem. 2015;54:560–569. doi: 10.1021/ic502438g. [DOI] [PubMed] [Google Scholar]
- Torres A., Oliboni R. S., Rego L. G. C. J. Phys. Chem. Lett. 2015;6:4927–4935. doi: 10.1021/acs.jpclett.5b02191. [DOI] [PubMed] [Google Scholar]
- Hoff D. A., da Silva R., Rego L. G. C. J. Phys. Chem. C. 2012;116:21169–21178. [Google Scholar]
- High J. S., Rego L. G., Jakubikova E. J. Phys. Chem. A. 2016;120:8075–8084. doi: 10.1021/acs.jpca.6b05739. [DOI] [PubMed] [Google Scholar]
- Hoff D. A., Silva R., Rego L. G. C. J. Phys. Chem. C. 2011;115:15617–15626. [Google Scholar]
- Rego L. G. C., Hames B. C., Mazon K. T., Joswig J.-O. J. Phys. Chem. C. 2014;118:126–134. [Google Scholar]
- Jiang J., Swierk J. R., Hedstrom S., Matula A. J., Crabtree R. H., Batista V. S., Schmuttenmaer C. A., Brudvig G. W. Phys. Chem. Chem. Phys. 2016;18:18678–18682. doi: 10.1039/c6cp04377a. [DOI] [PubMed] [Google Scholar]
- Furube A., Katoh R., Hara K., Murata S., Arakawa H., Tachiya M. J. Phys. Chem. B. 2003;107:4162–4166. doi: 10.1021/jp0513263. [DOI] [PubMed] [Google Scholar]
- Kresse G., Furthmüller J. Phys. Rev. B: Condens. Matter Mater. Phys. 1996;54:11169–11186. doi: 10.1103/physrevb.54.11169. [DOI] [PubMed] [Google Scholar]
- Kresse G., Furthmüller J. Comput. Mater. Sci. 1996;6:15–50. [Google Scholar]
- Kresse G., Hafner J. Phys. Rev. B: Condens. Matter Mater. Phys. 1994;49:14251–14269. doi: 10.1103/physrevb.49.14251. [DOI] [PubMed] [Google Scholar]
- Kresse G., Hafner J. Phys. Rev. B: Condens. Matter Mater. Phys. 1993;47:558–561. doi: 10.1103/physrevb.47.558. [DOI] [PubMed] [Google Scholar]
- Perdew J. P., Burke K., Ernzerhof M. Phys. Rev. Lett. 1997;78:1396. doi: 10.1103/PhysRevLett.77.3865. [DOI] [PubMed] [Google Scholar]
- Perdew J. P., Burke K., Ernzerhof M. Phys. Rev. Lett. 1996;77:3865–3868. doi: 10.1103/PhysRevLett.77.3865. [DOI] [PubMed] [Google Scholar]
- Blochl P. E. Phys. Rev. B: Condens. Matter Mater. Phys. 1994;50:17953–17979. doi: 10.1103/physrevb.50.17953. [DOI] [PubMed] [Google Scholar]
- Kresse G., Joubert D. Phys. Rev. B: Condens. Matter Mater. Phys. 1999;59:1758–1775. [Google Scholar]
- Jensen K. P., Roos B. O., Ryde U. J. Chem. Phys. 2007;126:014103. doi: 10.1063/1.2406071. [DOI] [PubMed] [Google Scholar]
- Weng Y.-X., Li L., Liu Y., Wang L., Yang G.-Z. J. Phys. Chem. B. 2003;107:4356–4363. [Google Scholar]
- Deacon G. B., Phillips R. J. Coord. Chem. Rev. 1980;33:227–250. [Google Scholar]
- Murakoshi K., Kano G., Wada Y., Yanagida S., Miyazaki H., Matsumoto M., Murasawa S. J. Electroanal. Chem. 1995;396:27–34. [Google Scholar]
- Nazeeruddin M. K., Humphry-Baker R., Officer D. L., Campbell W. M., Burrell A. K., Grätzel M. Langmuir. 2004;20:6514–6517. doi: 10.1021/la0496082. [DOI] [PubMed] [Google Scholar]
- Nazeeruddin M. K., Humphry-Baker R., Liska P., Grätzel M. J. Phys. Chem. B. 2003;107:8981–8987. [Google Scholar]
- Ambrosio F., Martsinovich N., Troisi A. J. Phys. Chem. Lett. 2012;3:1531–1535. doi: 10.1021/jz300520p. [DOI] [PubMed] [Google Scholar]
- Aradi B., Hourahine B., Frauenheim T. J. Phys. Chem. A. 2007;111:5678–5684. doi: 10.1021/jp070186p. [DOI] [PubMed] [Google Scholar]
- Elstner M., Porezag D., Jungnickel G., Elsner J., Haugk M., Frauenheim T., Suhai S., Seifert G. Phys. Rev. B: Condens. Matter Mater. Phys. 1998;58:7260–7268. [Google Scholar]
- Dolgonos G., Aradi B., Moreira N. H., Frauenheim T. J. Chem. Theory Comput. 2010;6:266–278. doi: 10.1021/ct900422c. [DOI] [PubMed] [Google Scholar]
- Hoover W. G. Phys. Rev. A. 1985;31:1695–1697. doi: 10.1103/physreva.31.1695. [DOI] [PubMed] [Google Scholar]
- Nosé S. J. Chem. Phys. 1984;81:511–519. [Google Scholar]
- Hoffmann R. J. Chem. Phys. 1964;40:2480–2488. [Google Scholar]
- Hoffmann R. J. Chem. Phys. 1964;40:2474–2480. [Google Scholar]
- Hoffmann R. J. Chem. Phys. 1964;40:2745. [Google Scholar]
- Hoffmann R. J. Chem. Phys. 1963;39:1397–1412. [Google Scholar]
- Frisch M. J., Trucks G. W., Schlegel H. B., Scuseria G. E., Robb M. A., Cheeseman J. R., Scalmani G., Barone V., Mennucci B. and Petersson G. A., et al., Gaussian, Inc., Wallingford, CT, USA, 2009.
- Alvarez S., Tables of Parameters for Extended Hückel Calculations, Universidad de Barcelona, 1999. [Google Scholar]
- Landrum G. A. and Glassey W. V., Yet Another extended Hückel Molecular Orbital Package (YAeHMOP) Version 3.0, 2006.
- Lundqvist M. J., Nilsing M., Persson P., Lunell S. Int. J. Quantum Chem. 2006;106:3214–3234. [Google Scholar]
- Lin H., Fratesi G., Selçuk S., Brivio G. P., Selloni A. J. Phys. Chem. C. 2016;120:3899–3905. [Google Scholar]
- Nilsing M., Persson P., Ojamäe L. Chem. Phys. Lett. 2005;415:375–380. [Google Scholar]
- She C., Guo J., Irle S., Morokuma K., Mohler D. L., Zabri H., Odobel F., Youm K.-T., Liu F., Hupp J. T. J. Phys. Chem. A. 2007;111:6832–6842. doi: 10.1021/jp0709003. [DOI] [PubMed] [Google Scholar]
- Ip C. M., Eleuteri A., Troisi A. Phys. Chem. Chem. Phys. 2014;16:19106–19110. doi: 10.1039/c4cp03124e. [DOI] [PubMed] [Google Scholar]
- Yang M., Thompson D. W., Meyer G. J. Inorg. Chem. 2000;39:3738–3739. doi: 10.1021/ic000415l. [DOI] [PubMed] [Google Scholar]
- Stier W., Prezhdo O. V. J. Phys. Chem. B. 2002;106:8047–8054. [Google Scholar]
Associated Data
This section collects any data citations, data availability statements, or supplementary materials included in this article.


