Abstract
Key points
Heat associated with muscle shortening has been repeatedly demonstrated in skeletal muscle, but its existence in cardiac muscle remains contentious after five decades of study.
By iterating between experiments and computational modelling, we show compelling evidence for the existence of shortening heat in cardiac muscle and reveal, mechanistically, the source of this excess heat.
Our results clarify a long‐standing uncertainty in the field of cardiac muscle energetics.
We provide a revised partitioning of cardiac muscle energy expenditure to include this newly revealed thermal component.
Abstract
When a muscle shortens against an afterload, the heat that it liberates is greater than that produced by the same muscle contracting isometrically at the same level of force. This excess heat is defined as ‘shortening heat’, and has been repeatedly demonstrated in skeletal muscle but not in cardiac muscle. Given the micro‐structural similarities between these two muscle types, and since we imagine that shortening heat is the thermal accompaniment of cross‐bridge cycling, we have re‐examined this issue. Using our flow‐through microcalorimeter, we measured force and heat generated by isolated rat trabeculae undergoing isometric contractions at different muscle lengths and work‐loop (shortening) contractions at different afterloads. We simulated these experimental protocols using a thermodynamically constrained model of cross‐bridge cycling and probed the mechanisms underpinning shortening heat. Predictions generated by the model were subsequently validated by a further set of experiments. Both our experimental and modelling results show convincing evidence for the existence of shortening heat in cardiac muscle. Its magnitude is inversely related to the afterload or, equivalently, directly related to the extent of shortening. Computational simulations reveal that the heat of shortening arises from the cycling of cross‐bridges, and that the rate of ATP hydrolysis is more sensitive to change of muscle length than to change of afterload. Our results clarify a long‐standing uncertainty in the field of cardiac muscle energetics.
Keywords: cardiac energetics, cross‐bridge model, partitioning heat
Key points
Heat associated with muscle shortening has been repeatedly demonstrated in skeletal muscle, but its existence in cardiac muscle remains contentious after five decades of study.
By iterating between experiments and computational modelling, we show compelling evidence for the existence of shortening heat in cardiac muscle and reveal, mechanistically, the source of this excess heat.
Our results clarify a long‐standing uncertainty in the field of cardiac muscle energetics.
We provide a revised partitioning of cardiac muscle energy expenditure to include this newly revealed thermal component.
Introduction
The first unequivocal demonstration of shortening heat in muscle was performed by Fenn (1923), although he referenced comparable work published decades earlier by his predecessors, Heidenhan and Fick. What has come to be known as the ‘Fenn effect’ was the demonstration that tetanically contracting skeletal muscle, released to shorten at fixed afterload, produces heat at a rate in excess of the steady‐state peak isometric heat rate. Fenn's results were unequivocally demonstrated, and extended, by Fischer using measurements of heat (Fischer, 1928) and oxygen consumption (Fischer, 1931).
The concept of shortening heat was further legitimised when a component of heat attributable to shortening arose naturally from A. F. Huxley's (1957) mathematical model of skeletal muscle contraction (perhaps unsurprisingly since the model was fitted to Hill's data). Nevertheless, Hill's laboratory continued their experimental investigations of shortening heat in both twitches (Hill, 1949) and tetani (Abbott, 1951). The latter paper features a clear distinction between the heat of shortening and the energy cost of performing work against the load during shortening – a distinction that had not always been clear previously and was often to be unclear subsequently.
Until this point, and with only a single exception (Fischer, 1931), heat had been the dependent variable of interest. But that changed when Mommaerts et al. (1962) determined the extent of breakdown of phosphocreatine (ΔPCr) during isotonic contractions of frog sartorius muscles. These authors found no evidence for an increase of metabolism during shortening but attributed this result to the obscuring effect of length‐dependent activation. Using similar techniques, Carlson et al. (1963) corroborated their null results. Perhaps the most comprehensive early undertakings was that of Chaplain (1972), who chose to study the frog rectus abdominus muscle preparation. He measured ΔPCr, in addition to work (W) and heat production (Q), at six different extents of shortening. The results were remarkably consistent among preparations and in accord with the first law of thermodynamics:
| (1) |
That is, the sum of heat plus work gives the change in enthalpy (ΔH; 10.85 (μmol ΔPCr)−1), which was in excellent quantitative agreement with the value of 11 kcal (μmol ΔPCr)−1 previously reported by Wilkie (1968). Regrettably, Chaplain could not have known that Wilkie's value was in error and would later be corrected from its SI equivalent of 44 kJ mol−1 to 34 kJ mol−1 by Woledge & Reilly (1988). Applying this correction, it can be seen that heat plus work exceeded the enthalpy of PCr hydrolysis; ergo: shortening heat.
Spurred by A. V. Hill's ‘challenge to biochemists’ (Hill, 1950), the following decades saw intense activity in the field. Experiments continued to be performed, commonly using frog sartorius muscles, and with heat measurements accompanied by biochemical assays of ΔATP and ΔPCr increasingly measured. Thus it was demonstrated that shortening heat (i) occurs in twitches, as well as in tetani (Homsher & Rall, 1973), (ii) appears during a brief period of shortening within an ‘interrupted tetanus’ (Irving et al. 1979), (iii) is dependent on the extent of shortening, a phenomenon that could be adequately described by a simple two‐state model (Irving & Woledge, 1981), (iv) varies with the extent of activation (as modulated by stimulus frequency; Buschman et al. 1996, 1997) and (v) is dependent on the velocity of shortening (Yamada & Homsher, 1984; Homsher & Yamada, 1988).
It is clear that shortening heat is a well‐documented phenomenon in skeletal muscle. The situation is much less clear in cardiac muscle. Gibbs et al. (1967) and Gibbs & Gibson (1970) presented the first evidence that appeared to be consistent with the phenomenon using measurements of heat production in rat right‐ventricular (RV) papillary muscle. However, the authors were at pains to emphasise its inconclusiveness because they could not directly attribute the excess heat measured in isotonic contractions specifically to the process of muscle shortening. Indeed, Pool et al. (1968) found no evidence of shortening metabolism (ΔATP or ΔPCr) in cat RV papillary muscles nor did either Coleman et al. (1969), using the same preparation, or Weber & Janicki (1977) measuring the oxygen consumption of the isolated canine heart.
Holroyd & Gibbs (1992) later revisited the issue by comparing heat output between the ‘shortening heat protocol’ (Rall, 1978) and the ‘latency release technique’ (Gibbs et al. 1988). They showed that the shortening heat protocol produced heat in excess of the latency release technique, but the excess heat was independent of the extent of shortening, leading them to conclude that there was no evidence of shortening heat in cardiac muscle. Adding legitimacy to their methodology, they convincingly showed the existence of shortening heat in both fast‐twitch and slow‐twitch hindlimb muscles of the rat (Holroyd et al. 1996). Since that time, the existence of shortening heat in cardiac muscle seems not to have been further investigated, leaving the field in the curious situation that shortening heat is present in skeletal muscle but not in cardiac muscle, despite their micro‐structural similarities.
Since it must be imagined that shortening heat is the thermal accompaniment of cross‐bridge cycling, and its attendant thermogenic ATP hydrolysis, we undertook a re‐examination of the issue. The motivation for this study is best encapsulated by this quote from Gibbs et al. (1967): ‘The present results show that in an isotonic contraction there is heat additional to that expected from the heat/tension plot. We have not shown, however, that this heat is liberated during the period of shortening and clearly this fact must be demonstrated before the additional heat can be unequivocally called shortening heat’. We did so using two independent approaches. Firstly, we quantified heat in isolated preparations of left ventricular trabeculae carneae from the rat under two protocols: isometric contraction and afterloaded work‐loop contractions, where the muscle undergoes a period of isotonic shortening. Secondly, experimental findings were complemented by predictions of cross‐bridge ATP hydrolysis from a thermodynamically constrained, mathematical model of cardiac muscle mechano‐energetics (Tran et al. 2010). We exploited the difference of heat‐load relations between isometric and work‐loop contractions, while ensuring that comparisons were performed at the same peak force, as first advocated by Mommaerts (1969).
Methods
Experimental
All experiments were conducted in accord with protocols approved by the University of Auckland Ethics Committee (R925 and R1341). Each rat was deeply anaesthetised with isofluorane (5% in O2) and injected with heparin (1000 IU kg−1). Following cervical dislocation, the heart and lungs were excised and quickly placed into chilled Tyrode solution. The aorta was immediately cannulated for Langendorff perfusion with low‐Ca2+ Tyrode solution (in mmol l−1: 130 NaCl, 6 KCl, 1 MgCl2, 0.5 NaH2PO4, 0.3 CaCl2, 10 Hepes, 10 glucose; 20 2,3‐butanedione monoxime, pH adjusted to 7.4 by addition of Tris), and vigorously gassed with 100% O2 at room temperature.
Trabeculae were dissected from the left ventricles of 14‐ to 16‐week‐old male Sprague–Dawley rats (400–600 g) and mounted in a flow‐through microcalorimeter at 32°C, as previously described (Han et al. 2009; Taberner et al. 2011). Trabeculae (n = 15) of sufficiently small diameter (0.22 ± 0.02 mm) were used to obviate the risk of diffusion‐limited delivery of molecular oxygen to their central cores (Han et al. 2011). In the calorimeter, the trabecula was superfused with normal Tyrode solution (composition as listed above except for a higher concentration of CaCl2: 1.5 mmol l−1 and without 2,3‐butanedione monoxime). Briefly, the rate of heat production of the trabecula was calculated from the product of the flow of superfusate bathing the muscle and the difference of temperature between downstream and upstream thermopile sensors. A choice between isometric contractions at variable muscle lengths and work‐loop contractions at variable afterloads was made using custom‐written software and achieved using custom‐built hardware.
After a period (commonly about 1 h) of continuous 3 Hz electrical stimulation, during which mechanical performance of the trabecula and thermal equilibration of the apparatus were established, the preparation was slowly lengthened until active twitch force was optimal (L o). It was then subjected to a series of isotonic contractions at progressively diminishing afterloads, thereby performing a series of work‐loops. Subsequently, it was required to undergo isometric contractions at progressively diminishing muscle lengths. The rate of heat production (kW) was measured simultaneously and subsequently converted to heat (kJ) by dividing by the stimulus frequency. Twitch heat during both isometric and work‐loop contractions was calculated and plotted as functions of afterload (Tran et al. 2016). The difference in the heat output between these two modes of contraction was defined as the shortening heat.
We later performed a series of experiments (n = 4) in response to a prediction generated by the mathematical model. In these experiments, series of work‐loop contractions were executed commencing at optimal muscle length and two suboptimal muscle lengths: 0.95L o and 0.90L o. These experiments were performed at 37°C and 4 Hz stimulation frequency in the same flow‐through microcalorimeter but upgraded to have a 10‐fold higher thermal resolution (Johnston et al. 2015; Taberner et al. 2015).
The average heat‐stress relations for the muscles (n = 15 and n = 4) were obtained using linear regression analysis implemented within the random coefficient (covariance) procedure (Proc Mixed module) of the SAS statistical software package (SAS Institute, Cary, NC, USA).
Mathematical modelling
The model of cross‐bridge mechano‐energetics developed in this study is based on the Tran et al. (2010) model of cross‐bridge kinetics. Tran et al. (2010) extended the Rice et al. (2008) mean‐field model of Ca2+ activation and cross‐bridge kinetics to be thermodynamically constrained and to embed metabolite binding and unbinding steps into the cross‐bridge cycle. The current model is a four‐state model consisting of a non‐permissive state (NXB), a permissive state (PXB), a state where the myosin head has just bound but has yet to undergo the power stroke (XBPreR) and a state after the power stroke has been undertaken (XBPostR). During diastole, the cross‐bridges are held in the NXB state. Upon activation by Ca2+, cross‐bridges can transition to PXB and enter the cross‐bridge cycle where the binding and unbinding of myosin heads generates active force development. Force is generated when the cross‐bridge is in either of the two bound states (XBPreR, XBPostR) and, for each state, active force is given by a product of the fractional occupancy and the distortion experienced by the myosin head. The total active force is proportional to the sum of the forces generated by these two states.
The parameter governing the dependence of cross‐bridge detachment on the shortening velocity (σp = 0.1) was modified to ensure that the enthalpy–load relationship was positive, as is observed in cardiac muscle (Gibbs et al. 1967; Han et al. 2012, 2014; Tran et al. 2016). The model assumes a 1:1 stoichiometry between the rate of cross‐bridge cycling and the rate of ATP hydrolysis, i.e. for each loop of the cycle, 1 MgATP is consumed. The rate of cross‐bridge cycling, v cycle, is defined as the rate of transition of cross‐bridges from state XBPostR to PXB, where detachment occurs:
| (2) |
In this expression, is the detachment rate constant, which is dependent on MgATP and MgADP, and is the reverse rate constant. The rate of ATP consumption, J XB, is given by:
| (3) |
where ρXB is the density of cross‐bridges, φXB is the number of ATP consumed per cross‐bridge cycle and SOV is the single overlap fraction. The total ATP consumed per twitch is given by the time integral over which the cross‐bridge is cycling:
| (4) |
where t 1 and t 2 represent the start and end times, respectively, of a twitch. ATPXB represents the total enthalpy per twitch.
Isometric contractions were simulated by holding sarcomere length constant during activation by the Ca2+ transient. Work‐loop contractions were simulated in four phases, mimicking the protocol that was imposed on the muscle by the work‐loop calorimeter (Taberner et al. 2011). The first phase is isometric force development where the muscle length is held constant at an initial length while the active force developed by the muscle climbs toward a specified afterload that had been previously set by the user. Upon reaching the afterload, the muscle enters an isotonic shortening phase where it shortens against the afterload. Once the muscle can no longer continue to shorten, end‐systole is reached and the muscle enters the diastolic phase where its length is held constant while the muscle relaxes. In the last phase, muscle length is restored by stretching it back to its initial length along its passive force trajectory. The passive force component of the model was fitted to our experimental trabeculae data using a third‐order polynomial.
In these simulations, the concentrations of cytosolic metabolites were held constant. A single Ca2+ transient profile was used to drive the activation of cross‐bridge cycling for all simulations. The mathematical formulation of the Ca2+ transient profile is detailed in Rice et al. (2008) and the parameters were as follows: τ1 = 20 ms, τ2 = 33 ms, Caamplitude = 1.5 μm, Cadiastolic = 0.09 μm and t start = 50 ms. Computational code for the cross‐bridge model is available from the Physiome model repository: https://models.cellml.org/workspace/4a2
Results
Experimental
A typical experimental record for stress and heat from a trabecula as a function of time is depicted in Fig. 1. In the work‐loop protocol, muscle heat production was highest during isometric contractions at L o and fell progressively with decreasing afterloads. In the isometric protocol, the heat production fell progressively with decreasing muscle length.
Figure 1. Experimental records of the measured stress (force per cross‐sectional area) and heat from a trabecula.
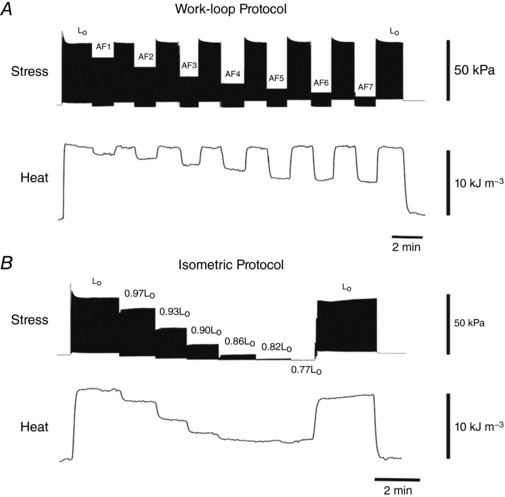
A, stress and heat for a trabecula undergoing a series of work‐loop contractions at progressively diminishing afterloads (AF1–AF7). All work‐loop contractions commence from optimal length (L o). B, stress and heat for a trabecula undergoing isometric contractions at progressively diminishing muscle lengths. Dimensions of representative trabecula: diameter 0.25 mm, length 2.38 mm.
Figure 2 contrasts representative stress‐time profiles generated by isometric (Fig. 2 A) and work‐loop contractions (Fig. 2 B). The peak isometric twitch force for both protocols was approximately 60 kPa. Note the presence of passive stress (0.18 relative afterload), which limits the minimum afterload at which a work‐loop can be executed (Fig. 2 D). Steady‐state heat production for both isometric and work‐loop contractions, as a function of relative afterload, is displayed for a single representative muscle (Fig. 2 E) and for the average of 15 muscles (Fig. 2 F). The linear regression parameter values are detailed in the figure caption. The progressive divergence of the work‐loop and isometric lines at low afterloads is apparent in both panels. Contrariwise, convergence obtains at a relative afterload of 1.0. The difference between these two lines is the excess heat attributed to the process of muscle shortening, which we define as the heat of shortening. These results show that shortening heat is indeed present in cardiac muscle and increases with decreasing relative afterload; i.e. it is directly proportional to the extent of muscle shortening (Fig. 2 D).
Figure 2. Steady‐state stress development and heat production from same trabecula as in Fig. 1 .
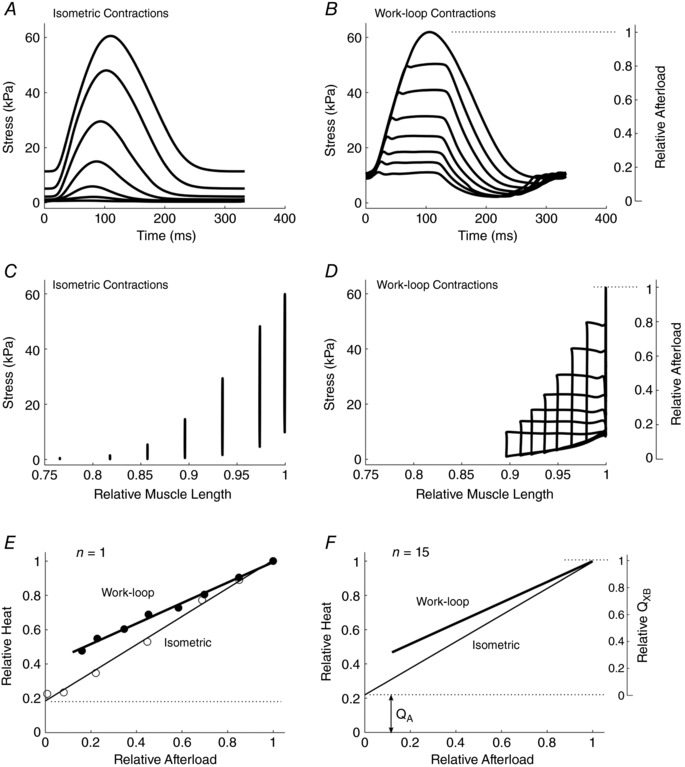
A and B, twitch profiles for isometric (A) and work‐loop (B) contraction protocols. C, isometric twitch stresses at various muscle lengths (relative to optimal length, L o). D, work‐loop contractions against various afterloads commencing from an initial length of L o. E, relative steady‐state twitch heat as functions of relative afterload arising from work‐loop (filled circles and thick line of best fit) and isometric (open circles and thin line of best fit) contractions. F, averaged lines from n = 15 trabeculae. Isometric heat‐stress regression line: Heat = (0.08 ± 0.03)S + (0.22 ± 0.03); and work‐loop heat‐afterload regression line: Heat = (0.08 ± 0.03)S + (0.22 ± 0.03); where S is the relative afterload (means ± SEM). Q A represents the heat associated with activation processes and Q XB represents the heat associated with cross‐bridge cycling.
Mathematical modelling
Simulated mechanical results are presented in Fig. 3. Twitch profiles for isometric contractions at various sarcomere lengths are shown in Fig. 3 A. Figure 3 B shows the equivalent twitch profiles for a series of after‐loaded work‐loop contractions commencing at the optimal initial sarcomere length (SL) of 2.3 μm. Note that the afterloads have been chosen to be identical to the peaks of the isometric twitches shown in Fig. 3 A. The corresponding graphs of stress as a function of relative SL are shown in Fig. 3 C and D, respectively. Note the inability to simulate work‐loops at very low afterloads because of the magnitude of the simulated passive force. This is comparable behaviour to that seen in Fig. 2 D for experimental data. Figure 3 E and F show the corresponding rates of ATP hydrolysis by the cross‐bridges. The relative insensitivity to afterload in the case of work‐loops (Fig. 3 F) vis‐à‐vis that of isometric contractions at various sarcomere lengths (Fig. 3 E) is apparent. In contrast to the experimental data (Fig. 2), the model simulations capture ATP consumption from cross‐bridge cycling only and exclude all other sources of energy expenditure. As a result, the activation heat (Q A) is zero for all model simulations.
Figure 3. Simulated twitches arising from isometric and work‐loop contractions.
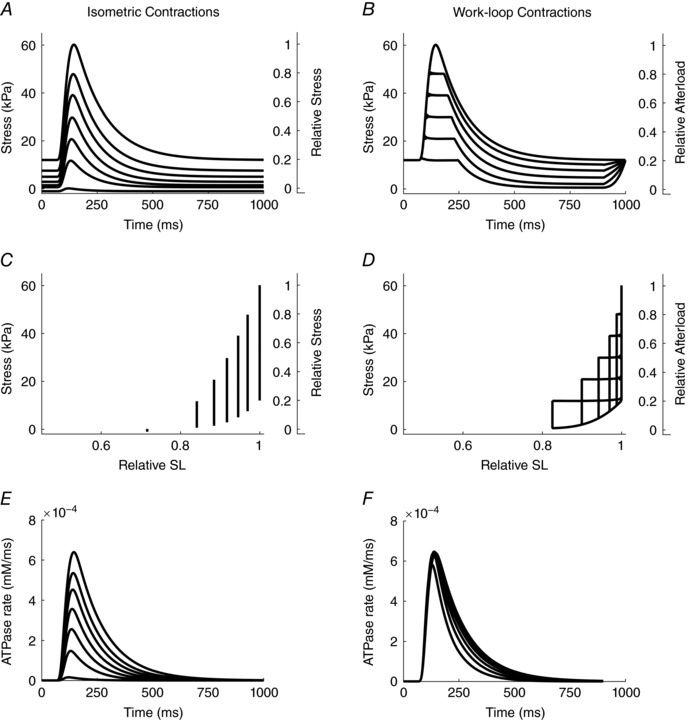
For both twitch protocols, initial sarcomere length is 2.3 μm. A, superimposed isometric contractions commencing at the six relative sarcomere lengths shown in C. B, work‐loop twitches at afterloads chosen to match the peaks of the isometric twitches shown in A. D, work‐loops derived from the temporal profiles shown in B. E and F, simulated time‐dependent rates of ATP hydrolysis by cross‐bridges during isometric twitches (E) and afterloaded isotonic twitches (F). In panels A–D, note re‐casting (right‐hand ordinates) of stress as relative stress for isometric contractions, and relative afterload for work‐loop contractions.
Figure 4 A presents the simulated relative enthalpy output (Eqns (1) and (4)), as a function of relative afterload, for each of the simulated isometric and work‐loop contractions shown in Fig. 3. Note that the normalisation of enthalpy is with respect to its value observed during an isometric contraction at optimal SL, and recall that the model restricts ATP usage to cross‐bridges only. The work component of enthalpy (Eqn (1)) is shown in Fig. 4 B. Subtraction of its value, at each afterload, from the corresponding enthalpy value in Fig. 4 A allows the heat production of work‐loop and isometric contractions to be overlaid in Fig. 4 C. Finally, the numerical difference between the overlaid graphs in Fig. 4 C reveals the afterload dependence of shortening heat as shown in Fig. 4 D.
Figure 4. Simulated components of enthalpy (indexed as cross‐bridge‐dependent ATP hydrolysis) of isometric and work‐loop contractions as functions of relative afterload.
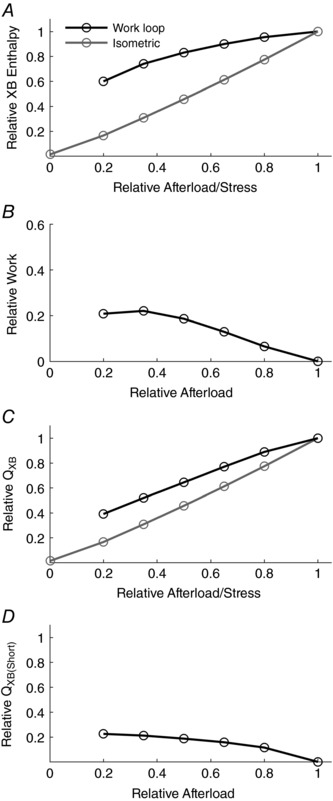
A, enthalpy; B, work; C, heat (the difference between enthalpy and work; Eqn (1)); D, shortening heat (the difference of heat output between work‐loop and isometric contractions, calculated at each relative afterload).
The similarity between the experimental and simulated outputs is noteworthy. In particular, the simulated heat–afterload relationships for both work‐loop and isometric contractions in Fig. 4 C are consistent with the experimental observations presented in Fig. 2 D. Note the absence of Q A in the model simulations. However, each suffers the same limitation: the presence of passive force constrains the lower limit of the afterloads that can be examined, thereby preventing the quantification of shortening heat at even lower afterloads. Linear extrapolation of the work‐loop heat–afterload relation would indicate a higher heat‐intercept compared to its isometric counterpart. Overcoming this limitation experimentally is probably unrealisable. Such is not the case in silico. It is at this juncture that the power of mathematical modelling is exploited. Simulated passive force can readily be set to zero. The results of doing so are displayed in Fig. 5 where each of the four panels corresponds to those in Fig. 3, except that four additional twitches can be simulated at relative afterloads below the previous limit. The contrasting rates of ATP hydrolysis throughout each twitch are shown in Fig. 5 E and F.
Figure 5. Simulated profiles of twitches and stress versus relative sarcomere length, and rates of cross‐bridge ATP hydrolysis arising from isometric and isotonic contractions in the absence of passive force.
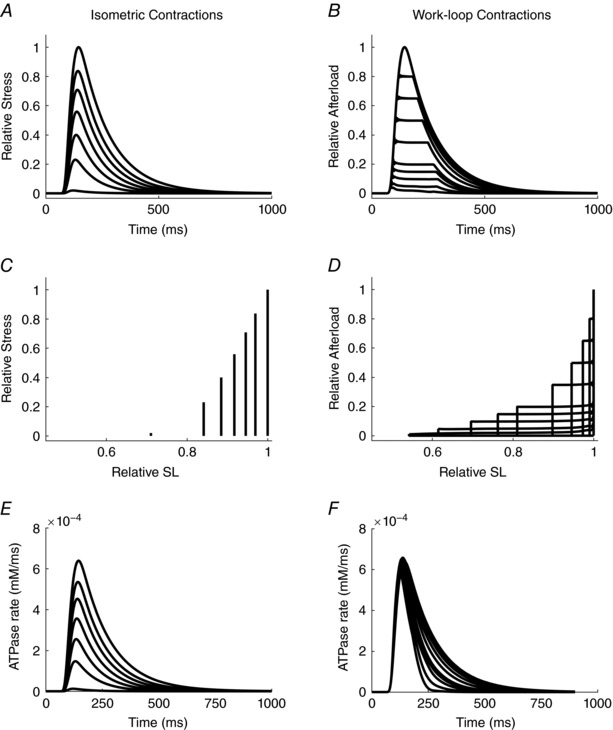
Each panel shows output equivalent to that in the corresponding panels of Fig. 3.
Simulated components of enthalpy are shown in Fig. 6, where each of the panels corresponds to its equivalent in Fig. 4. Several differences are of note. The behaviour of twitch heat (Fig. 6 C) and, as a consequence, calculated shortening heat (Fig. 6 D) in the region of low afterloads, shows a distinct point of inflection. Whereas this result is qualitatively different from that shown in Fig. 2 F for the experimental data if it were to be linearly extrapolated, it must be re‐emphasised that it is not possible to obtain experimental data in the region of very low afterloads, given the steep passive stress–length behaviour of cardiac muscle (Fig. 2 C and D). In any case, simulated shortening heat prevails in both the presence and absence of simulated passive force. Importantly, the simulations predict a non‐zero intercept on the ordinate, corresponding to an unloaded isotonic contraction (i.e. a work‐loop contraction in which the afterload is zero). Despite the absence of afterload and thus macroscopic work, there remains cross‐bridge cycling and ATP hydrolysis.
Figure 6. Simulated components of enthalpy (indexed as cross‐bridge‐dependent ATP hydrolysis) of isometric and work‐loop contractions as functions of afterload in the absence of passive stress.
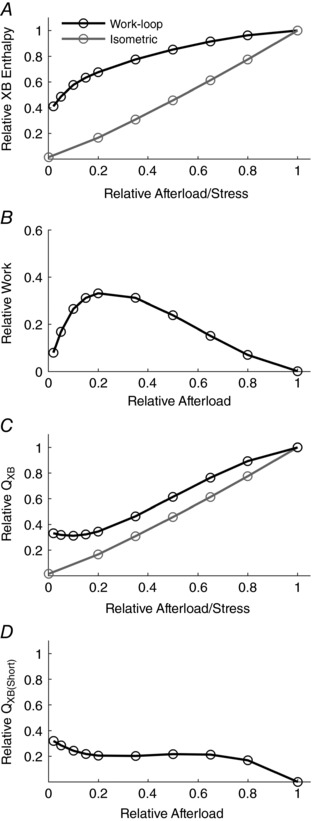
Each panel is equivalent to the corresponding one in Fig. 4, where the simulations were performed in the presence of a realistic passive force–length relation.
In each of the preceding simulations, the sequences of afterloaded isotonic contractions commenced from optimal sarcomere length (2.3 μm). Hence, a new question arises: Does shortening heat vary with initial sarcomere length? This was addressed by performing sequences of simulated work‐loops commencing from progressively reduced initial sarcomere lengths. The left‐most column in Fig. 7 shows simulated isometric contractions, identical to those shown in Fig. 5. Work‐loop contractions are shown for selected initial sarcomere lengths: 2.23 μm, 2.11 μm and 1.94 μm, as exemplified by the progressive left‐shift of the clusters of work‐loops in Fig. 7 F–H. The progressive diminution of cross‐bridge ATP hydrolysis with diminishing sarcomere length (Fig. 7 I–L) is obvious.
Figure 7. Mechanics (active and passive stress) and energetics (rate of cross‐bridge ATP hydrolysis) of isometric and selected work‐loop contractions at various suboptimal sarcomere lengths.
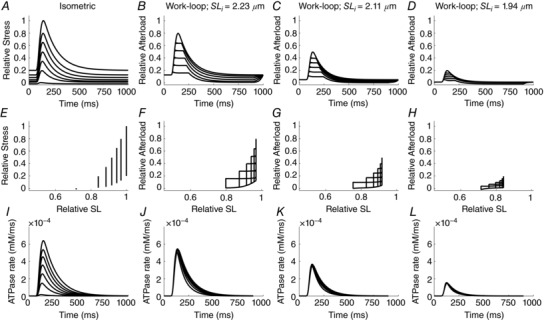
Twitch profiles (top row), stress‐length relationships (middle row) and ATP hydrolysis rates (bottom row).
The energetic consequences of the snapshot of mechanical results shown in Fig. 7 are displayed in Fig. 8. As shown in each panel, a series of five work‐loop contractions was simulated at each of five suboptimal initial sarcomere lengths ranging from 1.94 to 2.3 μm. As the initial sarcomere length is reduced, there is a progressive downward shift of the work‐loop enthalpy–afterload relationship (Fig. 8 A). The peak of each of these curves also shifts downward along the isometric enthalpy–stress relationship.
Figure 8. Simulated energetics of isometric (grey line) and work‐loop contractions (black line) commencing at the initial sarcomere lengths specified.
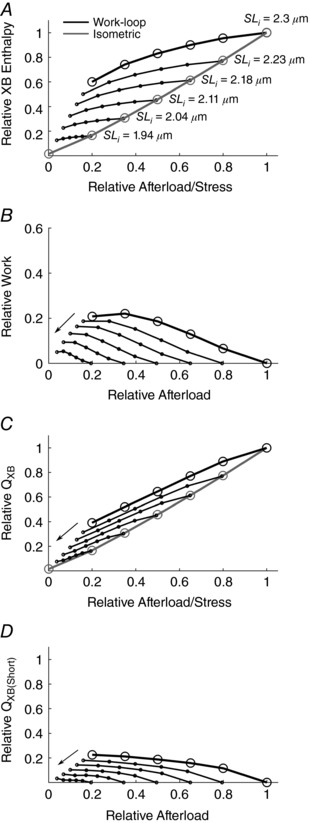
As in Figs 4 and 6, in each panel the black circles and thick black lines denote a range of work‐loop contractions commencing at optimal length (2.3 μm), and the grey circles and grey lines denote isometric contractions producing the same values of peak twitch force. The thin black lines joining the dots represent work‐loops commencing at progressively diminishing sarcomere lengths (as indicated by the labels in A and the arrows in B–D).
As in Fig. 6, enthalpy (Fig. 8 A) was then separated into its components: work (Fig. 8 B) and heat (Fig. 8 C). A decrease in the initial sarcomere length causes a leftward shift of the work–afterload relationship because the area of the work‐loop diminishes (Fig. 7 F–H). There is also a downward shift of the work‐loop heat–enthalpy relationship (Fig. 8 C) reflecting the trend of the enthalpy‐afterload relationship (Fig. 8 A). The difference of profiles between the enthalpy and work relations denotes the shortening heat (Fig. 8 D). The model simulations predict that shortening heat diminishes with reducing initial sarcomere length, as evidenced by a leftward shift of the shortening heat–afterload relation. Note its continuous presence, even at the shortest sarcomere lengths. Note, too, the change of profile from monotonic to biphasic at the lowest two sarcomere lengths, consistent with the behaviour shown in Fig. 6 D.
Given the model predictions of the effect of changing initial sarcomere length on cardiac work‐loop contraction energetics (Fig. 8), a series of validating experiments was performed on cardiac trabeculae. Figure 9 shows the work‐loop heat‐afterload (Fig. 9 A and B) and shortening heat‐afterload relations at three initial muscle lengths. The results are consistent with the model predictions showing that shortening heat reduces with decreasing initial muscle length. Over the full range of afterloads, shortening heat can account for up to approximately 35% of cross‐bridge heat (Fig. 9 C). Shortening heat makes up the highest fraction of cross‐bridge heat when the muscle is shortening against zero afterload.
Figure 9. Experimental data validating model predictions.
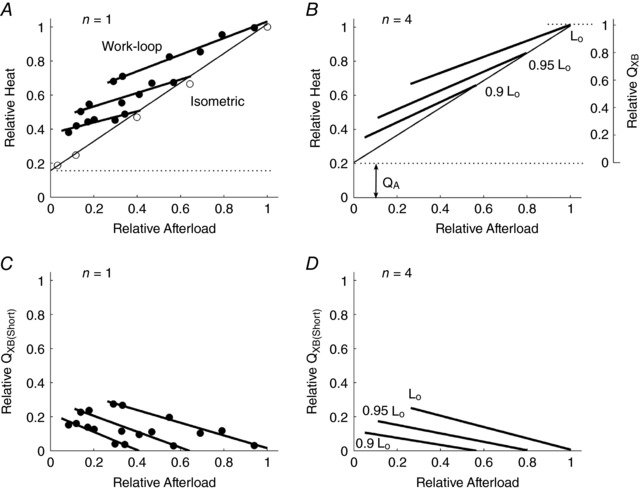
A and B, work‐loop heat–afterload relations at three different initial muscle lengths for a representative trabecula (A) and for an average of four trabeculae (B). Isometric regression line: Heat = (0.80 ± 0.10)S + (0.21 ± 0.07); L o work‐loop regression line: Heat = (0.47 ± 0.10)S + (0.54 ± 0.07); 0.95L o work‐loop regression line: Heat = (0.55 ± 0.10)S + (0.41 ± 0.07); and 0.9L o work‐loop regression line: Heat = (0.60 ± 0.11)S + (0.32 ± 0.07); where S is the relative afterload (means ± SEM). These panels are comparable to the model predictions in Fig. 8 C. C and D, shortening heat as a function of afterload for the same representative trabecula (C) and for an average of four trabeculae (D). These panels are comparable to the model predictions in Fig. 8 D.
Discussion
Compared with skeletal muscle, the history of research into shortening heat in cardiac muscle is necessarily much briefer but no less contentious. Given the similarity of sarcomeric arrangement and contractile protein structure between cardiac and skeletal musculature, it is natural to assume the existence of a phenomenon in cardiac muscle that had been clearly established in the skeletal muscle literature by 1967. Nevertheless, early studies in both isolated papillary muscles (Gibbs et al. 1967; Pool et al. 1968; Coleman et al. 1969) and the isolated whole heart (Weber & Janicki, 1977) returned equivocal results. More recent studies by Gibbs and colleagues (Holroyd & Gibbs, 1992, 1993) showed that, although more heat was produced by muscles undergoing a shortening protocol, this heat appeared to be independent of the extent of shortening and, therefore, these authors concluded that there was no shortening heat in cardiac tissues.
Despite these negative findings, it seems inconceivable to us that cardiac muscle can reduce its length, against any non‐zero load, by any means other than cross‐bridge cycling. Hence, we were motivated to re‐examine the apparent non‐existence of cardiac shortening heat. Our motivation was based, in part, on our ability to perform high‐precision mechano‐energetic experiments and to perform equivalent experiments using a thermodynamically constrained mathematical model of cross‐bridge cycling. In silico simulations allowed us to focus strictly on the cross‐bridge cycle, thereby avoiding possible confounding issues such as length‐dependent release of Ca2+ from the sarcoplasmic reticulum and length‐ or force‐dependent activation of the contractile filaments. In contrast, the experimental results were subjected to whatever force‐, length‐ or velocity‐dependent influences on the rate of cross‐bridge cycling may prevail in myocardial tissue. Furthermore, the inference that shortening heat was observed is based on calculating the difference between two average linear regression lines. Nevertheless, the results of these two complementary approaches are in qualitative and semi‐quantitative agreement, thereby allowing us to reach an unequivocal conclusion. Shortening heat obtains in cardiac muscle and is progressively higher the lower the afterload or, equivalently, the higher the velocity of shortening. These results are in accord with those from experimental studies in skeletal muscle (Yamada & Homsher, 1984; Homsher et al. 1984a, b). The temperature insensitivity of this phenomenon was also demonstrated in our observations at 32°C (Fig. 2) and 37°C (Fig. 9). This is in contrast to skeletal muscle at low temperatures where the heat–tension relationship for isotonic contractions changes from almost flat to a positive slope with increasing temperature (Fischer, 1928).
Whereas Irving & Woledge (1981) proffered a mathematical model of shortening heat in skeletal muscle, we are the first to use a modelling approach for cardiac muscle, which, as we have emphasised, is characterised by a positive enthalpy–load relation. Our modelling results demonstrate that shortening heat in work‐loop contractions arises from the greater rate of cycling of cross‐bridges compared to isometric contractions at any given equivalent stress/afterload (Fig. 3). Given the 1:1 stoichiometry between cross‐bridge cycling rate and ATP consumption rate, contractions from the work‐loop protocol generate greater enthalpy compared to its isometric counterpart (Fig. 4). For an afterloaded work‐loop contraction, the heat that is liberated in excess of the isometric heat can be attributed directly to an increase in cross‐bridge cycling as a result of muscle shortening and can thereby be unequivocally labelled as shortening heat (Gibbs, 1967). Note, however, that since contractions are isometric, rather than iso‐sarcomeric (ter Keurs et al. 1980; Caremani et al. 2016), we will likely have marginally overestimated the extent of isometric heat production, thereby marginally underestimating the magnitude of shortening heat.
The work‐loop heat–enthalpy relation is always positioned above its isometric counterpart because the rate of ATP hydrolysis is much more sensitive to changes in muscle length (Fig. 3 E) than to changes in afterload (Fig. 3 F). Derivation of the isometric heat–stress relation requires changing the muscle length from L o to a length that produces no force. These length steps progressively reduce the overlap fraction of myosin and actin filaments and hence the number of available cross‐bridges. This mechanical change greatly diminishes the profile of the ATP consumption rate (Fig. 3 E). In contrast, if the initial muscle length is held at L o and work‐loop afterload is progressively reduced, there is only a modest shrinkage of the ATP consumption rate profile (Fig. 3 F).
The greatest extent of shortening in a work‐loop contraction occurs at zero afterload. This point should also coincide with the greatest amount of shortening heat released. Experimentally, the presence of passive force prevents work‐loop contractions from being performed below approximately 0.2 relative afterload (Fig. 2 D). This restriction was circumvented using the mathematical model by excluding the passive component of force. In doing so, the model predicts a biphasic shortening heat profile, which increases with decreasing afterload to a peak at the ordinate (Fig. 6 D). The upwards inflection of the shortening heat relation near the ordinate emerges because in the low‐afterload region, the rate of ATP consumption (Fig. 5 F) decreases incommensurately to the extent of shortening (Fig. 5 D). As a result, work (product of afterload and extent of shortening) in the low‐afterload region decreases more than enthalpy, flattening the cross‐bridge heat relation, which causes an upwards inflection in the shortening heat (Fig. 6), a result reminiscent of those reported by Ford & Gilbert (1987).
Previous experimental studies used protocols for isotonic contractions that shortened muscles from a single initial muscle length, typically at L o (Gibbs et al. 1967). However, the effects of reducing initial muscle length below optimal values have not been reported. In this study, we have characterised, for the first time, the mechano‐energetics of work‐loop contractions at suboptimal muscle lengths. The mathematical model was used to simulate these scenarios (Figs 7 and 8) and experiments were carried out, subsequently, to validate the model predictions (Fig. 9). There is a clear relationship between the work‐loop enthalpy–afterload relations at varying initial muscle lengths and the isometric enthalpy–stress relation (Fig. 8 A). The work‐loop enthalpy–load relations are a family of curves that peak at (or originate from) some point along the isometric enthalpy–stress relation corresponding to the initial muscle length. Importantly, these results show a progressive left shift of the shortening heat–afterload relation (Figs 8 D and 9 D) with decreasing initial muscle length, which is commensurate with a reduction in the extent of shortening. That is, shortening heat is a function of the amount of shortening a muscle experiences.
The results of this study also lends strong support to favouring the isometric length‐change protocol over the work‐loop protocol, as adopted by Han et al. (2013) and Tran et al. (2016), as a method for estimating the activation heat (Q A). The simulations predict that extrapolation of the work‐loop heat–afterload relation to the heat intercept would overestimate Q A because of contamination by shortening heat. Our recent study, using blebbistatin (a cross‐bridge inhibitor), has demonstrated the stress (length) independence of Q A (Pham et al. 2017), providing further evidence that any sources of heat in excess of Q A are unrelated to activation processes.
Our confirmation of the existence of shortening heat in cardiac muscle requires a refinement of the conceptual basis of cardiac energy expenditure. Previously, the omission of a shortening heat component meant that all cross‐bridge‐related heat was grouped under one label, Q XB (Loiselle et al. 2016a, b). However, the introduction of a shortening heat Q XB(Short) component allows Q XB to be further subdivided. As illustrated in Fig. 10, our results support the partitioning of the cross‐bridge heat component into separate isometric (Q XB(Isom)) and shortening heat subcomponents. The heat generated by cardiac muscle is thus given by:
| (5) |
Figure 10. Schematic diagram of cardiac energy expenditure.
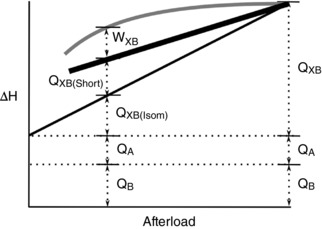
Work‐loop enthalpy (grey line), work‐loop heat (thick black line) and isometric heat (thin black line) are plotted as a function of afterload. Mechanical work (W XB) is the difference between work‐loop enthalpy and work‐loop heat. Q B is basal heat and represents heat generated from processes that maintain quiescent cellular function. Q A represents the activation heat and is composed of heat generated from the processes that contribute to the activation of contraction (e.g. Ca2+ cycling). Q XB is the heat associated with the cycling of cross‐bridges and can be decomposed into Q XB(Isom), the heat associated with isometric contraction, and Q XB(Short), the heat associated with shortening per se. The work components of the activation and basal enthalpy are not shown.
Summary
We have demonstrated experimentally, and corroborated by mathematical modelling, that the output of heat during a work‐loop (shortening) contraction exceeds that generated during an isometric contraction achieving the same peak force. We attribute this difference of heat production to the act of shortening per se, thereby revealing the existence of shortening heat in cardiac muscle.
Additional information
Author contributions
Conception or design of work: K.T., D.L. and J.‐C.H. Design, construction, programming and maintenance of experimental apparatus: A.T. Acquisition, analysis or interpretation of data for the work: K.T., J.‐C.H. and D.L.
Drafting the work or revising it critically for important intellectual content: K.T., D.L., J.‐C.H., A.T. and E.C. All authors approved the final version of the manuscript and agree to be accountable for all aspects of the work in ensuring that questions related to the accuracy or integrity of any part of the work are appropriately investigated and resolved, and all persons designated as authors qualify for authorship, while all those who qualify for authorship are listed.
Funding
This work was funded by New Zealand Heart Foundation grants (Project grant 1601, Research Fellowships 1611 and 1692), Virtual Physiological Rat Centre funded through National Institute of General Medical Sciences Grant P50‐GM094503, Royal Society of New Zealand Marsden Fast‐Start grant (UOA1504) and Health Research Council of New Zealand Emerging Researcher First Grant (16/510), and Medical Technologies Centre of Research Excellence (MedTech CoRE), funded by the Tertiary Education Commission of New Zealand.
References
- Abbott BC (1951). The heat production associated with the maintenance of a prolonged contraction and the extra heat produced during large shortening. J Physiol 112, 438–445. [DOI] [PMC free article] [PubMed] [Google Scholar]
- Buschman HPJ, Elzinga G & Woledge RC (1996). The effects of the level of activation and shortening velocity on energy output in type 3 muscle fibres from Xenopus laevis . Pflugers Arch 433, 153–159. [DOI] [PubMed] [Google Scholar]
- Buschman HPJ, Linari M, Elzinga G & Woledge RC (1997). Mechanical and energy characteristics during shortening in isolated type‐1 muscle fibres from Xenopus laevis studied at maximal and submaximal activation. Pflugers Arch 435, 145–150. [DOI] [PubMed] [Google Scholar]
- Caremani M, Pinzauti F, Reconditi M, Piazzesi G, Stienen GJM, Lombardi V & Linari M (2016). Size and speed of the working stroke of cardiac myosin in situ. Proc Natl Acad Sci USA 113, 3675–3680. [DOI] [PMC free article] [PubMed] [Google Scholar]
- Carlson FD, Hardy DJ & Wilkie DR (1963). Total energy production and phosphocreatine hydrolysis in isotonic twitch. J Gen Physiol 46, 851–882. [DOI] [PMC free article] [PubMed] [Google Scholar]
- Chaplain RA (1972). Energetics of frog rectus abdominis muscle shortening under isotonic load. Experientia 28, 1285–1286. [DOI] [PubMed] [Google Scholar]
- Coleman HN, Sonnenblick EH & Braunwald E (1969). Myocardial oxygen consumption associated with external work – Fenn effect. Am J Physiol 217, 291–296. [DOI] [PubMed] [Google Scholar]
- Fenn WO (1923). A quantitative comparison between the energy liberated and the work performed by the isolation sartorius muscle of the frog. J Physiol 58, 175–203. [DOI] [PMC free article] [PubMed] [Google Scholar]
- Fischer E (1928). Die Wärmelbildung des Skelettmuskels bei indirekter und direkter Reizung, sowie bei der Reflexzuckung. Pflugers Arch 219, 514–553. [Google Scholar]
- Fischer E (1931). The oxygen‐consumption of isolated muscles for isotonic and isometric twitches. Am J Physiol 96, 78–88. [Google Scholar]
- Ford LE & Gilbert SH (1987). The kinetics of heat production in response to active shortening in frog skeletal muscle. J Physiol 385, 449–470. [DOI] [PMC free article] [PubMed] [Google Scholar]
- Gibbs CL & Gibson WR (1970). Energy production in cardiac isotonic contractions. J Gen Physiol 56, 732–750. [DOI] [PMC free article] [PubMed] [Google Scholar]
- Gibbs CL, Loiselle DS & Wendt IR (1988). Activation heat in rabbit cardiac muscle. J Physiol 395, 115–130. [DOI] [PMC free article] [PubMed] [Google Scholar]
- Gibbs CL, Mommaerts WF & Ricchiuti NV (1967). Energetics of cardiac contractions. J Physiol 191, 25–46. [DOI] [PMC free article] [PubMed] [Google Scholar]
- Han J‐C, Taberner AJ, Kirton RS, Nielsen PM, Smith NP & Loiselle DS (2009). A unique micromechanocalorimeter for simultaneous measurement of heat rate and force production of cardiac trabeculae carneae. J Appl Physiol 107, 946–951. [DOI] [PubMed] [Google Scholar]
- Han J‐C, Taberner AJ, Kirton RS, Nielsen PMF, Archer R, Kim N & Loiselle DS (2011). Radius‐dependent decline of performance in isolated cardiac muscle does not reflect inadequacy of diffusive oxygen supply. Am J Physiol Heart Circ Physiol 300, H1222–H1236. [DOI] [PubMed] [Google Scholar]
- Han JC, Taberner AJ, Nielsen PM & Loiselle DS (2013). Interventricular comparison of the energetics of contraction of trabeculae carneae isolated from the rat heart. J Physiol 591, 701–717. [DOI] [PMC free article] [PubMed] [Google Scholar]
- Han JC, Taberner AJ, Tran K, Goo S, Nickerson DP, Nash MP, Nielsen PMF, Crampin EJ & Loiselle DS (2012). Comparison of the Gibbs and Suga formulations of cardiac energetics: the demise of “isoefficiency”. J Appl Physiol 113, 996–1003. [DOI] [PMC free article] [PubMed] [Google Scholar]
- Han JC, Tran K, Nielsen PMF, Taberner AJ & Loiselle DS (2014). Streptozotocin‐induced diabetes prolongs twitch duration without affecting the energetics of isolated ventricular trabeculae. Cardiovasc Diabetol 13, 79. [DOI] [PMC free article] [PubMed] [Google Scholar]
- Hill AV (1949). The heat of activation and the heat of shortening in a muscle twitch. Proc R Soc Lond B Biol Sci 136, 195–211. [DOI] [PubMed] [Google Scholar]
- Hill AV (1950). A challenge to biochemists. Biochim Biophys Acta 4, 4–11. [DOI] [PubMed] [Google Scholar]
- Holroyd SM & Gibbs CL (1992). Is there a shortening‐heat component in mammalian cardiac‐muscle contraction. Am J Physiol 262, H200–H208. [DOI] [PubMed] [Google Scholar]
- Holroyd SM & Gibbs CL (1993). The energetics of shortening amphibian cardiac muscle. Pflugers Arch 424, 84–90. [DOI] [PubMed] [Google Scholar]
- Holroyd SM, Gibbs CL & Luff AR (1996). Shortening heat in slow‐ and fast‐twitch muscles of the rat. Am J Physiol Cell Physiol 270, C293–C297. [DOI] [PubMed] [Google Scholar]
- Homsher E, Irving M & Yamada T (1984a). The effect of shortening on energy liberation and high‐energy phosphate hydrolysis in frog skeletal muscle. Adv Exp Med Biol 170, 865–881. [DOI] [PubMed] [Google Scholar]
- Homsher E & Rall JA (1973). Energetics of shortening muscles in twitches and tetanic contractions. 1. Reinvestigation of Hill's concept of shortening heat. J Gen Physiol 62, 663–676. [DOI] [PMC free article] [PubMed] [Google Scholar]
- Homsher E & Yamada T (1988). The effect of shortening velocity on the shortening heat and its relationship to the distance shortened. Adv Exp Med Biol 226, 689–700. [PubMed] [Google Scholar]
- Homsher E, Yamada T, Wallner A & Tsai J (1984b). Energy‐balance studies in frog skeletal muscles shortening at one‐half maximal velocity. J Gen Physiol 84, 347–359. [DOI] [PMC free article] [PubMed] [Google Scholar]
- Huxley AF (1957). Muscle structure and theories of contraction. Prog Biophys Mol Biol 7, 255–318. [PubMed] [Google Scholar]
- Irving M & Woledge RC (1981). The dependence on extent of shortening of the extra energy liberated by rapidly shortening frog skeletal muscle. J Physiol 321, 411–422. [DOI] [PMC free article] [PubMed] [Google Scholar]
- Irving M, Woledge RC & Yamada K (1979). Heat produced by frog‐muscle in a series of contractions with shortening. J Physiol 293, 103–118. [DOI] [PMC free article] [PubMed] [Google Scholar]
- Johnston CM, Han JC, Ruddy BP, Nielsen PMF & Taberner AJ (2015). A high‐resolution thermoelectric module‐based calorimeter for measuring the energetics of isolated ventricular trabeculae at body temperature. Am J Physiol Heart Circ Physiol 309, H318–H324. [DOI] [PubMed] [Google Scholar]
- Loiselle DS, Han JC, Goo E, Chapman B, Barclay CJ, Hickey AJR & Taberner AJ (2016a). Thermodynamic analysis questions claims of improved cardiac efficiency by dietary fish oil. J Gen Physiol 148, 183–193. [DOI] [PMC free article] [PubMed] [Google Scholar]
- Loiselle DS, Johnston CM, Han JC, Nielsen PMF & Taberner AJ (2016b). Muscle heat: a window into the thermodynamics of a molecular machine. Am J Physiol Heart Circ Physiol 310, H311–H325. [DOI] [PubMed] [Google Scholar]
- Mommaerts W, Marechal G & Seraydarian K (1962). Work and chemical change in isotonic muscular contractions. Biochim Biophys Acta 57, 1–12. [DOI] [PubMed] [Google Scholar]
- Mommaerts WF (1969). Energetics of muscular contraction. Physiol Rev 49, 427–508. [DOI] [PubMed] [Google Scholar]
- Pham T, Tran K, Mellor KM, Hickey A, Power A, Ward ML, Taberner A, Han JC & Loiselle D (2017). Does the intercept of the heat‐stress relation provide an accurate estimate of cardiac activation heat? J Physiol 595, 4725–4733. [DOI] [PMC free article] [PubMed] [Google Scholar]
- Pool PE, Chandler BM, Seagren SC & Sonnenblick EH (1968). Mechanochemistry of cardiac muscle. 2. Isotonic contraction. Circ Res 22, 465–472. [DOI] [PubMed] [Google Scholar]
- Rall JA (1978). Dependence of energy output on force generation during muscle‐contraction. Am J Physiol Cell Physiol 235, C20–C24. [DOI] [PubMed] [Google Scholar]
- Rice JJ, Wang F, Bers DM & de Tombe PP (2008). Approximate model of cooperative activation and crossbridge cycling in cardiac muscle using ordinary differential equations. Biophys J 95, 2368–2390. [DOI] [PMC free article] [PubMed] [Google Scholar]
- Taberner AJ, Han JC, Loiselle DS & Nielsen PMF (2011). An innovative work‐loop calorimeter for in vitro measurement of the mechanics and energetics of working cardiac trabeculae. J Appl Physiol 111, 1798–1803. [DOI] [PubMed] [Google Scholar]
- Taberner AJ, Johnston CM, Pham T, Han JC, Ruddy BP, Loiselle DS & Nielsen PMF (2015). Measuring the mechanical efficiency of a working cardiac muscle sample at body temperature using a flow‐through calorimeter. In Engineering in Medicine and Biology Society (EMBC), 2015 37th Annual International Conference of the IEEE, pp. 7966–7969. [DOI] [PubMed]
- ter Keurs HEDJ, Rijnsburger WH, Vanheuningen R & Nagelsmit MJ (1980). Tension development and sarcomere‐length in rat cardiac trabeculae – evidence of length‐dependent activation. Circ Res 46, 703–714. [DOI] [PubMed] [Google Scholar]
- Tran K, Han JC, Taberner AJ, Barrett CJ, Crampin EJ & Loiselle DS (2016). Myocardial energetics is not compromised during compensated hypertrophy in the Dahl salt‐sensitive rat model of hypertension. Am J Physiol Heart Circ Physiol 311, H563–H571. [DOI] [PMC free article] [PubMed] [Google Scholar]
- Tran K, Smith NP, Loiselle DS & Crampin EJ (2010). A metabolite‐sensitive, thermodynamically constrained model of cardiac cross‐bridge cycling: implications for force development during ischemia. Biophys J 98, 267–276. [DOI] [PMC free article] [PubMed] [Google Scholar]
- Weber KT & Janicki JS (1977). Myocardial oxygen‐consumption – role of wall force and shortening. Am J Physiol Heart Circ Physiol 233, H421–H430. [DOI] [PubMed] [Google Scholar]
- Wilkie DR (1968). Heat work and phosphorylcreatine break‐down in muscle. J Physiol 195, 157–183. [DOI] [PMC free article] [PubMed] [Google Scholar]
- Woledge RC & Reilly PJ (1988). Molar enthalpy change for hydrolysis of phosphorylcreatine under conditions in muscle cells. Biophys J 54, 97–104. [DOI] [PMC free article] [PubMed] [Google Scholar]
- Yamada T & Homsher E (1984). The dependence on the distance of shortening of the energy output from frog skeletal muscle shortening at velocities of Vmax, 1/2Vmax and 1/4Vmax . Adv Exp Med Biol 170, 883–885. [DOI] [PubMed] [Google Scholar]


