Abstract
Novel fast response shape-memory polyurethanes were prepared from bio-based polyols, diphenyl methane diisocyanate and butane diol for the first time. The bio-based polyester polyols were synthesized from 9-hydroxynonanoic acid, a product obtained by ozonolysis of fatty acids extracted from soy oil and castor oil. The morphology of polyurethanes was investigated by synchrotron ultra-small angle X-ray scattering, which revealed the inter-domain spacing between the hard and soft phases, the degree of phase separation, and the level of intermixing between the hard and soft phases. We also conducted thorough investigations of the thermal, mechanical, and dielectric properties of the polyurethanes, and found that high crystallization rate of the soft segment gives these polyurethanes unique properties suitable for shape-memory applications, such as adjustable transition temperatures, high degree of elastic elongations, and good mechanical strength. These materials are also potentially biodegradable and biocompatible, therefore suitable for biomedical and environmental applications.
Keywords: shape-memory, polyurethane, synthesis, properties
Introduction
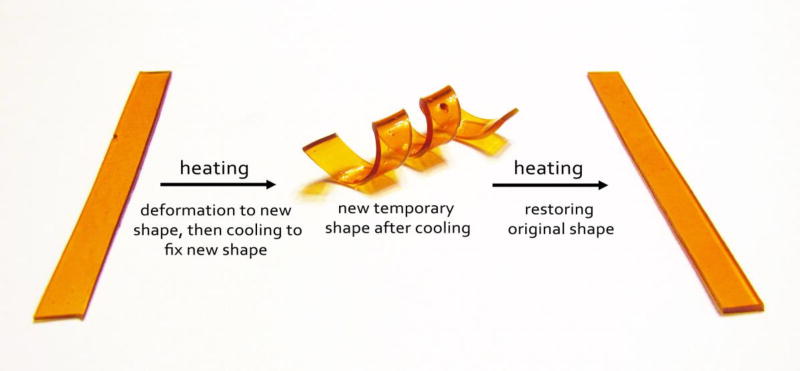
Shape memory polymers (SMP), when compared with conventional shape-memory alloys, [1] have advantages such as higher degree of deformation, ease of processing, and potential biodegradability and biocompatibility. [2–8] Shape-memory effect of SMPs is often induced by temperature. The working principle of SMP is demonstrated in Figure 1, using a flat strip of bio-based shape-memory thermoplastic polyurethane elastomer reported in this work. In the first step, the polyurethane is heated above its transition point and deformed to a spiral shape. Subsequent cooling below this transition point preserves the spiral shape. Heating the SMP above the transition point again invokes the shape-memory effect and restores its original shape, i.e., flat strip.
Figure 1.
A demonstration of the shape-memory performance of the bio-based segmented polyurethane elastomers reported in this paper. The fast response properties are further demonstrated in the Supplementary Video.
Virtually all polymeric materials demonstrate a certain degree of shape-memory effects. Good thermally induced SMPs display relatively large and fast response within a narrow temperature range. Segmented polyurethanes have several pronounced advantages as SMPs. For example, the synthesis of segmented polyurethanes is simple. Segmented polyurethanes are also highly processable -- they can be cast, injection-molded or extruded to their final shapes. These factors enable industrial scale-up. The properties of segmented polyurethanes can be tailored by varying soft segment concentration (SSC) and type and molecular mass of soft segments.[9] So far, polyurethanes and their composites have been used in a number of SMP applications, such as sensors and actuators. [10–14] More recently, highly tunable thermoset shape-memory polyurethanes with permanent shape reconfigurability have been synthesized, where the cross-linking density can be adjusted over a wide range.[15, 16] This discovery, in many ways, blurs the traditional definition of thermoplastic and thermoset SMPs.
Soft and hard segments, the building blocks of segmented polyurethanes, have different roles in deciding the physical properties and materials performance of the shape-memory polyurethanes. The soft segments are the working part in shape-memory polyurethanes. The type of soft segment and its molecular mass (M) determine the shape-memory transition point (melting temperature). The typical molecular mass of soft segments is between 700 g/mol and 5000 g/mol, with higher values leading to higher melting points. SSC also determines the magnitude of the response (degree of deformation). On the other hand, the hard segments serve as physical cross-linkers and determine processing temperature.
The soft and hard segments of standard shape-memory polyurethanes are usually crystalline. When hard segments are prepared from methylene diphenyl diisocyanate (MDI) and butane diol (BD), the melting point, which varies with molecular mass of hard segments, is close to 200 °C. Crystallizing soft segments are usually based on linear polyesters from glycols and diacids, polycaprolactone (PCL), polylactic acids, or polyethers such as polyethylene glycol or polytetramethylene glycol. For example, PCL-based shape-memory polyurethanes have been studied by several groups.[3, 11, 17–19]
In this work, we describe the synthesis, structure, and properties of a class of novel shape-memory polyurethanes with polyhydroxynonanoic acid (PHNA) soft segments with different soft-segment concentrations and molecular mass for the first time. Importantly, PHNA used in this work is directly obtained from vegetable oils, which yields renewable, potentially biocompatible and biodegradable polyurethanes with fast shape-memory responses and large deformations. While it is known that high molecular mass PHNA has a melting point at 70 °C compared with 60 °C for PCL, we will show that when PHNA is used as soft segments in polyurethanes, the melting point of the soft segments can be controlled by adjusting proper molecular mass and SSC, possibly to a temperature very close to the body temperature. We have also conducted a comprehensive morphological, thermal, mechanical, and dielectric characterizations of the polyurethane materials. Particularly, we constructed scattering models to describe the different morphologies of segmented polyurethanes with different soft segment concentrations, and showed that the different microscopic morphological characteristics are responsible for the application-critical mechanical behaviors of the shape-memory polyurethanes. Whereas the morphology of memory shape materials is an important factor that affects many materials properties but is seldom discussed in depth in literature, such scattering models could potentially be extended and applied to other segmented polyurethane systems to aid understanding and optimizing their materials behaviors.
Experimental
Starting Materials
Methyl ester of hydroxynonanoic acid (MHNA) was synthesized by ozonolysis of castor and soy oil. Mondur M, a high purity MDI, and 1,4-Butanediol (BD) were acquired from Bayer and Aldrich, respectively. BD was distilled under vacuum and stored over molecular sieves.
Experimental Methods
We determined the hydroxyl numbers by phthalic anhydride method following ASTM D 1957-86 standard test method. The number average molecular mass of the polyols (diols) were calculated based on the hydroxyl numbers. We analyzed the presence of functional groups using a Perkin Elmer Spectrum-1000 Fourier transform infrared (FTIR) spectrometer. Because the polyurethanes synthesized in this work were not soluble in commonly used solvents, we could not make use of size exclusion chromatography (SEC) for molecular mass evaluation of polyurethanes. Instead, we used SEC to follow the synthesis of polyols. We measured the viscosity of polyols using a Rheometrics SR-500 dynamic stress rheometer with parallel plates (25 mm in diameter and 1mm gap distance).
The thermograms of the TPUs were acquired using differential scanning calorimeter (DSC) model Q100, from TA Instruments, with a heating rate of 10 °C/min from −80 °C to 250 °C. We characterized the dielectric properties of the shape-memory polyurethanes using a Dielectric Analyzer (DEA) model 2970 from TA Instruments. The DEA was at six frequencies from 1 to 100,000 Hz, at the heating rate of 3 °C/min, from −100 °C to 150 °C.
We used a dynamic mechanical analyzer (DMA 2980) from TA Instruments to characterize the viscoelastic behaviors of the polyurethanes. The DMA was operated at 10 Hz in a temperature range from −80 °C to 120 °C with a heating rate of 3 °C/min. We also used a Q-Test 2 tensile tester from MTS at an extension rate of 50 mm/min (100 %/min) and a gauge length of 50 mm. For tensile tests, the specimens have a dimension of 7 mm (width) × 0.35 mm (thickness) × 50 mm (length).
We performed two types of X-ray analysis. We used an XRD-6000 diffractometer equipped with a Cu source (Cu Kα radiation, wavelength = 1.5418 Å) from Shimadzu to examine the crystallinity of both the diols and the polyurethanes in a diffraction-angle (2θ) range from 2° to 50°. We also performed Ultra-small angle X-ray scattering (USAXS) analysis over a q range from 1 × 10⁻⁴ Å−1 to 0.4 Å−1 using the USAXS instrument at 15-ID of the Advanced Photon Source, Argonne National Laboratory in 1D collimated geometry.[20] X-ray wavelength was 0.734 Å. More details about this instrument can be found elsewhere. [21]
Results and Discussion
Synthesis and characterization of the diols
Soft segments in this work are made from bio-based macrodiols while hard segments are from MDI and butane diol, which can be also bio-based. The monomer for the macrodiols was methyl 9-hydroxynonaoate, a product of ozonolysis of vegetable oils in methanol and methylene chloride solution, followed by reduction with sodium borohydride. Triglyceride triols were separated and transesterified with methanol to obtain methyl esters of fatty acids and glycerin. More detailed preparation of hydroxynonanoic acid methyl ester is described elsewhere.[22] Polyols were made by transesterification of hexane diol as a starter and MHNA at 160 °C and ending at 220 °C, with removal of methanol as a by-product. The molecular mass of the polyols was controlled by the ratio of a short diol to the hydroxy fatty acid. For example, by mixing 12 moles of PHNA (M=188 g/mol) with one mole of glycol with molecular mass between 100 g/mol and 200 g/mol, one obtains a diol (PHNA diols) with molecular mass close to 2000 g/mol, after removing 12 moles of methanol.
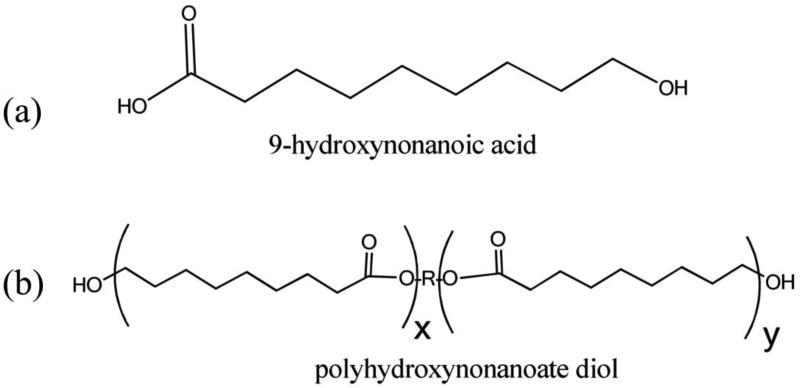
Furthermore, these PHNA diols have a very regular structure and are crystalline at room temperature, a behavior similar to that of PCL diols. The structures of the hydroxynonanoic acid and PHNA macrodiol are shown in Figure 2. The main difference between PHNA diols and PCL diols is the number of CH2 groups in their repeat units – the repeat unit of PHNA diols has three more methylene groups than that of PCL diols, thus are approaching the structure of polyethylene and are more hydrophobic. From a biodegradation point of view, polyesters are biodegradable and the rate of biodegradation can be regulated by the number of methylene groups between ester groups, with higher number leading to slower biodegradation. Hence, the PHNA diols in this study are biodegradable and have a biodegradation rate slower than that of PCL diols.
Figure 2.
Chemical structures of (a) 9-hydroxynonanoic acid monomer and (b) macrodiol.
Four polyols (macrodiols) were prepared with molecular mass varying from 1135 g/mol to 2530 g/mol. Their identifiers and detailed properties, such as their appearances, hydroxyl numbers, acid values, viscosities, melting points, and crystallization temperatures, are listed in Table 1. All uncertainties in this table and hereafter represent one standard deviation. All polyols were yellowish crystalline solids at room temperature with melting points ranging from 62 °C to 65 °C. The crystallization points are located between 48 °C and 51 °C. The viscosities of the polyols increase monotonically with increasing molecular mass. Other than the polyol with the highest molecular mass (2530 g/mol), the viscosities of the polyols were below 1 Pa.s at 70 °C.
Table 1.
Properties of PHNA polyester diols (values in the parentheses of this table and after represent uncertainty of one standard deviation).
| Sample name | PHNA diol-1 | PHNA diol-2 | PHNA diol-3 | PHNA diol-4 |
|---|---|---|---|---|
| Appearance | light yellowish solid | light yellowish solid | light yellowish solid | light yellowish solid |
|
| ||||
| OH#, mg KOH/g1 | 44.3(3) | 72.8(3) | 98.9(3) | 84.6(3) |
|
| ||||
| Acid value, mg KOH/g | 0.5(2) | 0.4(2) | 0.4(2) | 0.4(2) |
|
| ||||
| Mn (from OH#), g/mol | 2530(50) | 1540(31) | 1135(21) | 1327(26) |
|
| ||||
| Viscosity, Pa·s | 1.28(1) (70°C) | 0.92(1) (70°C) | 0.24(1) (70°C) | 0.46(1) (70°C) |
| 0.93(1) (80°C) | 0.22(1) (80 °C) | 0.18(1) (80 °C) | ||
| 0.70(1) (90°C) | 0.17(1) (90°C) | 0.14(1) (90°C) | ||
|
| ||||
| Melting point, °C (from DSC) | 65(2) | 64(2) | 62(2) | 62(2) |
|
| ||||
| Crystallization point, °C (from DSC) | 51(2) | 50(2) | 50(2) | 48(2) |
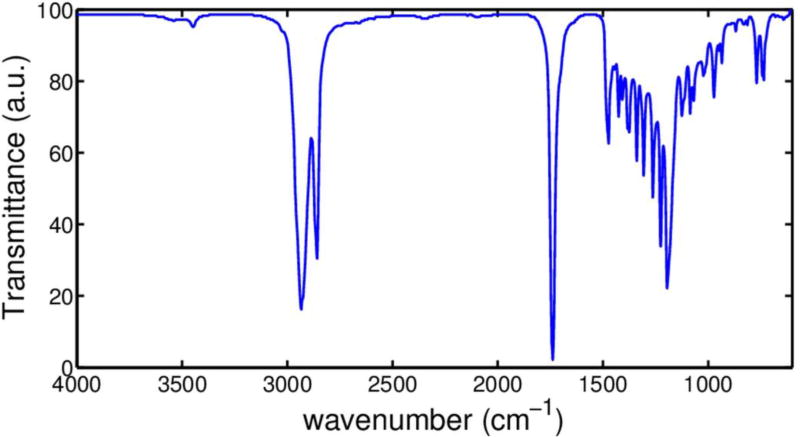
Figure 3 shows a representative FTIR spectrum of PHNA diol-1. We observe a weak non-hydrogen bonded hydroxyl peak at 3543 cm−1 and a weaker hydrogen-bonded peak as its shoulder to the right, which indicates that OH groups in the highly non-polar environment are isolated and mainly non-hydrogen bonded. We also observe many very sharp absorption bands in the FT-IR spectrum due to the high degree of crystallinity in the diol. Particularly, strong ester carbonyl band was observed at 1732 cm−1 and ester C-O vibrations observed between 1200 cm−1 and 1000 cm−1.
Figure 3.
FTIR spectrum of PHNA diol-1 demonstrating that OH groups are mainly non-hydrogen bonded and that the diol contains high degree of crystallinity.
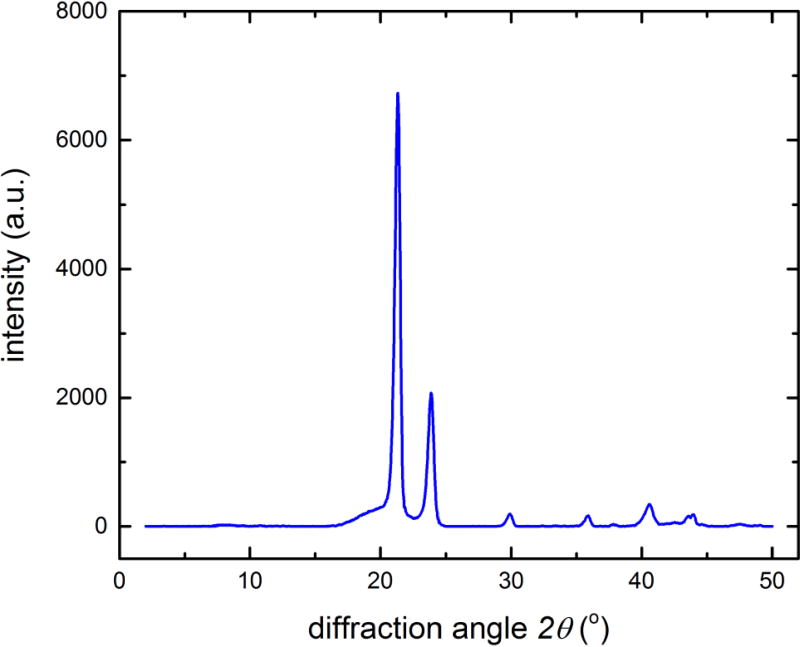
Figure 4 shows the XRD spectrum of PHNA diol-1 acquired using Cu Kα radiation, representative of all the polyols listed in Table 1. Sharp diffraction peaks were observed, strongly indicative of high degree of crystallinity in the diols, consistent with FTIR findings. The XRD peak height increases and peak width decreases with increasing the molecular mass of the polyols (data not shown), which suggests that higher HNA to glycol ratio leads to more ordered crystalline structure. This result is consistent with previous findings by Cooper et al.[23] A closer look at the data also indicates that the two strongest reflections at 2θ = 21.4° and 23.9° (equivalent to spacings of 0.415 nm and 0.372 nm, respectively) are very similar to the characteristic reflections of polyethylene. This may be understood on the ground that the polyesters in the polyols can be considered as modified polyethylene with ester bonds at intervals of 9 carbon atoms.
Figure 4.
XRD spectrum of PHNA diol-1 acquired with Cu Kα radiation. Sharp diffraction peaks strongly indicate high degree of crystallinity in the diol.
Synthesis and characterization of the polyurethanes
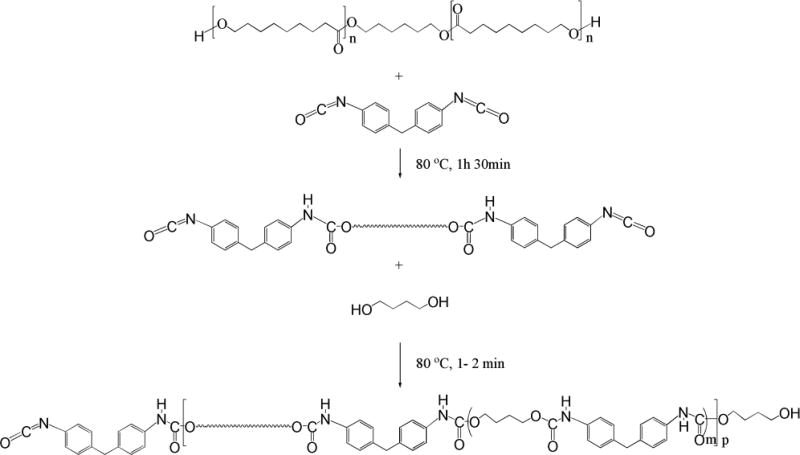
The polyols reacted with an excess of MDI to yield a quasi-prepolymer. Soft segment concentration was controlled by butane diol/polyol ratio.[9] Polyols and MDI were melted at 70 °C and weighted into the flask. Reaction was carried out at 70–75 °C for 1 h and 30 min in nitrogen atmosphere. The prepolymer, a yellowish solid, was transferred into a beaker and heated at 80 °C. Butane diol was also preheated at 80 °C and added into the prepolymer. After 1–2 minutes of stirring the mixture became rigid, white solid thermoplastic polyurethane (TPU). The polymer is then transferred into a compression mold and placed into a press at 180 °C and kept for 2 h to complete polymerization. After cooling to room temperature, the 1 mm thick sheet was taken out from the mold and used for further structural, thermal, and mechanical testing and characterizations. The synthesized TPUs were insoluble in any of the typical solvents for polyurethanes, thus molecular mass could not be assessed by SEC. However, the TPUs possess excellent mechanical properties, strongly indicating that the molecular mass of the TPUs were sufficiently high for property testing purposes. These reactions are further illustrated in Figure 5. The naming scheme of the TPU samples can be found in Table 2.
Figure 5.
Schematic showing the detailed synthesis steps of TPU from PHNA diol
Table 2.
Thermal properties of polyurethanes. The naming scheme follows the principles below: TPU-DIOL(molecular mass in g/mol)-soft/hard segment concentration in mass %.
| Sample name | Tg of soft segments °C |
Tm of soft segments °C |
Soft segment ΔH, J/g * |
Tg of hard segments, °C |
Tm of hard segments, °C |
Hard segment ΔH, J/g * |
|---|---|---|---|---|---|---|
| TPU-DIOL1135-60/40 | −24(2) | 38.0(5) | 17.2 | - | 203.0(5) | 1.9 |
| TPU-DIOL1327-50/50 | −13(2) | - | - | - | 191.0(5) | 7.0 |
| TPU-DIOL1327-60/40 | −23(2) | 32.0(5) | 7.0 | - | 135.0(5) | 9.3 |
| TPU-DIOL1327-70/30 | −24(2) | 44.0(5) | 33.9 | 123(2) | 200.0(5) | <1.0 |
| TPU-DIOL1540-60/40 | −25(2) | 42.0(5) | 21.1 | - | 208.0(5) | 3.2 |
| TPU-DIOL1540-70/30 | −26(2) | 48.0(5) | 37.5 | - | - | - |
| TPU-DIOL2530-60/40 | - | 51.0(5) | 33.3 | - | 212.0(5) | 8.3 |
The values of melting enthalpies are indicative with estimated standard deviation below 1.0 J/g.
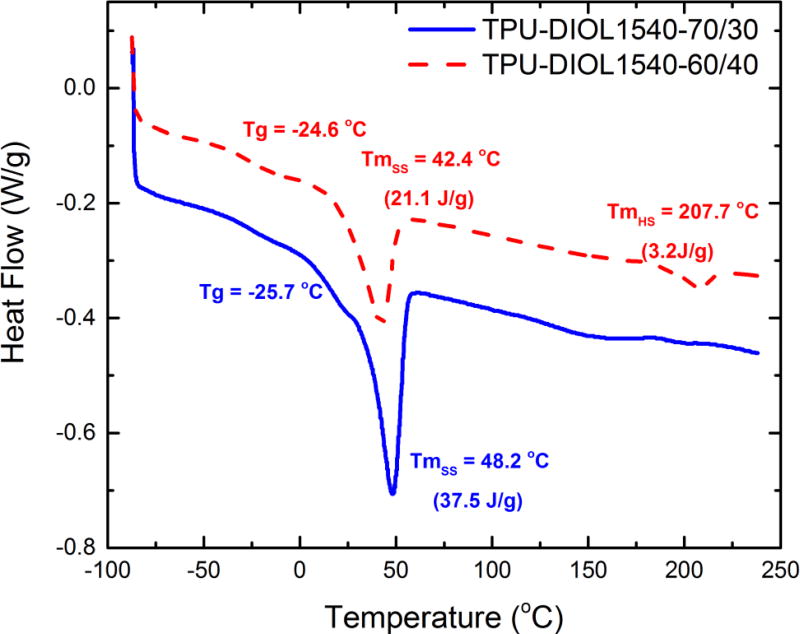
Figure 6 shows the DSC thermograms of the TPUs from diol-2 (molecular mass = 1540 g/mol), with 60 % and 70 % SSC, respectively. These DSC thermograms are typical for the TPUs reported in this paper. The main features of the DSC thermograms include the observation of glass transition temperatures of soft segments near −25 °C, melting points of soft segments between 32 °C and 50 °C, and melting temperatures of hard segments near 200 °C. Particularly, as Figure 6 shows, increasing SSC (decreasing hard segment concentration) increases the total latent heat of the melting peak of the soft segment and decreases the heat capacity corresponding to the melting peak of the hard segment, which is barely visible in the sample with 70 % SSC. Also, we found that it is easier for the soft segments to crystallize in samples with 70 % SSC, resulting in significantly higher melting enthalpy than in samples with 60 % and 50 % SSC (not displayed here, where the melting of soft segment was almost completely suppressed). We summarize the detailed thermal properties of all TPU samples in Table 2.
Figure 6.
DSC thermograms of TPU-DIOL1540-60/40 (red) and TPU-DIOL1540-70/30 (blue)
A closer examination of the melting points of the polyols shown in Table 1 and the melting points of polyol-based soft segments in Table 2 indicates that the melting points from 62 °C to 65 °C in polyols were lowered to about 32–51 °C in TPUs, which is due to the immobilization of chain ends in TPUs. Despite the samples being limited, these results demonstrate an overall trend that with polyols of the same molecular mass, the soft segment melting temperature increases with increasing soft segment concentrations. With the soft segments being the deciding factor of shape-memory transition temperatures, this result also suggests that the shape-memory transition temperature can be adjusted to body temperature by carefully selecting both the molecular mass of the diols and SSC, thus bringing the possibility of potential biomedical applications.[24] From a morphological point of view, it has been shown in other TPU systems[25, 26] that due to free-energy constraints, with 70 % SSC, the hard segments form globular domains dispersed in a continuous soft-segment matrix; whereas with 50 % SSC the soft and hard domains display a co-continuous morphology. We surmise that TPUs with 60 % SSC have a mixed morphology, as suggested previously based on both structural investigation and mechanical testing results.[27] These materials would show elastomeric properties between melting points of the soft and hard phases and would require processing temperature above hard segment melting point for injection molding, extrusion or compression molding.
Associated with the thermal properties, the soft segments in shape-memory TPUs determine the transition temperature as well as the degree and rate of the thermal response. Hence, they determine the shape-memory behavior of the TPUs. We demonstrate the performance of the TPUs reported in this paper, particularly their fast thermal responses, in the Supplementary Video. The sample was TPU-DIOL1327-70/30 with 70 % SSC. It was immersed in a hot-water bath at 80 °C, which was above the melting point of the soft segments (44 °C). The originally stiff strip of the sample became soft and highly extendable. We wrapped the TPU strip around a glass rod to form a spiral shape. Upon subsequent immersion into cold water and extraction of the glass rod, the sample preserved a spiral shape, which is permanent if kept below the melting temperature of the soft segments. The video further shows that upon a second immersion into 80 °C water, the TPU sample returned to its original shape and size almost instantaneously. This video clearly demonstrates the fast response of this class of shape-memory polyurethanes as well as their superb elastic-recovery properties, which will be discussed in further detail later in this paper. In contrast, TPU-DIOL1327-50/50 sample, which contains 50 % SSC, did not exhibit nearly as good shape-memory effects, partly because the higher degree of interaction between the soft and hard segments in a co-continuous morphology places a more constringent condition on the mobility of the soft segments.
Morphology of polyurethanes
Segmented polyurethanes are two-phase copolymers due to incompatibility of the soft and hard phase. The morphology depends on concentration and molecular mass of both soft and hard segments. For 50 % soft segment concentration and soft segments molecular mass of 2000, due to connectivity, hard segments must have the same molecular mass, i.e., 2000. However, for SSC=70 %, molecular mass of the hard segments would be 2000 × 3/7= 857, i.e., molecular mass of the hard segments depends on the soft segment molecular mass and concentration. For soft segments with molecular mass of 2000 and about equal concentration of the two phases (50 % SSC) they tend to form bi-continuous morphology, whereas at high SSC (70 % in our case), hard domains are typically dispersed as globules in the soft phase. At an intermediate SSC, phase inversion occurs, i.e., transition from one to the other type of morphology. The inversion point (SSC) depends on the molecular mass of the hard phase and shifts to higher SSC for higher hard segment molecular mass. Properties of segmented polyurethanes depend on SSC, hard domain shape and size and boundary layer thickness. In polymers with crystallizing soft hard phases, four phases can be identified: amorphous soft and hard phases and crystalline soft and hard phases, making the morphology quite complex. It is also known that the morphology of TPUs plays a critical role in deciding the materials behavior and performance.[28] In this study, we investigated the morphology of the shape-memory TPUs using synchrotron-based USAXS, a technique known for its ability to characterize polymeric materials with hierarchical or across-length-scale microstructures.[29] Due to the Bonse-Hart geometry of the crystal optics, the acquired USAXS intensity was slit-smeared. We followed the standard Lake procedure[30, 31] to derive the scattering intensity in absolute scale, i.e., the differential scattering cross section dΣ per unit solid angle dΩ, per unit sample volume.
| (1) |
Here, the abscissa I(q) is the magnitude of the scattering vector, q=4π/λsin(θ), λ is the wavelength of incident X-ray, and 2θ is the scattering angle. The absolute scattering intensity I(q) is a material characteristic directly related to the underlying scattering inhomogeneity.
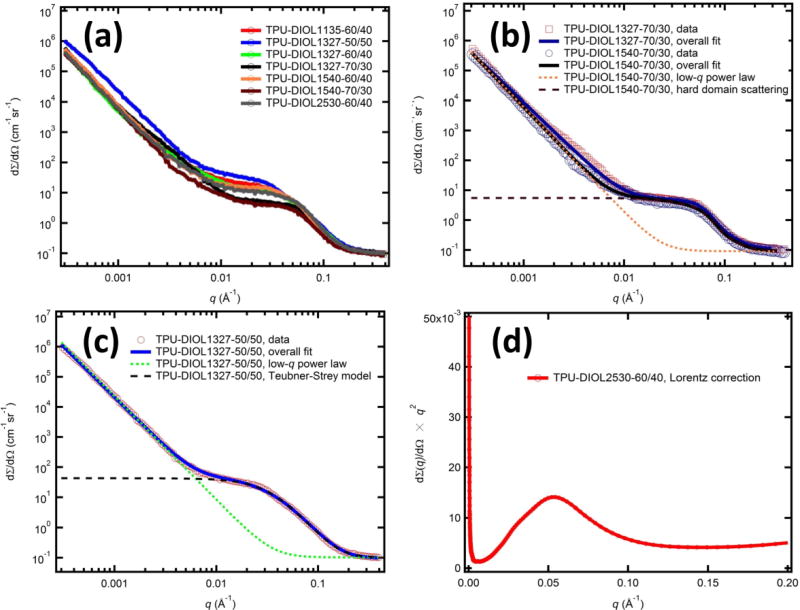
The USAXS profiles of the TPU samples are shown in Figure 7 (a). These profiles bear much resemblance: they all feature a power-law curve at low q, and a broad scattering feature at high q characteristic of microphase separation. Without a corresponding Guinier component, which exists beyond the lower-q (upper size) detection limit of the USAXS instrument (1 × 10⁻⁴ Å−1), the low-q scattering alone is not adequate to quantitatively determine the nature of the scattering inhomogeneities. However, the presence of low-q scattering suggests that structural inhomogeneities at sizes greater than 1 µm exist. [32] This is consistent with previous direct observations from a number of studies, ranging from classic TEM work by Fridman and Thomas where large (greater than 10 µm) spherulite structures were observed[33], AFM studies by Wilkes et al. where spherulitic microstructures were observed in the size range of 1–3 µm[34], to our recent study of structurally similar TPUs using AFM and optical microscopy where spherulites were identified in the size range of 10 µm. [26, 35] Furthermore, we analyzed the low-q scattering behavior (q < 0.002 Å−1) of the TPU samples using a power-law slope I(q) = I0 × qn. The values of the exponent n are listed in Table 3. In all cases, the exponent falls into a narrow range between −3.56 and −3.21, a behavior consistent with scattering from large-scale structural inhomogeneities having rough surfaces or interfaces.[29] Additionally, the power-law slopes do not appear to depend on either the SSCs or molecular mass of the diols. The broad scattering peak at high q, indicative of microphase separation, on the other hand, shows a strong dependence on the SSC for the PHNA diol of the same molecular mass. At the same time, the dependence of the feature on the molecular mass for the same SSC is not obvious.
Figure 7.
(a) USAXS patterns of thermoplastic polyurethanes with different PHNA diols. (b) USAXS analysis of TPUs with 70 % SSC. (c) USAXS analysis of TPU with 50 % SSC. (d) Illustration of Lorentz correction.
Table 3.
Summary of USAXS analysis results. The samples are grouped by their SSCs. The low-q power-law slope was determined by a least-squares fitting analysis of the data with q< 0.002 Å−1. Depending on the SSCs and consequent different morphologies of the TPUs, we used different models to analyze the scattering intensity related to phase separation, namely, Teubner-Strey model for 50 % SSC, isolated scatterer model for 70 % SSC, and Lorentz correction for 60 % SSC.
| Sample name | Low-q Slope |
Correlation Length (nm) |
Average Repeat Distance (nm) |
Sphere Radius (nm) |
Mean Separation Distance (nm) |
volume fraction |
Interdomain distance (nm) |
|---|---|---|---|---|---|---|---|
| TPU-DIOL1327-50/50 | −3.340(2) | 3.1(1) | 45.4(2) | ||||
| TPU-DIOL1135-60/40 | −3.404(6) | 13.7(2) | |||||
| TPU-DIOL1327-60/40 | −3.209(7) | 12.6(1) | |||||
| TPU-DIOL1540-60/40 | −3.548(4) | 13.1(3) | |||||
| TPU-DIOL2530-60/40 | −3.564(6) | 11.6(3) | |||||
| TPU-DIOL1327-70/30 | −3.325(9) | 3.19(6) | 8.81(11) | 0.21(1) | |||
| TPU-DIOL1540-70/30 | −3.537(8) | 3.09(35) | 8.38(23) | 0.25(1) |
Morphological models are needed to quantitatively characterize the scattering intensities originated from microphase separation. Previous microscopic and scattering studies conducted by Wilkes[27], Schaefer[36], some authors of the current paper,[25, 26] and others, [37–39] have established that the morphologies of phase-separated segmented polyurethanes depend on the concentrations of both the hard and soft segments. Particularly, when the hard segment concentration is less than 30%, the hard segments usually form isolated hard domains dispersed in a matrix consisting of soft segments. When the concentration ratio between hard segment and soft segment is 1:1, free energy constraints lead to the formation of a co-continuous network morphology. More details about these morphological characteristics can be found in our previous work. [25, 26, 36]
Due to their fundamental morphological differences, different analytical models are required to extract structural details. In our earlier work, we have constructed analytical scattering models to account for these two types of morphologies. [25, 26] Specifically, at 70 % SSC, based on microscopic evidence, we assumed that the hard domains possess a spherical shape, hence their scattering profiles can be described using a spherical form factor. Due to the relatively high volume fraction of the hard domains, we further accounted for the inter-domain interference by introducing a hard-sphere-like structure factor. At 50 % SSC, due to TPU’s co-continuous network morphology, the individual scattering object model for 70 % SSC no longer applies. Instead, we made use of the Teubner-Strey model, which is based on the Landau-Ginzburg free-energy theory and has been used to describe two-phase non-particulate systems such as microemulsions and polymer composite membranes.[40, 41] The mathematical details of these models can be found elsewhere. [26] These models describe the scattering profiles of TPU-DIOL1327-70/30, TPU-DIOL1540-70/30, and TPU-DIOL1327-50/50 well, as shown in Figure 7(b) and 7(c). To highlight the models, we also show the component plots that describe the contributions from the low-q power-law scattering as well as the phase-separation scattering in these two subplots. The detailed fitting results are tabulated in Table 3. These results show that the hard-domains in 70 % SSC samples are approximately 3 nm in diameter, with mean separating distances between 8 nm and 9 nm. The volume fraction acquired from the structure factor is approximately 23 %, below the 30 % molar fraction of the hard domains, which suggests compact hard domains. The 50 % SSC sample (TPU-DIOL1327-50/50), on the other hand, features a correlation length of 3.1 nm and an average repeat distance of 45.4 nm.
From a morphological point of view, 60 % SSC TPU demonstrates phase inversion. Thus, it is an intermediate between the dispersed hard domain morphology of 70 % SSC TPU and the co-continuous network morphology of 50 % TPU. [27, 34, 42] This renders the two analytical models mentioned above invalid. To extract the average interdomain spacing in these TPU samples, we adopted the following generic procedure.
In the first step, the scattering background, which originates from background noise and thermal density fluctuations within the polymers, was determined using the Bonart method.[43] Following this, the differential scattering section of the sample is calculated as
| (2) |
where IM(q) is the measured intensity and Ib(q) is the calculated scattering background. Consequently, I(q) is the absolutely calibrated scattering intensity from the sample, given the first principle, intensity absolute calibration nature of the USAXS instrument.
To extract the average interdomain spacing distance in these TPU samples, we performed a Lorentz correction of the scattering intensity, a method whose applicability was justified by Ophir and Wilkes.[44] This procedure calls for plotting I(q)×q2 against q. The interdomain spacing d could be estimated from the position of the maximum of I(q)×q2 based on equation
| (3) |
An example of this determination is shown in Figure 7(d). The values for qmax and their corresponding interdomain spacing d in the 60 % SSC samples are shown in Table 3. Here, we found that in all cases, the interdomain spacings are greater than the mean separation distances in 70 % SSC samples and less than the average repeat distance in the 50 % SSC sample, which is consistent with the assumption that the 60 % SSC samples have a morphology intermediate to that of 50 % and 70 % SSC samples.
We further estimated the degree of phase separation in these TPU samples. For a completely phase separated material, the scattering length density of the two phases is related to the scattering invariant of an ideal two-phase system, following,
| (4) |
ϕhs and ϕss are the volume ratio of the hard segment and soft segment, respectively; ρss and ρhs are the scattering length density of the hard segment and soft segment, respectively. Qmax is the maximum value that a scattering invariant could take. Here, a scattering invariant follows
| (5) |
The ratio Q/Qmax has often been used as a measure of the degree of phase separations in polyurethanes. [45–48] In our case, we assumed that all the hard segments in the samples have the same scattering length density ρhs, so do the scattering length density ρss. Additionally, we liberally took the SSC of the samples as volume ratio of the soft segments. The calculated scattering invariants and the degrees of phase separation are shown in Table 4. These calculations show that for samples with the same PHNA diols, the higher the SSC is, the worse the phase separation becomes. At the same time, there does not appear to be a clear trend for samples with the same SSC but different PHNA diols.
Table 4.
Scattering invariants and degrees of phase separations.
| Sample | scattering invariant | Dps 1 | Normalized Dps 2 |
|---|---|---|---|
| TPU-DIOL1135-60/40 | 0.00112(3) | 0.0047 | 0.74 |
| TPU-DIOL1327-50/50 | 0.00158(4) | 0.0063 | 1.00 |
| TPU-DIOL1327-60/40 | 0.00123(3) | 0.0051 | 0.81 |
| TPU-DIOL1327-70/30 | 0.00089(2) | 0.0042 | 0.67 |
| TPU-DIOL1540-60/40 | 0.00114(3) | 0.0047 | 0.75 |
| TPU-DIOL1540-70/30 | 0.00070(2) | 0.0033 | 0.52 |
| TPU-DIOL2530-60/40 | 0.00119(3) | 0.0050 | 0.78 |
Dps: degree of separation, calculated by dividing the scattering invariant with the volume ratios of hard segments and soft segments. For example, for TPU-DIOL1135-6060/40 sample, Dps = 0.00112/0.6/0.4.
Normalized Dps: Dps normalized by the maximum Dps.
Crystallinity of polyurethanes
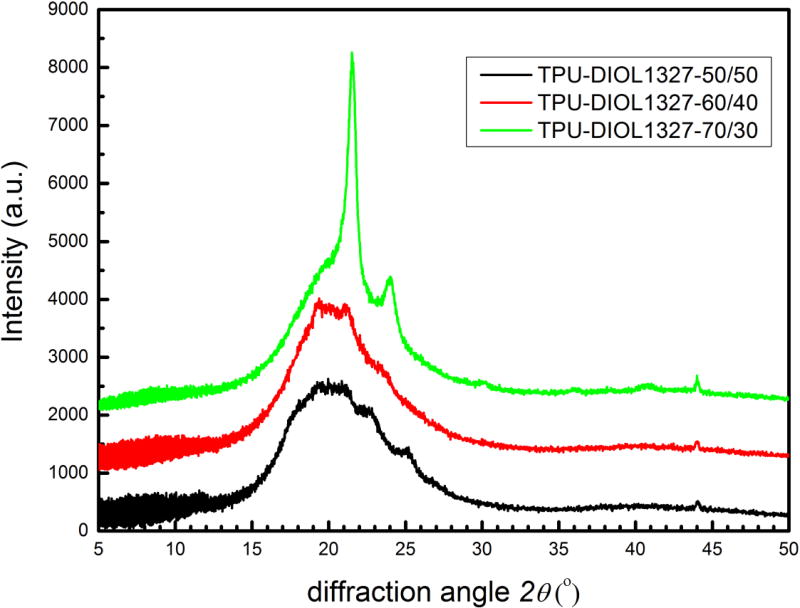
As a multiphase system, both the soft phase and the hard phase in TPUs can consist of crystalline and amorphous phases. These properties are revealed by the DSC results. It is, however, not straightforward to quantify the crystallinity of these different phases, largely due to the well-known challenge in structural characterization of amorphous materials. Figure 8 shows a series of X-ray diffractograms of TPUs with diols having molecular mass of 1327. The SSCs are 50 %, 60 %, and 70 %, respectively. A direct comparison with Figure 4 (PHNA diol-4) shows that the sharp diffraction peaks of diols have been broadened and weakened in TPUs, and that several the weakened peaks sit on a broad diffuse scattering peak centered near 2θ ≈ 20°. This is understandable considering that the presence of the hard phase may impart constraints on mobility of the soft phase and its packing into the crystalline lattice. This is particularly true for TPUs with co-continuous morphology, i.e., 50 % SSC and partially 60 % SSC. We also note that the diffraction peaks became more prominent for the 70 % SSC sample. We partially attribute this phenomenon to the higher crystallization rate of soft segments in samples with higher SSC and the reduced interfacial area between the soft and hard phases due to the globular morphology of the hard phases, which helps to preserve the crystallinity of the diols as evidenced by the intense diffraction peaks at 2θ = 21.4° and 23.9°. Furthermore, we also point out that whereas hard-segment molecular mass at 50 % SSC is equal to that of polyol (M = 1327 g/mol), it is lowered to M = 880 g/mol at 60 % SSC and M = 570 g/mol at 70 % SSC. The reduction in molecular mass makes it more difficult for the hard segments to crystallize, as supported by the reduction of the weak diffraction peak near 2θ = 19°.
Figure 8.
X-ray diffractograms of TPU-DIOL1327-50/50, TPU-DIOL1327-60/40, and TPU-DIOL1327-70/30, respectively.
Dynamic mechanical properties of polyurethanes
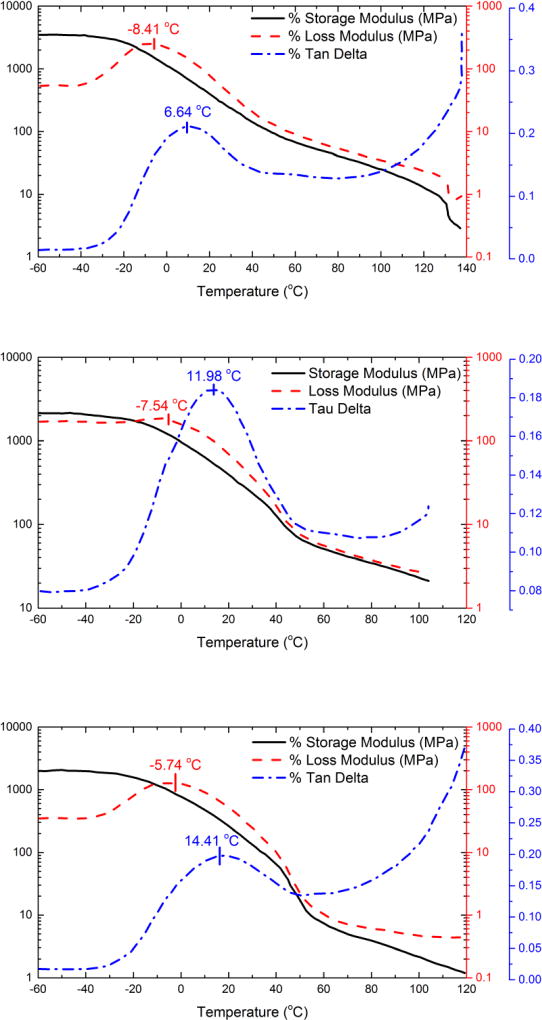
Figure 9 shows the temperature-dependent mechanical properties of TPUs with diols having Mn = 1327 g/mol. From top to bottom, the SSCs are 50 %, 60 %, and 70 %, respectively. Each panel includes storage modulus (black solid line), loss modulus (long dashed line), and tangent δ (dashed dot line), which may be used to determine the elastic properties, viscous properties, and relative contributions of viscous vs. elastic properties of the TPUs, respectively.
Figure 9.
DMA curves of segmented TPU-DIOL1327-50/50 (top), TPU-DIOL1327-60/40 (middle) and TPU-DIOL1327-70/30 (bottom)
At temperatures below −45 °C, i.e., below the glass transition temperatures of the soft segments, we observed a high level of storage modulus between 2 GPa and 4 GPa, whose value depends on the SSC – the higher the SSC, the lower the storage modulus at this temperature range. As a general trend, the storage modulus shows a monotonic decrease as temperature increases. We also observed an accelerated decrease in the storage modulus in TPU-DIOL1327-60/40 and TPU-DIOL1327-70/30 between 40 °C and 60 °C, but not as much in TPU-DIOL1327-50/50. This decrease results from the melting of the soft phase. However, the co-continuous morphology in TPU-DIOL1327-50/50 places a constraint on the decrease of storage modulus, hence we did not observe apparent sudden decrease. The relative degree of loss in the storage modulus is higher in TPU-DIOL1327-70/30 (≈ 60 MPa to ≈ 10 MPa) than in TPU-DIOL1327-60/40 (≈ 200 MPa to ≈ 70 MPa), which supports our morphological results that TPU-DIOL1327-60/40 consists of mixed domains of co-continuous phase and isolated globular hard phases.
The loss modulus curves feature a weak and broad peak at the low temperature regime (T < 40 °C). The peak maxima, as identified in Figure 9, are within a narrow temperature range between −8.4 °C and −5.7 °C and show a monotonic increase with increasing SSC. This peak-like feature is related to the glass transition of the soft segments, where the loss modulus increases as the material approaches the glass transition temperature and decreases after glass transition temperature is exceeded and a rubbery state is reached.
This phenomenon is more evidently seen in the tan δ curves, where a prominent peak indicative of α relaxation centered between 6.6 °C and 14.4 °C clearly demonstrates the viscoelastic behavior of the TPUs in the glass transition zone. The tan δ curves also show a second weak peak near 60 °C. This temperature is close to but slightly higher than the melting temperatures of the soft phase in these TPUs. Generally speaking, Figure 9 shows that the values of tan δ are low when temperature is below 100 °C. Tan δ is related to the viscous loss of energy during cyclic deformation. When tan δ value is high, it indicates a high level of energy absorption and correlates with improved impact strength due to the absorbed energy being converted to heat. The low values observed in our study suggests that these TPU materials are not prone to energy dissipation
Tensile properties of polyurethanes
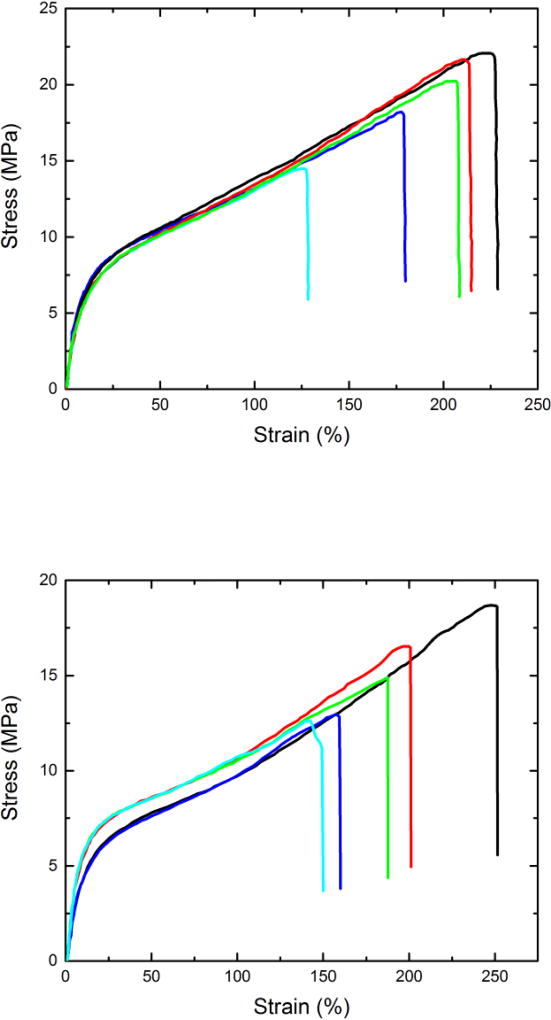
Figure 10 shows the typical stress-strain curves of TPU-DIOL1327-50/50 and TPU-DIOL1327-60/40. Surprisingly, despite relatively high crystallinity of these materials, the yield points were not observed. Repeat experiments show a large degree of variations, as shown in Figure 10, which may be caused by the challenges in preparing good, homogeneous tensile specimens from limited amount of available materials.
Figure 10.
Stress-strain behavior of TPU-DIOL1327-50/50 (top), TPU-DIOL1327-60/40 (bottom)
The mechanical properties of the TPUs are summarized in Table 5. Unsurprisingly, TPU-DIOL1327-50/50, the sample with co-continuous morphology, displays the highest tensile strength (18.4 MPa). In the DIOL1327 TPU series, we observed a monotonic decrease in the tensile strength, as SSC increases. This is again consistent with the morphological differences that have been discussed earlier in the paper. All TPUs demonstrate a tensile strength near or above 10 MPa, an oft-considered benchmark value for practical applications. For comparison, these TPUs demonstrate tensile strengths comparable to or even higher than a class of polyurethane composites reinforced with high loading of filler particles,[49] where tensile strengths were found in the range of 9 MPa and 11 MPa. We point out that, despite the relatively high degree of crystallinity in the soft and hard segments, these TPUs display high degree of elongations. These TPUs also demonstrate good stiffness. While regular polyurethane elastomers have typically Young’s moduli below 10 MPa, our shape-memory TPUs are much stiffer. In particular, TPU-DIOL1540-60/40 has a Young’s modulus nearly 200 MPa, which are in the range of low-density polyethylene. Tensile strengths, elongations and modulus were higher than in thermoset shape-memory polyurethanes obtained from triols prepared by metathesis.[50, 51]
Table 5.
Mechanical properties of the TPUs.
| Sample name | Tensile strength (MPa) |
Elongation % |
Young’s modulus (MPa) |
|---|---|---|---|
| TPU-DIOL1135-60/40 | 12.5(1.3) | 151 (14) | 69 (8) |
| TPU-DIOL1327-50/50 | 18.4(3.0) | 159 (40) | 58 (11) |
| TPU-DIOL1327-60/40 | 14.1(3.7) | 192 (41) | 52 (11) |
| TPU-DIOL1327-70/30 | 10.0 (2.9) | 286 (15) | |
| TPU-DIOL1540-60/40 | 10.6 (3.1) | 70 (16) | 199 (42) |
| TPU-DIOL1540-70/30 | 14.2 (1.4) | 487 (22) | 19 (4) |
| TPU-DIOL2530-60/40 | 10.7 (2.0) | 142 (15) | 54 (8) |
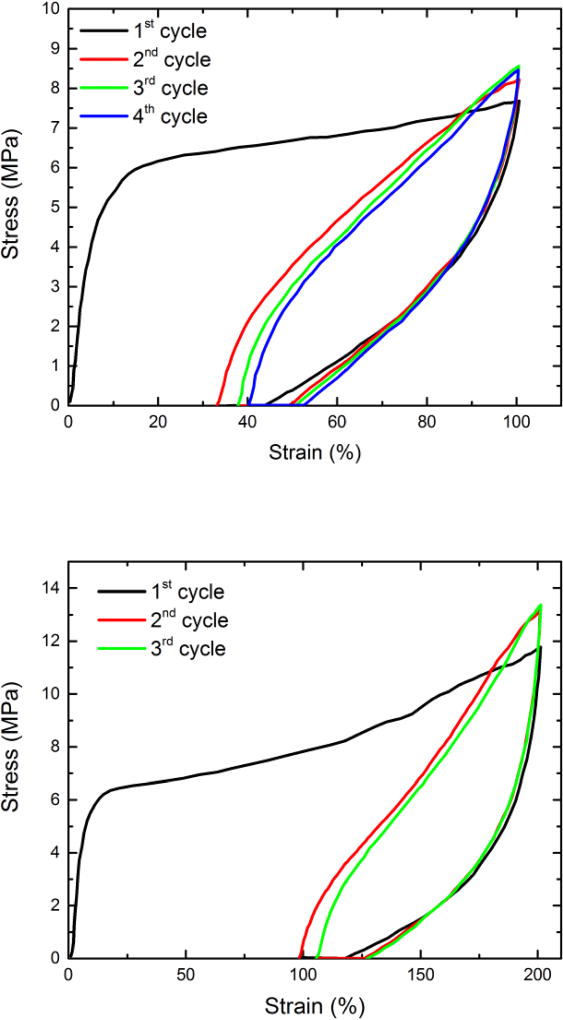
We also determined the elastic recovery of the TPUs. A set of elastic recovery data acquired on TPU-DIOL1540-70/30, representative of TPUs with 70 % SSC, is shown in Figure 11. The tests were conducted under 100 % and 200 %, respectively. The samples display strong stress softening after the first cycle because of the chain orientation and alignments of hard segments.[52] Strain recovery after first cycle was 56 % (residual plastic deformation was 44%) at 100 % extension and about 42 % after elongation at 200 %. The test shows that elastic recovery at room temperature is significant. High residual deformation indicates that the shape of the material can be induced by cold deformation, i.e., it is susceptible to cold programming as suggested recently.[53] It is interesting that PCL –based segmented polyurethanes with molecular mass of the soft segments of 2000 displayed similar recovery as our samples.[11] We also found that the elastic recovery was virtually complete above the shape-memory transition temperature.
Figure 11.
Elastic recoveries for TPU-DIOL1540-70/30 at 100 % (top), 200 % (bottom) after three or four cycles.
Dielectric properties of shape memory polyurethanes
Dielectric spectroscopy probes the dielectric properties of a medium as a function of frequency. When used on polymeric materials, DEA provides dynamic information regarding the materials polarity, transitions, and molecular and segmental motions and relaxations. DEA is also found complementary to dynamic mechanical analysis but allows much higher frequency range due to its electric nature.[54]
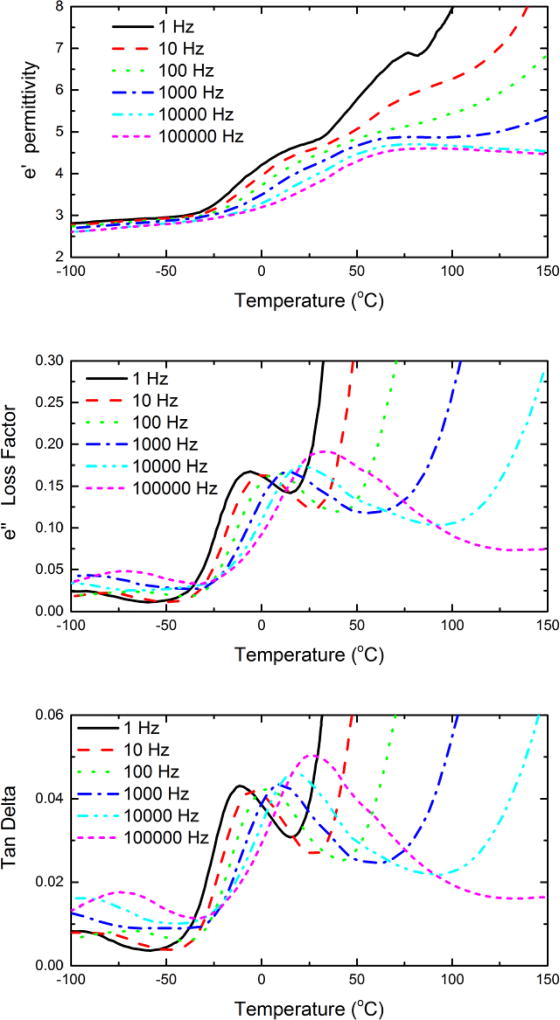
We performed DEA on the shape-memory TPUs. As an example, Figure 12 shows the dependence of permittivity, loss factor and tan δ of TPU-DIOL1327-50/50 on temperature across a frequency range from 1 Hz to 100 kHz. At temperatures below 30 °C, the permittivity shows a relatively low value below 3, and varies little with frequency. This contribution originates from the electronic polarization and localized polarization of small groups within the main chain induced by the electric field. The rapid increase in permittivity between −30 °C and 40–50 °C reveals the unfreezing of amorphous component of soft segments. This coincides with α-transition observed on loss factor-temperature and tan δ-temperature curves.
Figure 12.
DEA analysis of segmented TPU-DIOL1327-50/50. The top, middle, and bottom panel shows the permittivity, loss factor, and tan δ, respectively.
The maxima on the permittivity curves shift to higher temperatures with increasing frequency allowing determination of activation energy of the process. Continuing increase in permittivity at low frequency results from the melting of soft segment and increased ionic conductivity, which are more prominent at lower frequencies. Loss factor and tan δ curves show a β peak at −70 °C at 100 kHz or lower at lower frequencies, probably related to Schatzki-type short segment motions observed in most hydrocarbon polymers. Large increase in loss factor and tan δ above α-transition is due to ionic conductivity, however only the curve on 100 kHz reveal another transition in the 60 °C range assigned to soft segment melting.
In summary, dielectric measurements reveal high conductive losses above transition temperature and two relaxation (α and β) peaks below room temperature associated with segmental and group motions in the soft segments.
Conclusions
We prepared novel fast-response shape-memory polyurethanes with highly crystalline bio-based polyester polyols soft segments for the first time. The polyols were synthesized from 9-hydroxynonanoic acid, a product obtained by ozonolysis of fatty acids extracted from soy oil and castor oil. These materials are easily processable by standard injection molding and extrusion methods, thus making scale-up possible.
We have performed comprehensive thermal, morphological, mechanical, and dielectric characterization to these shape-memory polyurethanes. We found that the shape-memory transition temperature of this type of TPUs is tunable by selecting the soft-segment molecular mass and SSC and ranges between 32 °C and 51 °C. All TPUs demonstrate microphase separations. We constructed different scattering models to account for the change in TPU morphology from isolated globule to co-continuous network as increasing SSC. We found that for TPUs with the same PHNA diols the interdomain spacing and degree of phase separation both decrease with higher SSC. These morphological characteristics are in turn tied to the shape-memory behaviors, where we found that TPUs with higher SSC exhibit better SMP performance. Furthermore, these TPUs possess good tensile strength, high elongations, and considerably higher modulus below transition temperature than petrochemical TPUs of the same soft segment concentration. These properties, particularly the large deformation, fast response, adjustable shape-memory transition temperature near body temperature, and potential biodegradability, make these novel bio-based TPUs good candidate materials for a wide range of applications, for examples, sensors, actuators, medical and biomimetic devices such as stents and sutures, self-healing systems such as protective coatings, and self-deployable structures such as those aimed at space applications.
Supplementary Material
Acknowledgments
This work was supported by research funding from U.S. Department of Agriculture, Award no. 2008-38924-19200. ChemMatCARS Sector 15 is principally supported by the Divisions of Chemistry (CHE) and Materials Research (DMR), National Science Foundation, under grant number NSF/CHE-1346572. Use of the Advanced Photon Source, an Office of Science User Facility operated for the U.S. Department of Energy (DOE) Office of Science by Argonne National Laboratory, was supported by the U.S. DOE under Contract No. DE-AC02-06CH11357.
Certain commercial equipment, instruments, software or materials are identified in this paper to foster understanding. Such identification does not imply recommendation or endorsement by the Department of Commerce or the National Institute of Standards and Technology, nor does it imply that the materials or equipment identified are necessarily the best available for the purpose.
Contributor Information
Zoran S Petrović, Kansas Polymer Research Center, Pittsburg State University, Pittsburg, KS 66762.
Jelena Milić, Kansas Polymer Research Center, Pittsburg State University, Pittsburg, KS 66762.
Fan Zhang, Materials Measurement Science Division, National Institute of Standards and Technology, Gaithersburg, MD 20899.
Jan Ilavsky, X-ray Science Division, Argonne National Laboratory, Argonne, IL60439.
References
- 1.Huang WM, Ding Z, Wang CC, Wei J, Zhao Y, Purnawali H. Shape Memory Materials. Materials Today. 2010;13(7–8):54–1. [Google Scholar]
- 2.Jin H, Chen Q, Chen Z, Hu Y, Zhang J. Multi-LeapMotion sensor based demonstration for robotic refine tabletop object manipulation task. CAAI Transactions on Intelligence Technology. 2016;1(1):104–113. [Google Scholar]
- 3.Lendlein A, Kelch S. Shape-Memory Polymers Angewandte Chemie International Edition. 2002;41(12):2034–2057. [PubMed] [Google Scholar]
- 4.Liu C, Qin H, Mather PT. Review of progress in shape-memory polymers. J. Mater. Chem. 2007;17:1543–1558. [Google Scholar]
- 5.Liu CTT. Shape-Memory Materials and Phenomena - Fundamental Aspects and Applications. Materials Research Society. 1992 [Google Scholar]
- 6.Feninat FE, Laroche G, Fiset M, Mantovani D. Shape memory for biomedical applications. Advanced Engineering Materials. 2002;4(3):91–104. [Google Scholar]
- 7.Leng J, Lu H, Liu Y, Huang WM, Du S. Shape-Memory Polymers-A Class of Novel Smart Materials. MRS Bulletin. 2009;34(11):848–855. [Google Scholar]
- 8.Zhang C-H, Wei H-G, Liu Y-Y, Tan H-F, Guo Z. Enhanced toughness and shape memory behaviors of toughed epoxy resin. High Perform. Polym. 2012;24(8):702–709. [Google Scholar]
- 9.Petrović ZS, Ferguson J. Polyurethane elastomers. Prog. Polym. Sci. 1991;16(5):695–836. [Google Scholar]
- 10.Ji FL, Hu JL, Li TC, Wong YW. Morphology and shape memory effect of segmented polyurethanes. Part I: With crystalline reversible phase. Polymer. 2007;48(17):5133–5145. [Google Scholar]
- 11.Kim BK, Lee SY, Xu M. Polyurethanes having shape memory effects. Polymer. 1996;37(26):5781–5793. [Google Scholar]
- 12.Liu H, Gao J, Huang W, Dai K, Zheng G, Liu C, Shen C, Yan X, Guo J, Guo Z. Electrically conductive strain sensing polyurethane nanocomposites with synergistic carbon nanotubes and graphene bifillers. Nanoscale. 2016;8(26):12977–12989. doi: 10.1039/c6nr02216b. [DOI] [PubMed] [Google Scholar]
- 13.Lan Y, Liu H, Cao X, Zhao S, Dai K, Yan X, Zheng G, Liu C, Shen C, Guo Z. Electrically conductive thermoplastic polyurethane/polypropylene nanocomposites with selectively distributed graphene. Polymer. 2016;97:11–19. [Google Scholar]
- 14.Liu H, Dong M, Huang W, Gao J, Dai K, Guo J, Zheng G, Liu C, Shen C, Guo Z. Lightweight conductive graphene/thermoplastic polyurethane foams with ultrahigh compressibility for piezoresistive sensing. Journal of Materials Chemistry C. 2017;5(1):73–83. [Google Scholar]
- 15.Zheng N, Fang Z, Zou W, Zhao Q, Xie T. Thermoset Shape-Memory Polyurethane with Intrinsic Plasticity Enabled by Transcarbamoylation. Angewandte Chemie International Edition. 2016;55(38):11421–11425. doi: 10.1002/anie.201602847. [DOI] [PubMed] [Google Scholar]
- 16.Zheng N, Hou J, Xu Y, Fang Z, Zou W, Zhao Q, Xie T. Catalyst-Free Thermoset Polyurethane with Permanent Shape Reconfigurability and Highly Tunable Triple-Shape Memory Performance. ACS Macro Letters. 2017;6(4):326–330. doi: 10.1021/acsmacrolett.7b00037. [DOI] [PubMed] [Google Scholar]
- 17.Behl M, Lendlein A. Shape-memory polymers. Materials Today. 2007;10(4):20–28. [Google Scholar]
- 18.Langer RS, Lendlein A. Shape memory polymers. Mnemoscience Gmbh; US: 2002. [Google Scholar]
- 19.Li F, Zhang X, Hou J, Xu M, Luo X, Ma D, Kim BK. Studies on Thermally Stimulated Shape Memory Effect of Segmented Polyurethanes. J Appl Polym Sci. 1997;64:1511–1516. [Google Scholar]
- 20.Ilavsky J, Jemian PR, Allen AJ, Zhang F, Levine LE, Long GG. Ultra-small-angle X-ray scattering at the Advanced Photon Source. Journal of Applied Crystallography. 2009;42:469–479. [Google Scholar]
- 21.Ilavsky J, Zhang F, Allen A, Levine L, Jemian P, Long G. Ultra-small-angle X-ray scattering instrument at the advanced photon source: history, recent development, and current status. Metall. Mater. Trans. A. 2013;44(1):68–76. [Google Scholar]
- 22.Cvetković I, Milić J, Ionescu M, Petrović ZS. Preparation of 9-hydroxynonanoic acid methyl ester by ozonolysis of vegetable oils and its polycondensation. Hemijska Industrija. 2008;62(6):319–328. [Google Scholar]
- 23.Silver JH, Myers CW, Lim F, Cooper SL. Effect of polyol molecular weight on the physical properties and haemocompatibility of polyurethanes containing polyethylene oxide macroglycols. Biomaterials. 1994;15(9):695–704. doi: 10.1016/0142-9612(94)90168-6. [DOI] [PubMed] [Google Scholar]
- 24.Gu L, Cui B, Wu Q-Y, Yu H. Bio-based polyurethanes with shape memory behavior at body temperature: effect of different chain extenders. RSC Advances. 2016;6(22):17888–17895. [Google Scholar]
- 25.Petrović ZS, Hong D, Javni I, Erina N, Zhang F, Ilavský J. Phase structure in segmented polyurethanes having fatty acid-based soft segments. Polymer. 2013;54(1):372–380. [Google Scholar]
- 26.Javni I, Bilić O, Bilić N, Petrović ZS, Eastwood EA, Zhang F, Ilavský J. Thermoplastic polyurethanes with controlled morphology based on methylenediphenyldiisocyanate/isosorbide/butanediol hard segments. Polym. Int. 2015;64(11):1607–1616. [Google Scholar]
- 27.Xu Y, Petrovic Z, Das S, Wilkes GL. Morphology and properties of thermoplastic polyurethanes with dangling chains in ricinoleate-based soft segments. Polymer. 2008;49(19):4248–4258. [Google Scholar]
- 28.Prisacariu C. Polyurethane elastomers: from morphology to mechanical aspects. Springer Science & Business Media. 2011 [Google Scholar]
- 29.Zhang F, Ilavsky J. Ultra-small-angle X-ray scattering of polymers. J. Macromol. Sci. Polym. Rev. 2010;50(1):59–90. [Google Scholar]
- 30.Ilavsky J, Jemian PR. Irena: tool suite for modeling and analysis of small-angle scattering. Journal of Applied Crystallography. 2009;42:347–353. [Google Scholar]
- 31.Lake J. An iterative method of slit-correcting small angle X-ray data. Acta Crystallogr. 1967;23(2):191–194. [Google Scholar]
- 32.Takahashi T, Hayashi N, Hayashi S. Structure and properties of shape-memory polyurethane block copolymers. J. Appl. Polym. Sci. 1996;60(7):1061–1069. [Google Scholar]
- 33.Fridman ID, Thomas EL. Morphology of crystalline polyurethane hard segment domains and spherulites. Polymer. 1980;21(4):388–392. [Google Scholar]
- 34.Aneja A, Wilkes GL. A systematic series of ‘model’PTMO based segmented polyurethanes reinvestigated using atomic force microscopy. Polymer. 2003;44(23):7221–7228. [Google Scholar]
- 35.Javni I, Bilić O, Bilić N, Petrović ZS, Eastwood EA, Zhang F, Ilavský J. Thermoplastic polyurethanes with isosorbide chain extender. J. Appl. Polym. Sci. 2015;132(47) [Google Scholar]
- 36.Petrović ZS, Cevallos MJ, Javni I, Schaefer DW, Justice R. Soy-oil-based segmented polyurethanes. J. Polym. Sci., Part B: Polym. Phys. 2005;43(22):3178–3190. [Google Scholar]
- 37.Li Y, Gao T, Chu B. Synchrotron SAXS studies of the phase-separation kinetics in a segmented polyurethane. Macromolecules. 1992;25(6):1737–1742. [Google Scholar]
- 38.Koberstein JT, Russell TP. Simultaneous SAXS-DSC study of multiple endothermic behavior in polyether-based polyurethane block copolymers. Macromolecules. 1986;19(3):714–720. [Google Scholar]
- 39.McLean RS, Sauer BB. Tapping-mode AFM studies using phase detection for resolution of nanophases in segmented polyurethanes and other block copolymers. Macromolecules. 1997;30(26):8314–8317. [Google Scholar]
- 40.Chen SH, Chang SL, Strey R. Structural evolution within the one-phase region of a three-component microemulsion system: Water–n-decane–sodium-bis-ethylhexylsulfosuccinate (AOT) J. Chem. Phys. 1990;93(3):1907–1918. [Google Scholar]
- 41.Yun S, Parrondo J, Zhang F, Ramani V. Microstructure-property relationships in sulfonated polyether ether ketone/silsesquioxane composite membranes for direct methanol fuel cells. J. Electrochem. Soc. 2014;161(9):F815–F822. [Google Scholar]
- 42.Aneja A, Wilkes GL. Hard segment connectivity in low molecular weight model ‘trisegment’polyurethanes based on monols. Polymer. 2004;45(3):927–935. [Google Scholar]
- 43.Bonart R, Muller EH. Phase Separation in Urethane Elastomers as Judged by Low-Angle X-Ray-Scattering .1. Fundamentals. Journal of Macromolecular Science-Physics B. 1974;10(1):177–189. [Google Scholar]
- 44.Ophir Z, Wilkes GL. Saxs Analysis of a Linear Polyester and a Linear Polyether Urethane - Interfacial Thickness Determination. Journal of Polymer Science Part B-Polymer Physics. 1980;18(6):1469–1480. [Google Scholar]
- 45.Vanbogart JWC, Gibson PE, Cooper SL. Structure-Property Relationships in Polycaprolactone-Polyurethanes. Journal of Polymer Science Part B-Polymer Physics. 1983;21(1):65–95. [Google Scholar]
- 46.Miller JA, Cooper SL. An Investigation of the Effect of Sample Preparation on the Thermal-Behavior and the Small-Angle X-Ray-Scattering of a Polyurethane Block Copolymer. Journal of Polymer Science Part B-Polymer Physics. 1985;23(5):1065–1077. [Google Scholar]
- 47.Leung LM, Koberstein JT. Small-Angle Scattering Analysis of Hard-Microdomain Structure and Microphase Mixing in Polyurethane Elastomers. Journal of Polymer Science Part B-Polymer Physics. 1985;23(9):1883–1913. [Google Scholar]
- 48.Velankar S, Cooper SL. Microphase separation and rheological properties of polyurethane melts. 1. Effect of block length. Macromolecules. 1998;31(26):9181–9192. [Google Scholar]
- 49.Guo Z, Park S, Wei S, Pereira T, Moldovan M, Karki AB, Young DP, Hahn HT. Flexible high-loading particle-reinforced polyurethane magnetic nanocomposite fabrication through particle-surface-initiated polymerization. Nanotechnology. 2007;18(33):335704. [Google Scholar]
- 50.DelRio E, Lligadas G, Ronda JC, Galia` M, Meier MAR, Ca´ Diz V. Polyurethanes from Polyols Obtained by ADMET Polymerization of aCastor Oil-Based Diene: Characterization and Shape Memory Properties. Journal of Polymer Science: Part A: Polymer Chemistry. 2011;49:518–525. [Google Scholar]
- 51.Rıo Ed, Lligadas G, Ronda JC, Galia` M, Ca´diz V, Meier MAR. Shape Memory Polyurethanes from Renewable Polyols Obtained by ATMET Polymerization of Glyceryl Triundec-10-enoate and 10-Undecenol. Macromol. Chem. Phys. 2011;212:1392–1399. [Google Scholar]
- 52.Qi H, Boyce M. Stress–strain behavior of thermoplastic polyurethanes. Mechanics of Materials. 2005;37(8):817–839. [Google Scholar]
- 53.Li G, Wang A. Cold, Warm, and Hot Programming of Shape Memory Polymers. Journal Of Polymer Science, Part B: Polymer Physics. 2016;54:1319–1339. [Google Scholar]
- 54.Runt JP, Fitzgerald JJ. Dielectric spectroscopy of polymeric materials. American Chemical Society. 1997 [Google Scholar]
Associated Data
This section collects any data citations, data availability statements, or supplementary materials included in this article.


