Our proposed prediction model on the basis of callosal angle and Evans index may serve as a screening tool to help the radiologist identify patients with possible normal-pressure hydrocephalus and recommend further volumetric assessment.
Abstract
Purpose
To assess the diagnostic performance of the callosal angle (CA) and Evans index (EI) measures and to determine their role versus automated volumetric methods in clinical radiology.
Materials and Methods
Magnetic resonance (MR) examinations performed before surgery (within 1–5 months of the MR examination) in 36 shunt-responsive patients with normal-pressure hydrocephalus (NPH; mean age, 75 years; age range, 58–87 years; 26 men, 10 women) and MR examinations of age- and sex-matched patients with Alzheimer disease (n = 34) and healthy control volunteers (n = 36) were studied. Three blinded observers independently measured EI and CA for each patient. Volumetric segmentation of global gray matter, white matter, ventricles, and hippocampi was performed by using software. These measures were tested by using multivariable logistic regression models to determine which combination of metrics is most accurate in diagnosis.
Results
The model that used CA and EI demonstrated 89.6%–93.4% accuracy and average area under the curve of 0.96 in differentiating patients with NPH from patients without NPH (ie, Alzheimer disease and healthy control). The regression model that used volumetric predictors of gray matter and white matter was 94.3% accurate.
Conclusion
CA and EI may serve as a screening tool to help the radiologist differentiate patients with NPH from patients without NPH, which would allow for designation of patients for further volumetric assessment.
© RSNA, 2017
Normal-pressure hydrocephalus (NPH) is characterized by often incapacitating gait dysfunction, cognitive impairment, and urinary incontinence, with the presence of enlarged ventricles despite normal intracranial pressure (1). Gait disorders are the initial manifestations; other symptoms appear as the disease progresses (2). Similar to Alzheimer disease (AD), the prevalence of NPH increases with age, reaching about 6% in those over 80 (3). Patients with NPH have variable ventriculomegaly, which may overlap with other populations. Ventricular volumes in NPH are on average well above 100 mL (4–6). There is a general agreement that NPH is complex and underdiagnosed, and a detailed characterization of its severity is lacking (2). The prevalence of NPH is estimated to be more than 2 000 000 cases in Europe and 700 000 cases in the United States (7). The mainstay of treatment is the placement of a ventricular shunt. Because this disorder is potentially treatable, research focused on improving diagnosis through noninvasive imaging techniques (8,9). Many neurodegenerative diseases with overlapping symptoms affect elderly patients, which makes radiologic differentiation difficult (9,10). For example, when neuroradiologists were asked to independently evaluate T1-weighted brain magnetic resonance (MR) images as either of patients with NPH, patients with AD, or elderly healthy control (HC) volunteers, the diagnostic accuracy was 68%–78%, and the agreement was only fair (intraclass correlation coefficient [ICC], 0.51; 95% confidence interval: 0.34, 0.66) (11).
Imaging biomarkers of NPH include linear measures such as the Evans index (EI) (12,13), callosal angle (CA) (14), disproportionate sulci (15), and volumetric analysis (11,16). EI is a component of the NPH diagnostic criteria in both the United States (16) and Japan (14). Unfortunately, the diagnostic sensitivity and specificity of EI and CA are controversial (10,12,17–19), and therefore their role has remained limited.
Here we seek to assess the diagnostic performance of CA and EI measures and to determine their role versus automated volumetric methods in clinical radiology.
Materials and Methods
Demographics and Clinical Data
This study was approved by the institutional research board with a waiver of consent and was Health Insurance Portability and Accountability Act–compliant. For each patient from the AD Neuroimaging Initiative (ADNI) database, informed consent approved by the institutional review board at each study site was obtained.
We selected patients with NPH from our adult hydrocephalus clinic. Participants in the ADNI were used as both patients with AD and HC volunteers (Table 1).
Table 1.
Demographic Characteristics and Brain Measures
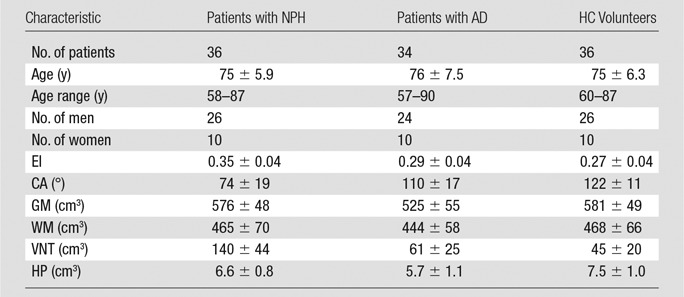
Note.—Data are mean ± standard deviation unless otherwise indicated. The brain measures are traditional linear and automated. GM = gray matter, WM = white matter, VNT = ventricular volume, HP = hippocampal volume.
Clinical Tests
Functional ambulation performance is a quantitative, well-validated composite gait measure on the basis of step length, symmetry, and velocity, and the scores range from 95 to 100 in healthy adults (20,21). In our patients, functional ambulation performance was determined by using the GaitRite system (CIR Systems, Havertown, Pa) (21).
NPH Group
Patients referred to our adult hydrocephalus clinic for symptoms of gait impairment (regardless of the presence of cognitive or urologic dysfunction) and enlarged ventricles were examined by a neurologist (J.G., with 25 years of adult clinical neurology experience). The clinical diagnosis of probable NPH was performed on the basis of enlarged ventricles, a characteristic dyspraxic disorder, and exclusion of other confounding diagnoses (eg, neurodegenerative diseases and myelopathy). From the initial chart review of patients from the adult hydrocephalus clinic from January 2003 through December 2014 (n = 624), we selected patients who (a) completed a high-volume lumbar puncture or lumbar drain that resulted in a significant clinical improvement (ie, improvement in functional ambulation performance score, and clinician [J.G.] and family’s subjective impression of gait improvement) (n = 101); (b) had available preoperative 1.5-T or 3-T MR examination performed locally that included high-resolution magnetization-prepared rapid gradient-echo (MPRAGE) sequence (n = 60); (c) successfully completed ventricular shunt placement procedure at our institution and subsequently demonstrated significant clinical improvement (n = 54); and (d) were free of comorbidities such as cerebrovascular disease, coexisting intracranial mass lesion, or previous craniectomy identified by a neuroradiologist (A.G.). The final sample size was 36 patients. The majority (65 patients) excluded from the study failed to meet criteria mentioned in a.
Gait impairment is the principal symptom that affects older adults with NPH (22) and the parameter most likely to improve with shunt surgery (23,24); hence, we chose gait impairment as the primary criterion for verifying shunt and lumbar puncture response. In a review, Klinge et al (25) determined there is no consensus regarding the use of any standardized clinical scale for defining a positive response to shunt placement. We classified patients as having improved on the basis of an increase in the functional ambulation performance score, clinician judgement of gait improvement after comparing pre- and postsurgical video clips, and the opinion of the patient or his or her family that a favorable response occurred. We excluded participants who did not meet these criteria to ensure high confidence of accurate NPH diagnosis. We excluded participants who did not demonstrate this positive response to shunt to minimize confounding of comorbid neurodegenerative disorders. All clinical evaluations performed after shunt were performed on average 10 months after surgery (range, 6–18 months). Fifteen patients with NPH were previously reported (11) by using a voxel-based segmentation method rather than the subvoxel vertex-based tissue segmentation method used in this study. There was no overlap in remaining 70 reference patients (ie, patients without NPH). Overall, the overlap was 14.1% (15 of 106).
Patients with AD and HC Volunteers
Patients with AD and HC volunteers were selected from the ADNI database, which is a longitudinal, multicenter study designed to develop multimodality biomarkers for the early detection and tracking of AD. Extensive demographics, family history, and medical history are available for all ADNI participants.
We set the following three rejection criteria for both patients with AD and HC volunteers: (a) gait impairment, urinary incontinence, or signs of Parkinsonism; (b) major depression or other psychiatric diagnosis likely to confound cognitive assessment; and (c) medical illnesses associated with cognitive impairment, such as metabolic abnormalities, or other structural brain changes. Criteria b and c are met by all ADNI participants. We examined the ADNI database to ensure all participants met the remaining requirement a. We then matched the AD and HC groups with the NPH group for sex and sample size.For the groups, we obtained 34 patients with AD and 36 HC volunteers.
MR Image Acquisition
All participants had high-resolution T1-weighted MR images acquired by using an MPRAGE sequence. All patients with NPH were imaged by using one of several local MR imaging systems (Siemens AG, Erlangen, Germany) 1–5 months before shunt placement. We used local three-dimensional MPRAGE sequence for 3-T imaging (repetition time msec/echo time msec/inversion time msec, 2100–2200/2.3–4.0/1100; flip angle, 9°–12°; 256 × 256 × 192 matrix; voxel size, 0.8–1.0 mm; and bandwidth, 200/260 Hz/pixel) and 1.5-T imaging (2100–2200/3.8–4.0/1100; flip angle, 12°; 256 × 256 × 160 matrix; voxel size, 0.1–1.0 mm; and bandwidth, 160/200 Hz/pixel).
Images of control patients (both HC patients and patients with AD from ADNI) were acquired with a variety of 1.5-T and 3-T MR imaging systems that used the same T1-weighted MPRAGE sequence. Each ADNI MR imaging examination had to pass screening for blurring, ghosting, and flow artifacts; image homogeneity; signal-to-noise ratio; susceptibility artifacts; and gray-white cerebrospinal fluid contrast. For patients from ADNI, we used T1-weighted MPRAGE sequences performed with a 3-T imager (2300/2.98/853; flip angle, 9°; 256 × 256 × 192 matrix; nonisotropic 1.0 × 1.0 × 1.2 mm voxels; and bandwidth, 240 Hz/pixel) and a 1.5-T imager (2400/3.5/1000; flip angle, 8°; 192 × 192 × 160 matrix; 1.2 × 1.2 × 1.25 mm voxels; and bandwidth, 180 Hz/pixel).
Effect of MPRAGE Protocol on Automated Segmentation
We performed two prospective analyses for an additional 13 patients (seven men, six women; age range, 39–94 years) to examine the within-patient effects of different MPRAGE protocols. We assessed the systematic bias and the discrepancy for gray matter, white matter, ventricular, and hippocampal volumes.
For comparisons between the ADNI and the local MPRAGE, eight patients (for whom informed consent was obtained) from the adult hydrocephalus clinic scheduled for diagnostic MR imaging during September 2016 were chosen at random and imaged twice, first by using ADNI MPRAGE protocol and then by using the local MPRAGE protocol on the same 1.5-T imager (Avanto; Siemens) in consecutive examinations.
For comparison between 1.5-T versus 3-T magnetic field strength, we randomly selected five individuals from the ADNI database who underwent two MR examinations within 6 months: one examination with a 1.5-T imager (Avanto; Siemens) and the second with a 3-T imager (Prisma; Siemens).
Traditional Measures
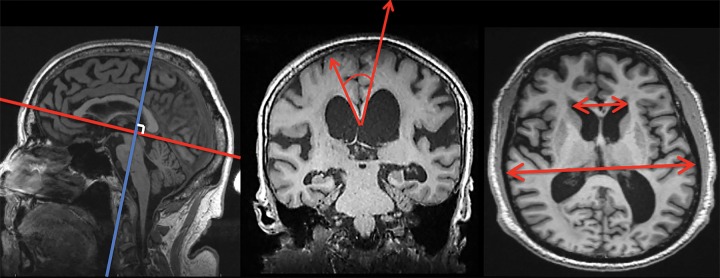
Three observers, blinded to clinical data and imager information, independently measured EI and CA. The observers were two resident physicians (H.P. and N.M., with 1 and 2 years of experience, respectively) and one neuroradiologist (A.G., with 45 years of experience). The structures involved in this study are part of fundamental neuroanatomy expected during medical school training. By using T1-weighted MPRAGE sequences at the midsagittal plane, a reformatted coronal section was generated at the level of the posterior commissure, perpendicular to a plane that intersected the anterior and posterior commissure (Fig 1). The reformatted images were directly provided to the observers. CA was determined by using the methods of Ishii et al (14) as the angle between the medial superior borders of the left and right lateral ventricles (Fig 1). EI was determined by the maximum transverse frontal horn ventricular width divided by the maximum transverse internal skull diameter (26) (Fig 1). A Picture Archiving and Communications in Medicine multiplanar reconstruction tool (Intellispace PACS Enterprise v4.4.516; Philips Healthcare, Amsterdam, the Netherlands) was used for three-dimensional reformatting. This combined process took an average of 4 minutes per case.
Figure 1:
By using MPRAGE sequences, a coronal plane was obtained at the level of the posterior commissure from each observer’s best approximation (blue and red lines, left), with plane oriented 90° to anterior-posterior commissure line. By using the plane at this level, CA was determined (red arrows, middle) as the angle between the superior borders of the lateral ventricles. EI was determined on transaxial view by measuring the largest left-to-right width of the frontal horns divided by the largest left-to-right extent the skull (red arrows, right).
Volumetric Tissue Segmentation
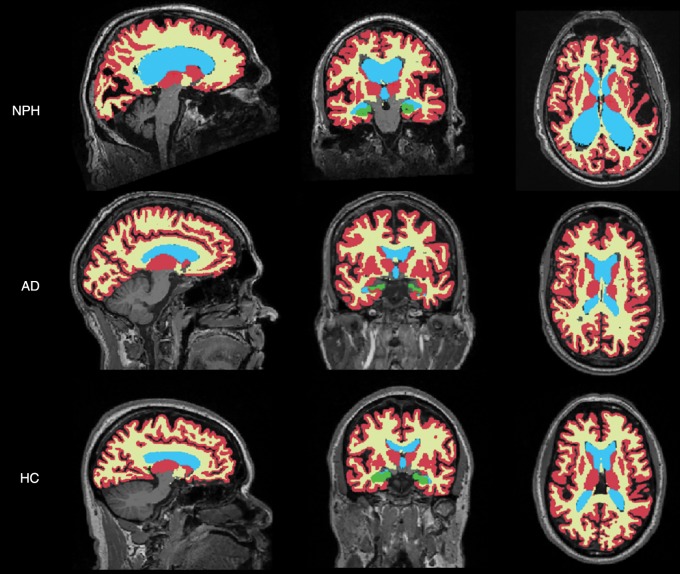
Segmentation of global gray matter, white matter, ventricle, and hippocampus (left and right) was performed by using software (FreeSurfer version 5.1; http://surfer.nmr.mgh.harvard.edu). These measures for both AD and HC groups were obtained directly from the ADNI database, which used the same software (FreeSurfer 5.1) to perform these segmentations. Demonstration of the obtained regions of interest is shown in Figure 2. This process took approximately 8 hours per case.
Figure 2:
Sample sagittal (left), posterior coronal (middle), and midtransaxial (right) segmentation masks overlaid on T1-weighted MR images of shunt-responsive NPH, definitive AD, and HC volunteers. These images show gray matter (in red), white matter (in yellow), ventricular (in blue), and hippocampal (in green) regions.
Data Analysis
ICC was used to assess interobserver variability. Multivariable logistic regression models were used to predict NPH (27). One of the outcomes of the logistic regression model is the estimated probability of NPH for each patient. We used the cutoff of 0.5 to predict the outcome. We then computed the model’s accuracy, sensitivity, and specificity. The diagnostic accuracy was also reported by using the area under the operating characteristic curve estimated from probability of NPH. A formula (Excel; Microsoft, Redmond, Wash) to calculate probability of NPH was directly derived from the regression model.
The Akaike information criterion was used as a measure of the relative quality of a model that included a penalty for increasing the number of free variables to discourage overfitting.
Analysis of variance was used to compare mean values of individual variables across study groups. All statistical analyses were performed by using statistical software (SPSS version 23; IBM, Armonk, NY).
Results
Demographics of the three patient groups are listed in Table 1. There was no significant difference among the three groups regarding age (analysis of variance; F = 0.33; P = .72) or sex (χ2 = 0.03; P = .98).
The quantitative functional ambulation performance gait score showed a significant (P = .02) improvement from 71.1 ± 16.3 (standard deviation) before shunt to 80.3 ± 14.5 after shunt.
Estimated tissue volume bias (V3T − V1.5T) because of differences in magnetic field strength was 25.0 mL for gray matter, −34.3 mL for white matter, 2.0 mL for ventricle, and 0.10 mL for hippocampus. Relative to mean value, the bias was 4.20% for gray matter, −7.4% for white matter, 4.8% for ventricle, and 3.2% for hippocampus. The systematic bias (Vlocal − VADNI) because of the use of different T1-weighted MPRAGE sequences was estimated to be 5.9 mL for gray matter, −1.6 mL for white matter, 0 mL for ventricle, and 0.24 mL for hippocampus. Relative to mean value, the bias was 1.0% for gray matter, −0.4% for white matter, 0% for ventricle, and 1.3% for hippocampus. For each of these four measures, the effect of the MPRAGE protocol was also less than 0.1 of the standard deviation of that measure.
ICCs showed very good interobserver agreement for CA (ICC, 0.92; 95% confidence interval: 0.89, 0.95) and good agreement for EI (ICC, 0.81; 95% confidence interval: 0.73, 0.87).
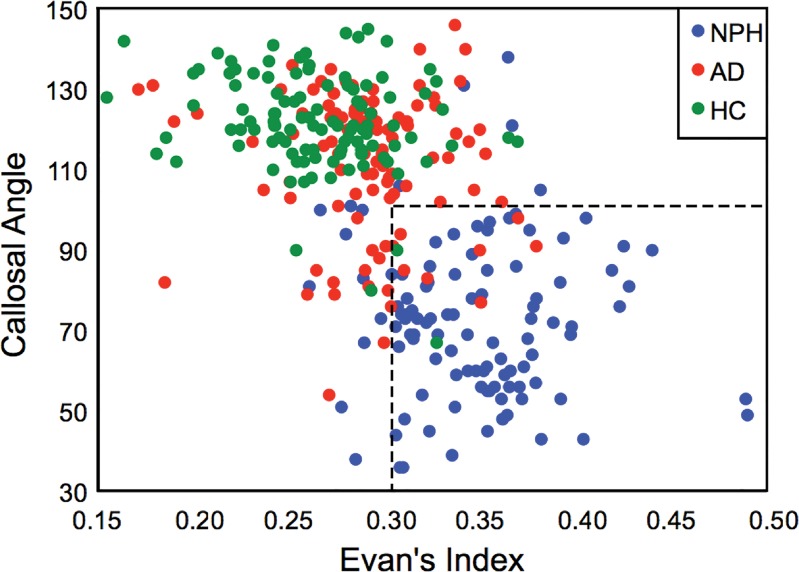
Clinically useful cutoffs were obtained to identify and distinguish NPH from the non-NPH patient groups of AD and HC (Fig 3). These cutoffs were obtained by combining the measurements from three observers and systematically varying the cutoff levels to maximize diagnostic accuracy. For CA, a cutoff of 100° was 88.7% (282 318) accurate for identification of patients with NPH, and measurements below the cutoff suggested NPH. The sensitivity and specificity for this cutoff were 87.0% (94 of 108) and 89.5% (188 of 210), respectively. For EI, a cutoff of 0.32 was 81.4% (259 of 318) accurate for identification of patients with NPH, and measurements above the cutoff suggested NPH. The sensitivity and specificity of this cutoff were 71.3% (77 of 108) and 86.7% (182 of 210), respectively. The range of areas under the curve was 0.96–0.97, depending on the observer.
Figure 3:
Scatterplot demonstrates the cutoff values of CA and EI that separate patients with NPH from patients who do not have NPH (ie, patients with AD and HC volunteers).
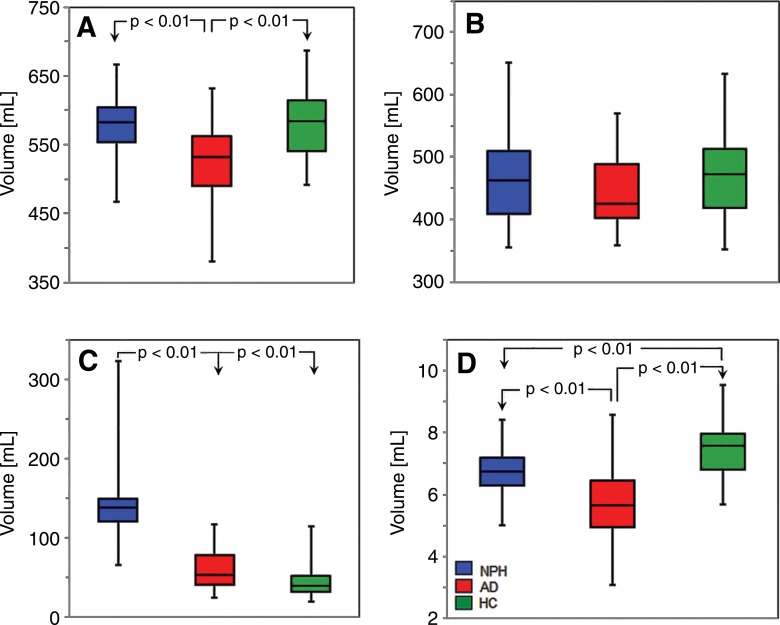
Table 1 and Figure 4 show group distribution of gray matter, white matter, ventricular, and hippocampal volumes. Gray matter volumes differed across the patient groups (F = 13.1; P < .0001). Average gray matter volume in AD was significantly lower than in NPH or HC volunteers (Tukey honest significant difference test, P < .01). Notably, there was no significant difference in mean gray matter volumes between NPH and HC groups. There was no difference in mean white matter volume between groups (F = 1.5; P = .239). Ventricular volume differences across the three groups were statistically significant (F = 93.7; P < .0001). Average ventricular volume in patients with NPH was greater than the average ventricular volume in both patients with AD and HC volunteers (Tukey honest significant difference test, P < .01); however, there was only a trend (P = .072) for ventricular volume to differ between AD and HC groups. Differences in the hippocampus across the three groups were significant (F = 28.49; P < .0001). Mean volume of the hippocampus in patients with AD was less than mean volume of the hippocampus in HC and NPH groups (Tukey honest significant difference test, P < .01). In addition, the mean volume of hippocampus in the HC group was greater than that of the NPH group (Tukey honest significant difference test, P < .01).
Figure 4:
Box-and-whisker plots of segmentation parameters across the three patient groups. The plots show, A, gray matter, B, white matter, C, ventricles, and, D, hippocampi.
Table 2 shows the results of multivariate binary logistic regression models constructed for each reader separately to diagnose NPH (ie, a positive finding). For each reader, CA and EI significantly contributed to diagnostic prediction, which suggested an independent, synergistic contribution of the two values. Also included is the performance of volumetric model by using two predictors: gray matter volume and ventricle volume. Measures of white matter and hippocampus were not statistically significant predictors.
Table 2.
Results from Two Types of Multivariate Logistic Regression Models to Distinguish NPH from Non-NPH Patients
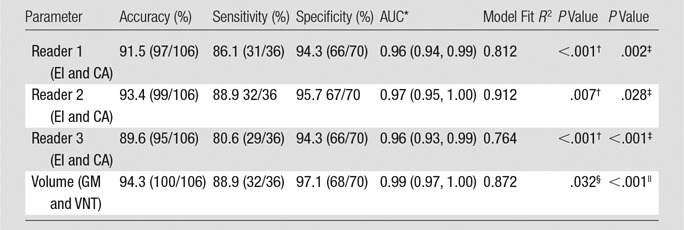
Note—Data in parentheses are numerator and denominator unless otherwise indicated. NPH was considered to be a positive finding; non-NPH (ie, patients with AD and HC patients) was considered to be a negative finding. AUC = area under the curve, GM = gray matter volume, VNT = ventricular volume.
*Data in parentheses are 95% confidence interval.
† P value corresponds to CA.
‡P value corresponds to EI.
§P value corresponds to gray matter.
|| P value corresponds to ventricular volume.
Table 3 demonstrates the performance of multinomial regression models to distinguish patients with NPH versus AD versus HC volunteers (ie, for simultaneous diagnosis of one of the three outcomes). Unlike the model based on the volumetric measures, the model based on CA and EI performs poorly in classifying both patients with AD and HC volunteers. Finally, Table 4 demonstrates that as we progressively excluded cases with the largest ventricular volumes, the diagnostic accuracy of the volumetric model remained above 90%. The sensitivity and diagnostic accuracy of these groups overlapped, indicating no statistically significant difference in this subgroup analysis.
Table 3.
Performance of Three-Way Diagnostic Classification Models

Note.—Data in parentheses are numerator and denominator. AIC = Akaike information criterion.
*Generalized R2.
† On the basis of observer with median accuracy.
Table 4.
Simulated Exclusion of Patients with NPH with Largest Ventricular Volume

Note.—Data in parentheses are numerator and denominator. VNT = ventricular volume. All volumes are in cubic centimeters.
*Number of patients with NPH who remain in the analysis.
† Data are ± standard deviation.
An online tool (NPH Calculator; http://cai2r.net/sites/default/files/software/NPH_calculator.xlsx) derived from this multivariate regression model was created to quantify probability of NPH on the basis of input CA and EI values.
Discussion
This study compared the accuracy of traditional measures of NPH, namely CA and EI, with segmentation metrics for diagnosis. Our results yielded cutoffs for CA and EI (≤100° and ≥0.32, respectively). Patients who meet one of the criteria should be categorized as probable NPH. These objective cutoffs are clinically relevant, and research showed that visual assessment alone exhibits poor diagnostic accuracy for NPH (12,27). We also demonstrated the utility of a prediction model that combines CA and EI to diagnose shunt-responsive NPH and differentiate it from confounding imaging features of both patients with AD and HC volunteers. Diagnosis derived from these rapidly obtainable values by using our tool demonstrated modest accuracy, sensitivity, and sensitivity.
We also showed that the predictive model on the basis of combined CA and EI measures demonstrated comparable accuracy to our previously proposed model, which was based on ventricular and gray matter volumes (11) in the distinction between NPH and non-NPH. However, CA and EI are not sufficient to accurately discriminate patients with AD from HC volunteers. This task greatly benefits from volumetric segmentation. Volumetric assessments require more infrastructure and may take several hours to generate, but they further categorize patients with age-related comorbidities. Thus, our proposed prediction model on the basis of CA and EI may serve as a screening tool to help the radiologist identify patients with possible NPH and recommend further volumetric assessment.
Ambarki et al (28) reported that EI poorly predicts ventricular volume and questioned the use of EI alone as a marker of enlarged ventricles. Ishii et al (14) studied 34 presumed NPH cases on the basis of positive response to lumbar puncture. By using thresholds of CA of 90° or less and EI of 30% or greater to predict NPH, they reported accuracy of 96%, sensitivity of 97%, and specificity of 94% in the distinction between probable NPH (defined as symptomatic improvement after lumbar puncture) and AD. However, they did not attempt a three-way discrimination between patients with AD, patients with NPH, and nondemented elderly control patients. Our results support this result. We provided slightly different cutoff values derived from a mostly white population and an online tool to estimate probability of NPH. The current larger patient sample confirms our previous work (11) with highly accurate three-way differential diagnosis that uses the volumetric model.
There are several limitations to this study that need to be considered when interpreting the data. Whereas our NPH population was limited to patients who responded to shunt placement, it is controversial whether this exclusion constitutes a selection bias. Without a documented response to shunt placement, we cannot definitively diagnose NPH. Furthermore, our study groups were imaged by using different protocols, but we corrected the bias caused by this technical limitation. Additionally, we classified patients as with either AD or NPH, and we did not attempt to distinguish the poorly characterized group of patients with comorbid AD and NPH (4,24). However, our statistical model did compute the probabilities of AD and NPH, which allows future studies to address this limitation and consider an additional comorbid AD and NPH group. Similarly, our study did not address patients with NPH with smaller than average ventricles. It is possible that these patients may fall into the aforementioned comorbid category. Interestingly, when we tested the accuracy of the volumetric model by progressively eliminating patients with the largest ventricles, there was no statistically significant change between the overall volumetric model and the volumetric model based on the NPH group with smaller ventricles. Finally, our current model only studies ventricular cerebrospinal fluid and ignores extraventricular cerebrospinal fluid (sulcal size and shape).
In future studies, we plan to incorporate sulcal morphologic analysis into our predictive model and discriminate between AD, NPH, and comorbid categories. We also plan to analyze volumetric measures of patients presumed to have NPH who did not respond to high-volume lumbar puncture or spinal drain procedures to identify imaging features that may predict response to cerebrospinal fluid removal.
Advances in Knowledge
■ Callosal angle (CA) and Evans index (EI) combined provide good accuracy (average area under the curve, 0.96) to differentiate patients with normal-pressure hydrocephalus (NPH) from patients who do not have NPH (ie, patients with Alzheimer disease [AD] and healthy control [HC] volunteers) and may serve as an accurate screening tool for NPH.
■ The range for discrimination between patients with NPH and patients who do not have NPH on the basis of combination of CA and EI is 89.6%–93.4% depending on the reader, and it is comparable to 94.3% accuracy of volumetric assessment.
■ Volumetric assessment is superior to the combination of CA and EI in a three-way analysis that discriminates between NPH, AD, and HC (overall classification accuracy, 88.7% vs 71.7%).
Implications for Patient Care
■ Clinically useful simple cutoffs may be used as part of a screening tool for patients with NPH versus patients who do not have NPH at MR imaging.
■ Segmentation metrics may be used as a secondary tool after CA and EI in equivocal cases for more resource intensive but more accurate distinction of NPH from AD or HC.
Acknowledgments
Acknowledgment
Part of the data used in preparation of this article was obtained from the ADNI database (adni.loni.usc.edu). As such, the investigators within the ADNI contributed to the design and implementation of ADNI and/or provided data but did not participate in analysis or writing of this report. A complete listing of ADNI investigators can be found at http://adni.loni.usc.edu/wp-content/uploads/how_to_apply/ADNI_Acknowledgement_List.pdf.
Received May 27, 2016; revision requested July 27; revision received November 14; accepted December 13; final version accepted February 17, 2017.
Data collection and sharing for ADNI supported by National Institutes of Health (U01 AG024904), including the National Institute on Aging, the National Institute of Biomedical Imaging and Bioengineering, and through contributions from Alzheimer’s Association; Alzheimer’s Drug Discovery Foundation; BioClinica; Biogen Idec; Bristol-Myers Squibb; Eisai; Elan Pharmaceuticals; Eli Lilly and Company; F. Hoffmann-La Roche and its affiliated company Genentech; GE Healthcare; Innogenetics; IXICO; Janssen Alzheimer Immunotherapy Research and Development; Johnson and Johnson Pharmaceutical Research and Development; Medpace; Merck; Meso Scale Diagnostics; NeuroRx Research; Novartis Pharmaceuticals Corporation; Pfizer; Piramal Imaging; Servier; Synarc; and Takeda Pharmaceutical Company. The Canadian Institutes of Health Research provided funds to support ADNI clinical sites in Canada. Private-sector contributions are facilitated by the Foundation for the National Institutes of Health. The grantee organization is the Northern California Institute for Research and Education, and the study is coordinated by the Alzheimer’s Disease Cooperative Study at the University of California, San Diego. ADNI data are disseminated by the Laboratory for Neuro Imaging at the University of Southern California.
N.M. and H.R. contributed equally to this work.
Disclosures of Conflicts of Interest: N.M. disclosed no relevant relationships. H.P. disclosed no relevant relationships. A.M.F. disclosed no relevant relationships. B.A.A. disclosed no relevant relationships. A.L. disclosed no relevant relationships. B.E.D. disclosed no relevant relationships. C.S. disclosed no relevant relationships. Y.S. disclosed no relevant relationships. J.G. disclosed no relevant relationships. O.G. disclosed no relevant relationships. H.R. Activities related to the present article: disclosed no relevant relationships. Activities not related to the present article: author disclosed a pending patent for the system, method, and computer-accessible medium for the probabilistic determination of normal-pressure hydrocephalus. Other relationships: disclosed no relevant relationships. A.E.G. disclosed no relevant relationships.
Abbreviations:
- AD
- Alzheimer disease
- ADNI
- AD Neuroimaging Initiative
- CA
- callosal angle
- EI
- Evans index
- HC
- healthy control
- ICC
- intraclass correlation coefficient
- MPRAGE
- magnetization-prepared rapid gradient echo
- NPH
- normal-pressure hydrocephalus
References
- 1.Adams RD, Fisher CM, Hakim S, Ojemann RG, Sweet WH. Symptomatic occult hydrocephalus with “normal” cerebrospinal-fluid pressure. A treatable syndrome. N Engl J Med 1965;273(3):117–126. [DOI] [PubMed] [Google Scholar]
- 2.Williams MA, Relkin NR. Diagnosis and management of idiopathic normal-pressure hydrocephalus. Neurol Clin Pract 2013;3(5):375–385. [DOI] [PMC free article] [PubMed] [Google Scholar]
- 3.Martín-Láez R, Caballero-Arzapalo H, Valle-San Román N, LÁ López-Menéndez, Arango-Lasprilla JC, Vázquez-Barquero A. Incidence of idiopathic normal-pressure hydrocephalus in Northern Spain. World Neurosurg 2016;87:298–310. [DOI] [PubMed] [Google Scholar]
- 4.Tsunoda A, Mitsuoka H, Bandai H, Endo T, Arai H, Sato K. Intracranial cerebrospinal fluid measurement studies in suspected idiopathic normal pressure hydrocephalus, secondary normal pressure hydrocephalus, and brain atrophy. J Neurol Neurosurg Psychiatry 2002;73(5):552–555. [DOI] [PMC free article] [PubMed] [Google Scholar]
- 5.Palm WM, Walchenbach R, Bruinsma B, et al. Intracranial compartment volumes in normal pressure hydrocephalus: volumetric assessment versus outcome. AJNR Am J Neuroradiol 2006;27(1):76–79. [PMC free article] [PubMed] [Google Scholar]
- 6.Yamada S, Ishikawa M, Yamamoto K. Comparison of CSF distribution between idiopathic normal pressure hydrocephalus and Alzheimer disease. AJNR Am J Neuroradiol 2016;37(7):1249–1255. [DOI] [PMC free article] [PubMed] [Google Scholar]
- 7.Jaraj D, Rabiei K, Marlow T, Jensen C, Skoog I, Wikkelsø C. Prevalence of idiopathic normal-pressure hydrocephalus. Neurology 2014;82(16):1449–1454. [DOI] [PMC free article] [PubMed] [Google Scholar]
- 8.Bradley WG, Jr, Scalzo D, Queralt J, Nitz WN, Atkinson DJ, Wong P. Normal-pressure hydrocephalus: evaluation with cerebrospinal fluid flow measurements at MR imaging. Radiology 1996;198(2):523–529. [DOI] [PubMed] [Google Scholar]
- 9.Miyati T, Mase M, Kasai H, et al. Noninvasive MRI assessment of intracranial compliance in idiopathic normal pressure hydrocephalus. J Magn Reson Imaging 2007;26(2):274–278. [DOI] [PubMed] [Google Scholar]
- 10.Lee WJ, Wang SJ, Hsu LC, Lirng JF, Wu CH, Fuh JL. Brain MRI as a predictor of CSF tap test response in patients with idiopathic normal pressure hydrocephalus. J Neurol 2010;257(10):1675–1681. [DOI] [PubMed] [Google Scholar]
- 11.Serulle Y, Rusinek H, Kirov, et al. Differentiating shunt-responsive normal pressure hydrocephalus from Alzheimer disease and normal aging: pilot study using automated MRI brain tissue segmentation. J Neurol 2014;261(10):1994–2002. [DOI] [PubMed] [Google Scholar]
- 12.Toma AK, Holl E, Kitchen ND, Watkins LD. Evans’ index revisited: the need for an alternative in normal pressure hydrocephalus. Neurosurgery 2011;68(4):939–944. [DOI] [PubMed] [Google Scholar]
- 13.Evans WA, Jr. An encephalographic ratio for estimating ventricular enlargement and cerebral atrophy. Arch Neurol Psychiatry 1942;47(6):931–937. [Google Scholar]
- 14.Ishii K, Kanda T, Harada A, et al. Clinical impact of the callosal angle in the diagnosis of idiopathic normal pressure hydrocephalus. Eur Radiol 2008;18(11):2678–2683. [DOI] [PubMed] [Google Scholar]
- 15.Hashimoto M, Ishikawa M, Mori E, Kuwana N; Study of INPH on neurological improvement (SINPHONI). Diagnosis of idiopathic normal pressure hydrocephalus is supported by MRI-based scheme: a prospective cohort study. Cerebrospinal Fluid Res 2010;7:18. [DOI] [PMC free article] [PubMed] [Google Scholar]
- 16.Relkin N, Marmarou A, Klinge P, Bergsneider M, Black PM. Diagnosing idiopathic normal-pressure hydrocephalus. Neurosurgery 2005;57(3 Suppl):S4–S16; discussion ii–v. [DOI] [PubMed] [Google Scholar]
- 17.George AE, Holodny A, Golomb J, de Leon MJ. The differential diagnosis of Alzheimer’s disease. Cerebral atrophy versus normal pressure hydrocephalus. Neuroimaging Clin N Am 1995;5(1):19–31. [PubMed] [Google Scholar]
- 18.Holodny AI, George AE, de Leon MJ, Golomb J, Kalnin AJ, Cooper PR. Focal dilation and paradoxical collapse of cortical fissures and sulci in patients with normal-pressure hydrocephalus. J Neurosurg 1998;89(5):742–747. [DOI] [PubMed] [Google Scholar]
- 19.Tarnaris A, Kitchen ND, Watkins LD. Noninvasive biomarkers in normal pressure hydrocephalus: evidence for the role of neuroimaging. J Neurosurg 2009;110(5):837–851. [DOI] [PubMed] [Google Scholar]
- 20.Nelson AJ. Analysis of movement through utilisation of clinical instrumentation. Physiotherapy 1976;62(4):123–124. [PubMed] [Google Scholar]
- 21.Nelson AJ, Zwick D, Brody S, et al. The validity of the GaitRite and the Functional Ambulation Performance scoring system in the analysis of Parkinson gait. NeuroRehabilitation 2002;17(3):255–262. [PubMed] [Google Scholar]
- 22.Fisher CM. Hydrocephalus as a cause of disturbances of gait in the elderly. Neurology 1982;32(12):1358–1363. [DOI] [PubMed] [Google Scholar]
- 23.Graff-Radford NR, Godersky JC. Normal-pressure hydrocephalus. Onset of gait abnormality before dementia predicts good surgical outcome. Arch Neurol 1986;43(9):940–942. [DOI] [PubMed] [Google Scholar]
- 24.Golomb J, Wisoff J, Miller DC, et al. Alzheimer’s disease comorbidity in normal pressure hydrocephalus: prevalence and shunt response. J Neurol Neurosurg Psychiatry 2000;68(6):778–781. [DOI] [PMC free article] [PubMed] [Google Scholar]
- 25.Klinge P, Marmarou A, Bergsneider M, Relkin N, Black PM. Outcome of shunting in idiopathic normal-pressure hydrocephalus and the value of outcome assessment in shunted patients. Neurosurgery 2005;57(3 Suppl):S40–S52; discussion ii–v. [DOI] [PubMed] [Google Scholar]
- 26.Orrison WW. Neuroimaging. Philadelpha, Pa: Saunders, 2000. [Google Scholar]
- 27.Agresti A. Categorical data analysis. 2nd ed. Hoboken, NJ: Wiley, 2002. [Google Scholar]
- 28.Ambarki K, Israelsson H, Wåhlin A, Birgander R, Eklund A, Malm J. Brain ventricular size in healthy elderly: comparison between Evans index and volume measurement. Neurosurgery 2010;67(1):94–99; discussion 99. [DOI] [PubMed] [Google Scholar]


