Abstract
Continual advancements in the development of synchrotron radiation sources have resulted in X-ray based spectroscopic techniques capable of probing the electronic and structural properties of numerous systems. This review gives an overview of the application of metal K-edge and L-edge X-ray absorption spectroscopy (XAS), as well as K resonant inelastic X-ray scattering (RIXS), to the study of electronic structure in transition metal sites with emphasis on experimentally quantifying 3d orbital covalency. The specific sensitivities of K-edge XAS, L-edge XAS, and RIXS are discussed emphasizing the complementary nature of the methods. L-edge XAS and RIXS are sensitive to mixing between 3d orbitals and ligand valence orbitals, and to the differential orbital covalency (DOC), that is, the difference in the covalencies for different symmetry sets of the d orbitals. Both L-edge XAS and RIXS are highly sensitive to and enable separation of and donor bonding and back bonding contributions to bonding. Applying ligand field multiplet simulations, including charge transfer via valence bond configuration interactions, DOC can be obtained for direct comparison with density functional theory calculations and to understand chemical trends. The application of RIXS as a probe of frontier molecular orbitals in a heme enzyme demonstrates the potential of this method for the study of metal sites in highly covalent coordination sites in bioinorganic chemistry.
Keywords: X-ray absorption spectroscopy, X-ray emission spectroscopy, transition metal ion active sites, covalency, electronic structure, resonant inelastic X-ray scattering, bioinorganic chemistry
1. Introduction
Over the past several decades, improvements in synchrotron radiation storage ring capabilities have revolutionized X-ray spectroscopy. As shown in Figure 1.1, the original laboratory X-ray sources, X-ray tubes, had relatively low brilliance and there was little improvement in performance over half a century [1]. Starting in the 1960’s, it was recognized that storage rings that accelerate electrons also generate continuous-energy X-rays as a byproduct that could be used for X-ray spectroscopy, among other techniques. Second generation synchrotrons were then built for the dedicated purpose of X-ray science, in contrast to first generation accelerators that were primarily for high-energy physics. Reduced beam emittance, together with undulator insertion devices gave rise to the third generation synchrotrons currently in widespread use. Since 2009, X-ray free electron lasers (XFELs) have become operational, which have much higher brilliance and extremely short X-ray pulses that allow for sub-ps time-resolved experiments. Synchrotrons are also capable of generating X-rays across a large range of energies, from ~0.1 to >150 keV, and typically have monochromators that allow for precise selection of the X-ray energy. These advantages have allowed for a great expansion in X-ray spectroscopic techniques. One such technique, variable energy photoemission spectroscopy was reviewed by us in an earlier Coordination Chemistry Reviews (CCR) article [2].
Figure 1.1.
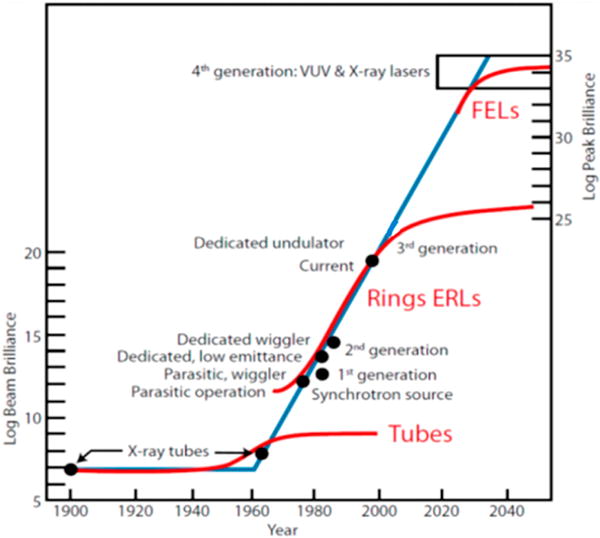
X-ray brilliance (photons/s/mm2/mrad2/0.1%BW) with orders of magnitude increase as a function of time. Tubes represent X-ray tubes generally used in a laboratory, “Rings”: synchrotron radiation storage rings facilities, “ERLs”: energy recovery LINACs, XFELs: X-ray free electron lasers. Figure was reproduced from Ref. [102], with permission of the copyright holders.
The development of synchrotrons has enabled X-ray absorption spectroscopy (XAS) for a range of challenging experiments. Different XAS techniques have been used to study the bonding of metal coordination complexes and are explored in this review. Metal K-edge XAS utilizes hard X-rays (>4 keV) to excite 1s electrons. The K-edge spectrum is divided into two regions, the X-ray absorption near edge structure (XANES) region, which provides electronic structure and local geometric information (Section 2), and the extended X-ray absorption fine structure (EXAFS) region, which is used to obtain detailed structural information, such as bond lengths in different coordination shells, coordination numbers, and nearest neighbor atomic type [3–8]. However, analysis of the XANES region suffers due to the poor energy resolution at the metal K-edge (> 1 eV for 3d metals) caused by the short lifetime of the 1s core hole. In contrast, soft X-rays (0.1–2 keV) can be used to excite 2p electrons into unoccupied valence orbitals in transition metal L-edge XAS, providing a direct probe of the covalency in transition metal coordination complexes with better resolution (< 0.5 eV for 3d metals, Section 3). Because of the use of soft X-rays with limited penetration depth and in vacuo challenges, some systems, such as dilute protein solutions, are inaccessible by L-edge XAS. Resonant inelastic X-ray scattering (RIXS), an X-ray analog to resonance Raman spectroscopy, provides a complementary technique to K- and L-edge XAS to probe the covalency of transition metal sites (Section 4). Together, these methods allow for detailed characterization of the bonding in transition metal compounds and metalloenzymes.
Because bond covalency profoundly influences the physical properties of chemical systems, quantifying metal-ligand bond covalency has long been a goal of physical and inorganic chemists. Many methods have been developed in pursuit of this endeavor, including ligand field theory and many levels of molecular orbital theory. For transition metal complexes the covalency of a metal-ligand bond is given by the amount of ligand (ΨL) character mixed into a metal d orbital (Ψmd) due to chemical bonding, α2 in Ψ = (1 − α2)1/2 Ψmd – αΨL. For transition metal complexes, we generally focus on the frontier molecular orbitals (FMOs) that dominate the bonding, physical properties, and reactivity and reflect the interaction between the metal d orbitals and the symmetry-allowed linear combinations of ligand s and p orbitals. In catalytic systems and intermediates, changes in the bond covalency modify the amount of ligand character in the FMOs, altering the reactivity of these complexes; further, the covalency will affect the overall electron delocalization of materials and modify magnetic and electronic interactions, thus changing the system’s physical properties. Covalency effects can determine function in many biological systems, which often utilize transition metal centers (most 3d metals, but also Mo and W) to perform a series of tasks, including dioxygen binding, catalysis and electron transfer. Advances in computational methods enable the modeling of larger systems, including paramagnetic transition metal complexes (i.e. spin unrestricted DFT and multi-reference Hartree-Fock calculations). However, these can give different results depending on the type of calculations and there are few experimental methods capable of directly quantifying the metal-ligand covalency in transition metal complexes.
It has long been clear that the spectra obtained from traditional methods for transition metal complexes are strongly influenced by the covalency of the ligand-metal bonds. However, these effects are generally empirical and not quantifiable. From the application of ligand field theory (LFT) to the electronic absorption spectra of transition metal complexes, the electron-electron repulsion is clearly reduced from the free ion value due to covalency (the nephelauxetic effect). However, there are a number of contributions to this and the β’s obtained (equal to the ratio of the Racah B parameter for the complex relative to the free ion) do not translate into covalency. Also, in magnetism and EPR the Landè g factors are clearly reduced relative to their LFT estimates (giving the Steven’s orbital reduction factors, ki) but again there are a number of contributions and the ki’s do not give α2 (these are best used to evaluate the results of electronic structure calculations). Other parameters, experimentally obtained from EPR, include zero field splitting (ZFS) for metal ions with S > ½ and metal hyperfine coupling, which are also clearly highly sensitive to covalency but (due to their multiple contributions) also do not give an experimental estimate of α2. Ligand nuclear spin superhyperfine coupling to the electron spin of the metal ion is a direct reflection of covalency and quantifies the amount of ligand p (and s) character in a metal d orbital. However, this requires the complex to be EPR active with resolvable superhyperfine structure that is anisotropic (perhaps from ENDOR) and only probes singly occupied metal d orbitals.
Synchrotron-based methods add a major dimension to the experimental determination of bonding. An earlier CCR article reviewed our ligand K-edge XAS method [9]. In Ligand K-edge XAS the localized nature of the ligand 1s orbital and the fact that the ligand 1s → ligand np transition is electric dipole allowed means that the ligand K pre-edge 1s → 3d intensity directly quantifies the ligand p character in all unoccupied and partly occupied metal d-based molecular orbitals. In the present CCR the focus is on metal-based X-ray absorption methods: metal K- and metal L-edge XAS, and 1s2p resonant inelastic X-ray scattering (Kα-RIXS) which couples these in a 2D experiment with complementary selection rules. While this review primarily covers the studies done in the Hodgson, Hedman, and Solomon group, in addition the interested reader is referred to reviews and studies[10–13] that provide further insight utilizing metal K-edge XAS [14–23], L-edge XAS[24], and RIXS [25–34].
2. K-edge XAS
2.1 Metal K-edge XAS
Metal K-edge absorption occurs when the metal 1s electron is excited either into a valence orbital or into a continuum state. Generally, the XAS spectrum is divided into two regions, each of which involves different transitions and contains complementary information. The X-ray absorption near-edge structure (XANES), covers the lower energy portion of the XAS spectrum and consists of the pre-edge, the 1s → 3d transitions, and the edge, which involves both the threshold to ionization and higher energy bound states that include both 1s → 4p transitions and 1s → 4p + ligand-to-metal charge transfer (LMCT) transitions known as shakedowns. The pre-edge peaks are quadrupole allowed (Δl ± 2) and are particularly sensitive to the metal coordination number and symmetry. The pre-edge is dependent on the number of metal 3d holes, and is not observed in d10 metals (CuI, ZnII, etc.). The pre-edge varies significantly between systems with a single 3d hole (CuII) and multiple 3d holes (FeII/FeIII) due to multiplet splitting from electron-electron repulsion and ligand field effects in the latter case leading to multiple final states. The edge transitions are dipole-allowed, and thus much stronger in intensity than pre-edge transitions; the edge energy is indicative of the oxidation state of the metal, the 4p orbital splitting is sensitive to the ligand field, and the shakedown transitions are sensitive to the covalency of the metal-ligand bonds. The higher energy region contains the 1s → continuum transitions that result in ejection of a photoelectron and are dominated by multiple scattering events and constructive and destructive interference with the nearby ligands’ electrostatic field. This portion of the spectrum is quite sensitive to the geometric structure around the absorbing metal, but will not be covered here.
In this section, we focus on transitions to bound states, specifically the 1s → 3d, 1s → 4p and 1s → 4p/shakedown transitions. CuII is among the simplest systems, having only a single 3d hole and thus not influenced by multiplet effects and is considered first. We then extend into FeII and FeIII complexes to expand the theoretical framework to include multiplet effects. We primarily focus on how spectral shapes are influenced by transition selection rules, metal coordination and symmetry, and 3d-4p mixing in non-centrosymmetric systems; this will allow extraction of some information regarding the covalency of metal-ligand bonds and serve as the basis for extension into metal L-edge XAS and Kα-RIXS in subsequent sections.
2.2 Cu K-edge
Copper centers are ubiquitous in biological systems, and numerous spectroscopic tools, including optical and X-ray methods, can probe their metal-ligand bonds. The relatively simple electronic structure of copper centers makes them ideal for developing models for extracting metal-ligand bonding information from the metal K-edge spectrum. For CuII systems, extensive information can be extracted both from the electric quadrupole-allowed 1s → 3d transitions in the pre-edge, as well as the electric dipole-allowed 1s → 4p transitions at the edge. The edge transitions are particularly useful for CuI systems, as CuI possesses no 3d holes and therefore exhibits no pre-edge feature.
For CuII systems, the most useful probe of covalency in the K-edge XAS spectrum comes from shakedown transitions, which are derived from LMCT states and observed below the 1s → 4p edge transitions. In principle, the pre-edge can be used to probe covalency as well, however as the pre-edge is also very sensitive to minor amounts of 4p character, precise determination of covalency via the analysis of the K-edge pre-edge intensities is limited. Other effects can significantly affect the shape and intensity of the Cu pre-edge and edge, in particular 4p mixing and polarization effects in single crystal systems. An understanding of these effects is necessary both for the interpretation of metal K-edge XAS and Kα-RIXS spectra, as discussed below.
2.2.1 CuI edge transitions: ligand-field effects
As stated above, a metal K pre-edge is not observed in d10 systems, including CuI complexes. Instead, electric dipole allowed 1s transitions into the metal 4p orbitals can be utilized as probes of the metal geometry using a simple ligand field model. Figure 2.1 shows the Cu K-edge spectra of two-coordinate (2C), 3C, and 4C copper complexes [35, 36]. Single crystal measurements have shown that the edge feature appearing around 8984 eV can be assigned as a 1s → 4p transition [36, 37], and its energy and intensity depend on the ligand environment around the copper centers [35]. The linear 2C copper complex exhibits one intense peak at ~8984 eV; repulsive interactions with these ligands breaks the degeneracy between the 4px,y and 4pz orbitals, increasing the energy of the 4pz orbital. Further, covalent interactions with the ligands will increase the ligand character in the 4pz antibonding orbital, leading to a peak intensity decrease. Therefore, for a 2C copper complex, one observes a single, high intensity 1s→4px,y edge peak at 8984 eV.
Figure 2.1.
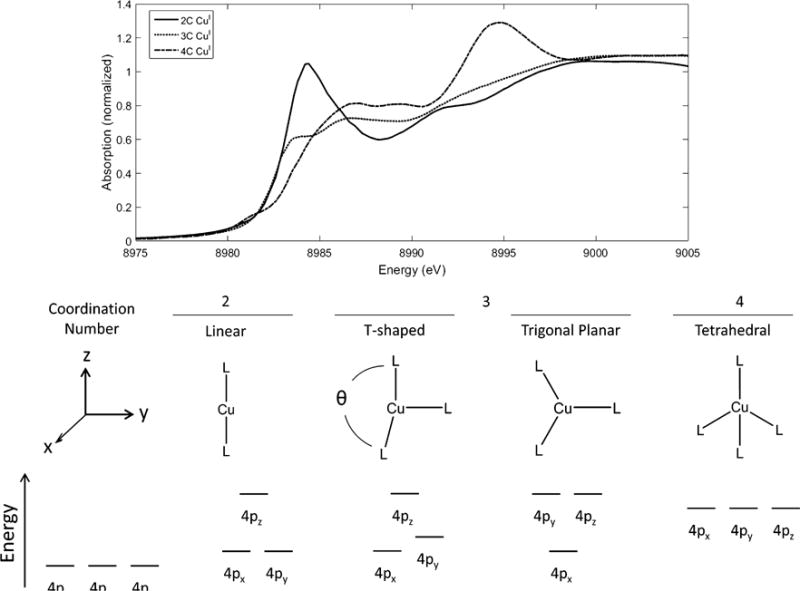
Top: Cu K-edge spectra of 2-coordinate (solid), 3-coordinate (dotted), and 4-coordinate (dashed) CuI complexes. Bottom: Splitting of Cu 4p orbitals with different coordination numbers. Adapted from Ref. [35].
Extending this model to 3C Cu complexes by including an additional ligand along the y-axis results in a “T-shaped” structure, which reaches a trigonal planar geometry in the limit where θ = 120°, as shown in Figure 2.1. Addition of the third ligand breaks the degeneracy of the 4px,y orbitals, leading to an increase in 4py energy, as well as a decrease in its peak intensity due to covalency. The 4py energy will increase with decreasing θ and becomes degenerate with the 4pz orbital in the trigonal planar geometry. In this case, the 8984 eV edge peak corresponds to a 1s → 4px transition (x is now the direction perpendicular to the trigonal plane) with a lower intensity than that exhibited by 2C Cu systems as it is non-degenerate. Finally, addition of a fourth ligand results in a nominally tetrahedral geometry. In this geometry, the three 4p orbitals will be nearly degenerate and shifted to higher energy due to the repulsive interactions with the four ligands. The resulting edge peak is shifted to ~8985–8986 eV, with a decreased intensity relative to the 2C complexes due to the ligand character mixed into each of the 4p orbitals.
2.2.2 CuII K pre-edge polarization effects
Since synchrotron radiation is polarized with in the plane of the ring, for systems with a fixed orientation, such as single crystals, the intensity of the K pre-edge is dependent on the relative orientation of the unoccupied d-orbital(s) with respect to the polarization of the electric field and the propagation direction of the incoming X-ray. This dependence will be lost, however, in systems with a random distribution of alignments, as in frozen solution or powder samples. For centrosymmetric systems, the 1s → 3d pre-edge intensity is weak but not absent; this implies two possible mechanisms for pre-edge intensity, either a direct quadrupole coupling or vibronically-allowed electric dipole coupling, and the relative strengths of these two can be determined based on the angular dependence of the 1s → 3d transition of a single crystal in a polarized X-ray beam. The results of polarization-dependent K-edge X-ray absorption of a single crystal of the nominally square planar, D4h complex creatininium2[CuCl4] is shown in Figure 2.2 [38]; [CuCl4]2− has a single 3dx2−y2 electron hole. The crystal was rotated about its c-axis, which closely corresponds to rotation about the molecular z-axis. The pre-edge intensity exhibits a polarization dependence, reaching a minimum at 0°, parallel to the Cu-Cl bond, and a maximum at 45°, bisecting the Cu-Cl bonds.
Figure 2.2.
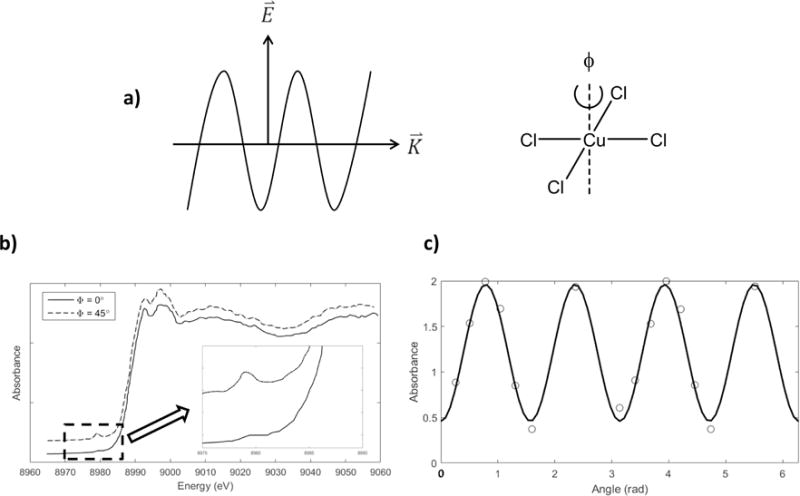
a) Polarization of the incoming X-ray relative to the [CuCl4]2− crystal; X-rays are polarized perpendicular to the molecular z-axis b) Polarization-dependent K-edge XAS spectra for [CuCl4]2−, with the rotation angle φ collinear along the crystal c-axis. c) 1s → 3d transition cross section as a function of φ. Adapted from Ref. [38].
The angular dependence of the electric quadrupole matrix element is given by:
where is the position operator, is the momentum operator, and is the polarization vector of the incoming X-ray with propagation direction . In the coordinate system defined by the propagation and polarization directions (x and y), the half-filled d-orbital must transform as xy in order to have quadrupole transition intensity, since 〈s|xy|dx2−y2〉=0 and 〈s|xy|dxy〉≠0. Since the singly occupied d orbital has its lobes oriented along the Cu-Cl bonds, the transition into this orbital would have a maximum intensity when bisects adjacent Cu-Cl bonds. This is observed in Figure 2.2 with a maximum pre-edge intensity at 45° with a fourfold periodicity as expected for electric quadrupole coupling. The constant intensity offset in the quadrupole peaks shows that the pre-edge peak intensity may also have a contribution from spherically symmetric, vibronically-allowed electric dipole coupling. However there may also be a contribution due to a slight difference between the molecular axes and the rotation axis.
2.2.3 3d-4p mixing: loss of inversion symmetry
Since the wavelength of a 7000 – 9000 eV photon is on the order of the radius of the electron in a valence orbital, quadrupole intensity is observed [39, 40]. However, the electric dipole allowed 1s → 4p intensity is still 2 orders of magnitude larger (vide infra). Thus, in non-centrosymmetric complexes (i.e., no inversion) the pre-edge will gain intensity from 3d-4p mixing. This results in a small amount of electric dipole character in the pre-edge transitions, which can dominate due to the large difference in intensity between electric quadrupole and dipole allowed transitions. Such effects are observed for [CuCl4]2−, shown in Figure 2.3, which is distorted from D4h to D2d symmetry by switching the cation from creatininium to cesium (2 trans Cl ligands shift above and 2 trans Cl ligands shift below the plane in D2d symmetry.) Since the crystal field contribution to the 3d-4p mixing is small [41], the mixing of the 3d and 4p orbitals derives from the covalent interactions with the ligands. This is given by a valence bond configuration interaction (VBCI) model involving both the metal 3d and 4p orbitals covalently interacting with the same ligand orbital [42], as shown below. In this model, the 3d and 4p orbitals mix via bonding interactions with the same symmetry-adapted linear combination (SALC) of the Cl 3p orbitals.
Figure 2.3.
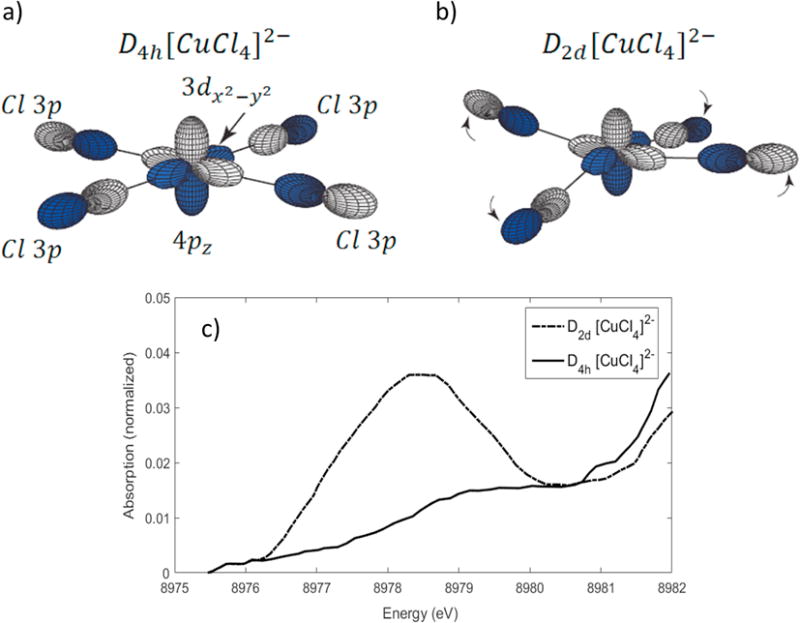
Illustration of the orbital mixing between the copper and chlorine ligands. a) For D4h Cu, the σ anti-bonding SALC of b1g symmetry overlaps with the 3dx2−y2, but not the 4pz. b) For D2d Cu, the σ anti-bonding SALC of b2 symmetry overlaps with both the 3dx2−y2 and the 4pz, resulting in 3d-4p mixing. c) Cu K pre-edges of D4h and D2d [CuCl4]2−. Adapted from Ref. [94].
The Cl 3p orbitals are lowest in energy, followed by the metal 3d and metal 4p, separated by configuration energies Δ1 and Δ2. T1 and T2 are the Hamiltonian matrix elements for the interaction between ligand p and metal 3d orbitals, and ligand p and metal 4p orbitals, respectively, and reflect the metal-ligand overlap in the ground state. This model will reproduce the ground state energy splitting and wavefunction coefficients if appropriate values are chosen for the T and Δ parameters. Note that this model does not allow for the direct (crystal field) mixing of the metal 3d and 4p metals (by a term in the crystal field that transforms as Vxyz;) therefore, 3d-4p mixing will only occur if a given ligand p SALC mixes with both the metal 3d and metal 4p orbitals (i.e., T1 and T2 ≠ 0 for the same Cl 3p SALC).
For the D4h [CuCl4]2−, the symmetry of the Cl 3p SALC that forms a σ bond with the Cu 3dx2−y2 is b1g, and therefore cannot mix with the Cu 4p orbitals of a2u and eu symmetries (i.e., T2 = 0). However, when the symmetry is lowered to D2d, the b1g Cl 3p SALC now transforms as b2 and can mix with both the 3dx2−y2 and 4pz orbitals, which both transform as b2. Therefore, for the D2d complex, T1 and T2 can both be nonzero for a single SALC, and 3d-4p mixing will occur through the ligand 3p interactions with the copper, resulting in additional electric dipole character in the pre-edge transitions that significantly increases the pre-edge intensity relative to that exhibited by the centrosymmetric D4h complex.
2.2.4 Quantifying 3d-4p mixing via shakedown transitions
When an electron is excited from the metal 1s orbital to a 4p orbital, the 1s core hole increases the effective nuclear charge (Zeff) felt by the metal valence orbitals. As a result, the metal 3d orbitals shift to lower energy, and for CuII, which has a high Zeff in the ground state, they can shift, in the presence of a core hole, below the ligand p valence orbitals, resulting in LMCT from the ligand p orbitals into the metal 3d orbitals at lower energy than the direct 1s → 4p transition. This 1s → 4p + LMCT transition is known as a shakedown and can be used to determine the amount of 3d-4p mixing, as well as the covalency of the ligand-metal bonds.
Similar to the case of 3d-4p mixing, these transitions can be analyzed using a VBCI model involving the pure metal state (3d9) and the LMCT state ( , where is a ligand p-hole), as shown below.
The ground-state wavefunction is represented by ΨG, constructed by diagonalization of the matrix:
Δ and T are defined in the same way as used above. Diagonalization of the above matrix yields
where
and Δ is negative in this definition. Excitation of the 1s → 4p transition generates two possible final states, the main 1s → 4p (ΨM) and the shakedown (ΨS), separated in energy by W. The excited-state wavefunctions are given by:
where
Note that in the core hole final state, the d manifold experiences an increase in Zeff that shifts the energy down by Q. W (Figure 2.4, right) is given by the equation:
Figure 2.4.
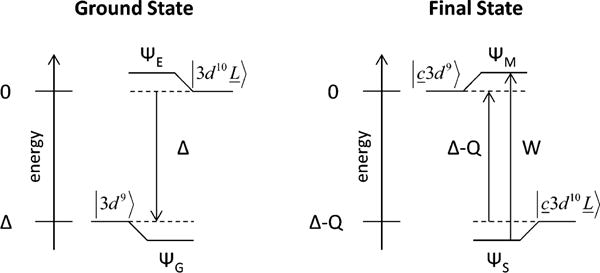
Configuration energy diagrams for the ground (left) and final (right) states for shakedown transitions. Adapted from Ref. [42].
The intensity ratio is given by
Both W and can be measured experimentally; further, both W and are sensitive to the mixing term T, and therefore are sensitive to metal-ligand bond covalency. This model was applied to the D2d [CuCl4]2− complex to determine the amount of 3d-4p mixing and to quantify the effect of this mixing on the pre-edge intensity. Figure 2.5 a shows the z- and x,y-polarized Cu K-edge XAS spectra for D2d [CuCl4]2−; note that, while the electric quadrupole transition is x,y polarized, the x,y-polarized spectrum does not exhibit a significant pre-edge transition, consistent with the pre-edge intensity originating from the 3dx2−y2 mixing with metal 4pz through the ligand SALC of b2 symmetry (Figure 2.3). A fit of the z-polarized pre-edge, shakedown, and main peaks (Figure 2.5 b) shows that , indicating that the main transition contains 41% of the 1s → 4p transition intensity and the shakedown contains 59% [43]. Further, the ratio of pre-edge intensity to shakedown intensity is ~0.0636 (note that the pre-edge intensity in the z-polarized spectrum is derived only from the electric dipole character). Therefore, this ratio, along with the total 1s → 4p character in the shakedown transition, gives 3.8 ± 1.5% total 4p character mixed into the 3dx2−y2 orbital. The z-polarized pre-edge peak has an intensity of 5.45, and therefore 1.4 ± 0.7 units of electric dipole intensity represent 1% metal 4p character in the singly occupied Cu 3d orbital.
Figure 2.5.
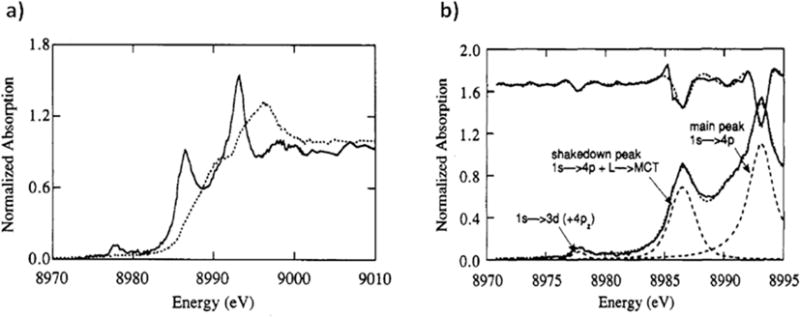
a) Polarized Cu K-edge XAS spectra of D2d [CuCl4]2− along the z (solid) and y (dashed) axes; b) Fits to the pre-edge, shakedown, and main peaks of z-polarized D2d [CuCl4]2. Reproduced from Ref. [43].
Analysis of the Cu K-edge shakedown transitions has been used to measure Cu-ligand bond covalencies of the blue-copper proteins plastocyanin and stellacyanin [44]. Plastocyanin, like most blue copper proteins, has a trigonally-distorted tetrahedral active site, with a short Cu-S(Cys) bond, two Cu-N(His) bonds, and a long axial Cu-S(Met) bond, where the weak bond to the Met ligand results in a strong π-interaction between the Cu and the Cys ligand. Stellacyanin replaces the Met with a stronger Cu-O(Gln) bond, which weakens the Cu-S(Cys) bond. We can determine the change in Cu-ligand covalency due to this ligand substitution by analysis of the Cu K-edge shakedown transitions, shown in Figure 2.6. is larger for stellacyanin than plastocyanin (1.41 vs. 0.90), while both systems have WQ ≈ 8 eV. Configuration interaction models best reproduce these differences by increasing the magnitude of T from −0.6 for stellacyanin to −1.0 for plastocyanin, respectively, indicating that plastocyanin has a more covalent bonding interaction than stellacyanin. This result is consistent with S K-edge XAS measurements, which demonstrated that plastocyanin and stellacyanin had S 3p characters of 38% and 41% in their singly occupied HOMOs, respectively [45]. This method has been used in a number of Cu XAS studies in the determination of bond covalency for both CuII [43] and CuIII [46] systems.
Figure 2.6.
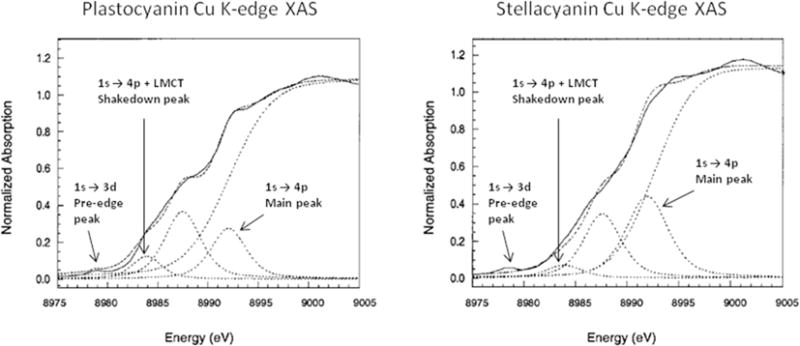
Cu K-edge XAS spectra of plastocyanin (left) and stellacyanin (right). Adapted from Ref. [44].
2.3 Fe K-edge: multiple 3d holes
CuII complexes have only one 3d hole and therefore only one (1s1 3d10) final state, resulting in rather simple K pre-edges. However, electron-electron repulsion and the ligand field splitting of the d orbitals lead to multiplet effects in metals with more than one 3d hole, resulting in pre-edges with multiple transitions whose intensities and energies are dependent on the metal oxidation state, spin, and geometry, as well as the metal-ligand bond covalencies and 3d-4p mixing. The allowed multiple-electron excited states are determined by ligand field theory. A 3dN metal has a 1s1 3dN+1 excited configuration; however, because the coupling of the spherical 1s hole is weak, Tanabe-Sugano diagrams [47] for the 3dN+1 electron configuration can be applied to obtain the final states associated with the 1s1 3dN+1 excited configuration. The K pre-edges of ferrous and ferric low-spin and high-spin complexes are presented below.[48]
2.3.1 Fe K-edge of centrosymmetric systems
The ferric, high-spin Oh complex [FeCl6][Co(NH3)6] [49, 50] has the electron-hole ground configuration (t2g)3(eg)2 and a 6A1g ground state. The Fe K-edge XAS spectrum for this complex is shown in Figure 2.7. K-edge excitation into the 3d orbitals involves purely quadrupole-allowed transitions, as the center of inversion of Oh complexes precludes 3d-4p mixing. A series of ferric octahedral complexes have an average pre-edge intensity of 4.9, which represents an average total electric quadrupole contribution to the K pre-edge. Excitation of a 1s electron into the 3d orbitals results in two excited hole configurations, (t2g)2(eg)2 and (t2g)3(eg)1, leading to two spin-allowed final states after coupling of the holes, the 5T2g and 5Eg, respectively. (Note: coupling to the (1s1) leads to spin allowed sextets and spin forbidden quartets of each. The quintet label is used to remain consistent with the dN+1 Tanabe-Sugano diagrams.) Generally, we would expect two pre-edge features in this case with a degeneracy-weighted 5T2g:5Eg intensity ratio of 3:2, separated in energy by 10Dq. However, deviations from the 3:2 intensity distribution will occur due to differences in the covalency of the metal-ligand bonds between the t2g and the eg orbitals, which we refer to as the differential orbital covalency (DOC). Increased bond covalency decreases the amount of unoccupied metal 3d character in an orbital and therefore decreases the intensity of transitions into that orbital. DFT calculations have shown that the 5T2g final state of [FeCl6]3- has more 3d character than the 5Eg state (76% vs. 50%) due to the stronger σ-bonding interactions with the ligands, and as such the 5T2g:5Eg intensity ratio favors the 5T2g state. However, DOC is best obtained from L-edge XAS (vide infra), as DOC analysis via the K pre-edge is limited due to the experimental resolution, and the sensitivity of the pre-edge to 4p mixing.
Figure 2.7.
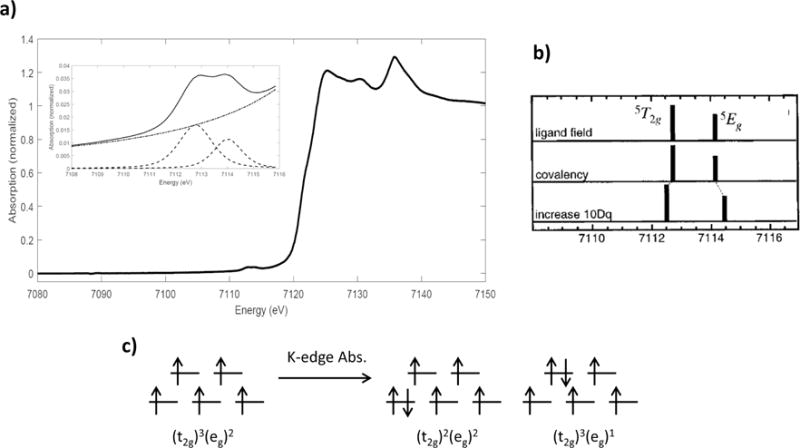
a) Fe Fe K-edge XAS spectrum of [FeCl6][Co(NH3)6]; b) theoretical energy splitting and intensity distribution in the allowed final states; c) ground and final-state electronic configurations for ferric, high-spin Oh complexes. Reproduced from Ref. [48].
The ferrous Oh, high-spin complex [Fe(H2O)6][SiF6] complex [51] has the ground electron-hole configuration (t2g)2(eg)2 with a 5T2g ground state; its K-edge spectrum is shown in Figure 2.8. Excitation of a 1s electron into the 3d holes gives two excited hole configurations: (t2g)1(eg)2 and (t2g)2(eg)1. The (t2g)1(eg)2 with hole configuration gives a 4T1g excited state and a number of spin forbidden states, while coupling in the (t2g)2(eg)1 hole configuration gives 4T2g and 4T1g, and spin forbidden excited states. Coupling of these three spin-allowed excited states with the 1s hole (2a1g) gives a set of one-electron triplet and quintet final states (3T1g, 3T2g, 3T1g and 5T1g, 5T2g, 5T1g, respectively), but only the quintet states are spin-allowed and contribute to the pre-edge. The relative energies of the spin-allowed excited states can be obtained from the d7 Tanabe-Sugano diagram; as before we ignore the 1s core hole coupling and represent these final states as dN+1 quartets. The K pre-edge exhibits two peaks; the first consists of the (t2g)1(eg)2 configuration 4T1g state and the 4T2g state of the (t2g)2(eg)1 configuration. These transitions are separated by ~0.9 eV, appearing as one peak due to energy broadening from the 1s core hole. The second pre-edge peak is from the (t2g)2(eg)1 configuration 4T1g, ~2.2 eV above the low energy peak. Because the (t2g)1(eg)2 configuration gives only a single allowed excited state while the (t2g)2(eg)1 configuration gives two, the lower energy 4T1g state has an intensity equal to the sum of the higher energy excited states. However, the eg orbitals are more covalent than the t2g, resulting in an even larger relative intensity for the lowest energy pre-edge peak, as shown in Figure 2.8b.
Figure 2.8.
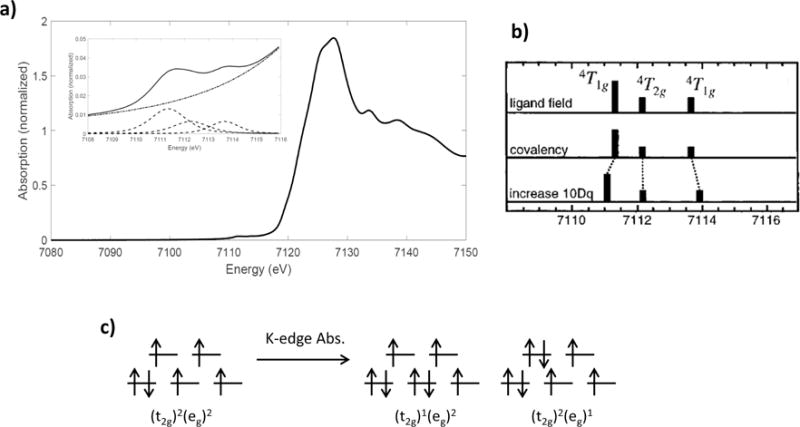
a) Fe K-edge XAS spectrum of [Fe(H2O)6][SiF6]; b) theoretical energy splitting and intensity distribution in the allowed final states, and effect of changing covalency and 10Dq; c) ground- and final-state electronic configurations for ferrous, high-spin Oh complexes. Reproduced from Ref. [48].
The ferrous Oh, low-spin complex Fe(prpep)2 [52] has the ground electron-hole configuration (t2g)0(eg)4. Its K-edge spectrum is shown in Figure 2.9. Unlike the ferric or ferrous high-spin system discussed above, the Fe(prpep)2 only has holes in the eg orbital. Therefore, the only allowed transition is from the ground state 1A1g to the 2Eg (actually a 1Eg from coupling to the (1s1) core hole) final state and the pre-edge for this system is expected to exhibit only one, electric quadrupole-allowed transition. Note that the higher energy peak at 7115.6 eV is not a 1s → 3d transition and rather is assigned as a transition to a ligand π* orbital with 4p character.
Figure 2.9.
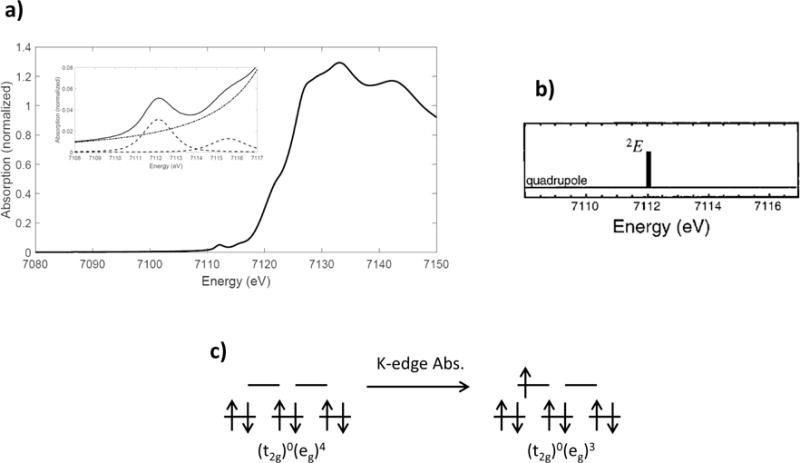
a) Fe K-edge XAS spectrum of Fe(prpep)2; b) single allowed transition in the pre-edge; c) ground and final-state electronic configurations for ferrous, low-spin Oh complexes. Reproduced from Ref. [48].
The ferric, low-spin Oh complex [Fe(prpep)2](ClO4) [52] has a (t2g)1(eg)4 ground hole configuration and a 2T2g ground state. In contrast to the single-peak pre-edge exhibited by the ferrous, low-spin Oh complex shown in Figure 2.9, the [Fe(prpep)2](ClO4) K-edge exhibits a quadrupole-allowed pre-edge main peak with two weak shoulders at lower and higher energies (Figure 2.10). Here, there are two possible excited hole configurations: the (eg)4 and (t2g)1(eg)3 configurations. The (eg)4 configuration gives a 1A1g state; in the (t2g)1(eg)3, hole coupling configuration yields multiple final states: 3T1g, 3T2g, 1T1g, and 1T2g. The energy splitting of these states is given by the 3d6 Tanabe-Sugano diagram. The 1A1g corresponds to the lower energy shoulder, with the 1T2g corresponding to the higher energy shoulder. The main feature consists of the 3T1, 3T2, and 1T1 states, which are not distinguishable due to the poor energy resolution from the 1s core hole. The (eg)4 and (t2g)1(eg)3 hole configurations will have a 1:4 intensity ratio due to the 1:4 one electron excitation contributions, and the 4 is distributed over the 3T and 1T states such that the two 3T are three times as intense as the two 1T, resulting in a large middle pre-edge peak relative to the high energy pre-edge peak and the experimental intensity distribution is 1:6.4:1.7. The lower intensity of the 1T states relative to the 3T states is also found in the RIXS simulations of ferric, low-spin Oh complexes (see Section 4.2).
Figure 2.10.
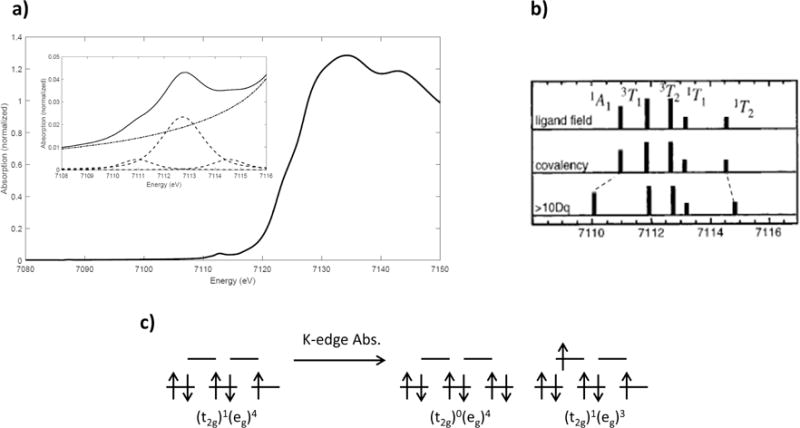
a) Fe K-edge XAS spectrum of [Fe(prpep)2](ClO4); b) theoretical energy splitting and intensity distribution in the allowed final states, and effect of changing covalency and 10Dq; c) ground and final-state electronic configurations for ferric, low-spin Oh complexes. Reproduced from Ref. [48].
2.3.2 3d-4p Mixing in non-centrosymmetric Fe complexes
While the intensity distribution as a function of energy of the Fe K pre-edge is largely determined by the multiplet splitting of the final states, as well as the differential orbital covalency, the total pre-edge intensity can greatly increase due to 3d-4p mixing in non-centrosymmetric systems; the mechanism for 3d-4p mixing is the same as that described above for copper, albeit more complicated for iron due to the many available final states. The iron center in (Et4N)[FeCl4] [53] is Td, high-spin, and has two possible core excited configurations as shown in Figure 2.11. The (t2)2(e)2 electron-hole configuration gives a 5T2 final state, while the (t2)3(e)1 hole configuration gives a 5E final state. The 2:3 intensity distribution of each of these quadrupole-allowed contributions to the pre-edge intensities are shown in Figure 2.11b, where the energy splitting for these transitions (10Dq, Td) is estimated from Tanabe-Sugano matricies; the 5T2 and 5E final states are separated by ~0.6 eV and therefore should not be resolvable in the K-edge XAS measurement.
Figure 2.11.
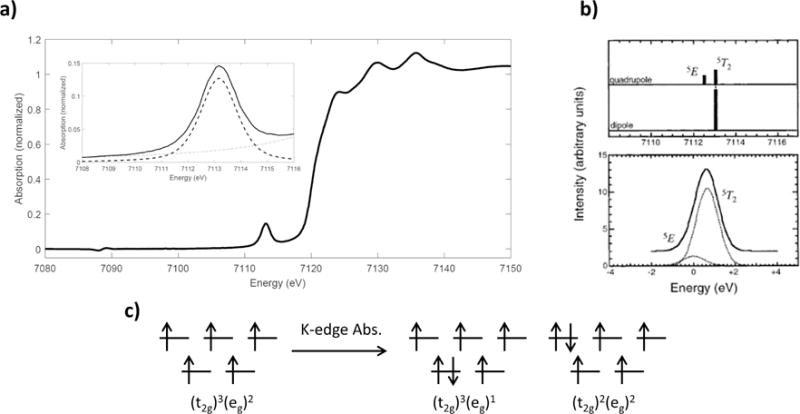
Fe K-edge XAS spectrum of (Et4N)[FeCl4]; b) intensity distribution of the quadrupole-allowed and dipole-allowed transitions; c) ground and final-state electronic configurations for ferric, high-spin Td complexes. Reproduced from Ref. [48].
In a similar fashion to section 2.2.3 we can describe the effects of 3d-4p mixing and the intensity contribution from the electric dipole-allowed final states. The metal 4p orbitals transform as t2 and can only mix with the metal 3d orbitals of t2 symmetry. Therefore, 3d-4p mixing can only occur with the (t2)2(e)2 excited hole configuration and electric dipole intensity is localized in this 5T2 final state. The total pre-edge intensity for this complex is 20.7 ± 0.8; if a pre-edge quadrupole intensity of 4.9±0.2 (determined from ferric octahedral complexes, vide supra) is assumed, the total dipole intensity contribution to the pre-edge is 15.8 ± 1.0.
The 3d-4p mixing for this system can be quantified from this intensity, but this requires the proper conversion factor. As shown above, Cs2CuCl4 has an electric dipole intensity of 5.45 in the pre-edge, corresponding to 3.8% 4pz character [43, 54]; thus, 1.4 units of electric dipole intensity correspond to 1% 4p character. However, this must be corrected for differences in 1s → 4p oscillator strength and normalization differences between CuII and FeIII. The oscillator strength is corrected using the following equation:
This equation reflects the square of the transition moment integral for an electric dipole 1s → 4p transition using hydrogenic wavefunctions. This gives an f1s→4p for FeIII that is 0.83 times that of CuII. The normalization correction reflects differences in the photoionization cross section between CuII and FeIII. Using a normalization correction for the 1s→continuum intensity of 129% FeIII relative to CuII [43] together with the oscillator strength correction reveals that 1.5 ± 0.8 electric dipole intensity units corresponds to 1% 4p character in ferric systems, and therefore (Et4N)[FeCl4] has 10.5 ± 4.8% total 4p character distributed in the three t2 orbitals. DFT calculations predict 2.5% 4p character in each of the t2 orbitals for a total 4p character of 7.5%, consistent with the experimentally determined value. Figure 2.11 shows the resulting pre-edge, which exhibits a single intense peak, corresponding to the 5T2 final state. Note that 10.5% total 4p character gives 15.8 intensity units while the 5 half occupied d orbitals together give 4.9 intensity units. Given that each d orbital has an average of ~20 % ligand character (~400% total d character, see table 3.1), the 1s → 3d transitions are ~102 less intense than the 1s → 4p transitions.
Table 3.1.
Summary of L-edge integrated intensities for the spectra in Figure 3.4, with DOC simulation results and comparison to molecular orbital DFT calculations (BP86). Adapted from Ref. [60]
| Measured intensity | % metal character DOC (DFT) | |||
|---|---|---|---|---|
| t2 | e | |||
| [Fe(III)Cl4]− | S=5/2,Td | 50.5 | 76 (68) | 89 (77) |
| [Fe(III)Cl4]2− | S=2, Td | 43.9 | 87 (84) | 93 (89) |
| [Fe(III)Cl4]3− | S=5/2, Oh | 53.1 | 95 (85) | 70 (64) |
| [Fe(III)Cl4]4− | S=2, Oh | 44.7 | 96 (94) | 93 (83) |
| [Fe(III)(tacn)2]3+ | S=1/2, Oh | 40.6 | 99 (93) | 88 (62) |
| [Fe(III)(tacn)2]2+ | S=0, Oh | 37.4 | 72 (71) | |
2.4 Outlook
We have shown that metal K-edge XAS serves as a probe of the covalency of the unoccupied metal d-orbitals. For Cu-based complexes we have utilized the shakedown transition as a measure of the covalency of the sole unoccupied metal d-orbital, while for Fe complexes, we can determine the differential orbital covalency of the multiple unoccupied d-orbitals using the multiplet intensity distribution in the pre-edge. However, the ferric Oh and Td K-edge XAS spectra highlight the complications in this method, namely the poor energy resolution and the introduction of electric dipole character caused by 3d-4p mixing, and an accurate determination of DOC requires a technique that is not limited by these issues (L-edge XAS).
3. L-edge XAS
3.1 Metal L-edge XAS
L-edge X-ray absorption spectroscopy (XAS) probes transitions of 2s22p6 core electrons into 3d valence holes. The L1 quadrupole transition edge (2s23dn → 2s13dn+1) has a transition oscillator strength some hundred times weaker than the intense electric dipole transitions of the L3,2 edge (2p63dn → 2p53dn+1). Hence L-edge spectroscopy for the study of transition metal complexes generally refers to the L3,2 edges. Soft X-ray L-edge XAS has been applied for the study wide ranging topics in coordination chemistry. The (2p63dn → 2p53dn+1) transition results in a 2p5 core configuration that splits into two states at different energy due to spin-orbit coupling. This splitting results in two excitation edges from J = (l + s) = 3/2 and J = (l − s) = 1/2. The transitions at lower energy involve the 2pJ=3/2 manifold, known as the L3-edge, and transitions involving the 2pJ=1/2 manifold are referred to as the L2-edge. In going from the hard X-ray 1s → 3d transitions of the K pre-edge, to the soft X-ray 2p → 3d transitions of the L-edge, substantial increases in energy resolution are gained as both the life time of the 2p core hole is longer than the 1s core hole and instrument monochromator energy resolution is better at lower energy. Lorentzian energy broadening due to the finite life time of the 2p core hole is larger for the L2 edge than the L3 edge due to an additional Coster-Kronig Auger decay process [55]. As a first order approximation the ratio of the L3/L2 intensities is 2:1, in correspondence with the state degeneracies (2J+1), however in practice, multiplet effects redistribute the intensity between the two edges, and both the L3 and L2 edges must be considered together. Since the L-edge involves an electric dipole allowed transition, unlike the K pre-edge, it is insensitive to 3d-4p mixing, such that the total-integrated L-edge intensity is proportional to the metal 3d character in all unoccupied valence orbitals, regardless of crystal field, making L-edge XAS a precise probe of covalency in transition metal sites. The quantification of covalency by Ledge XAS is simplified for CuII species as the transition final state (2p53d10) includes a completely filled set of 3d orbitals, eliminating or precluding the possibility of 2p – 3d multiplet contributions to the XAS spectrum.
3.2 L-edge as a probe of covalency in CuII species
As the L-edge absorption originates from a 2p core electron localized on the metal, and the p → d transition is electric dipole allowed, only transitions to the metal d components of valence holes have transition final state intensity. Hence the integrated intensity of the L-edge absorption can be directly related to covalency (ligand character in the metal valence orbitals) via the normalized ground state wavefunction, expressed as a linear combination of the metal and ligand orbitals:
where M3d is the unoccupied metal 3d orbital, L is the interacting ligand valence orbital and α2 reflects the covalency of the metal-ligand interaction.
This methodology was exploited to determine the covalency of the electron transfer blue CuII active site of plastocyanin [56, 57]. The ground state wavefunction of the active site has one hole in the Cu 3dx2−y2 orbital and the L-edge absorption fills this hole (2p63d9 → 2p53d10). Figure 3.1 (a) shows the L-edge spectra of plastocyanin and reference compounds, Cs2CuCI4 and (N-pmh)2CuCl4, all with one half unoccupied molecular orbital of 3dx2−y2 character. For quantitative comparison of the measured spectra, normalization of the intensity to the post ionization edge jump is necessary. The normalization procedure requires the measured spectral region to be extended at least 100 eV beyond the L2-edge to extend beyond the delayed 2p absorption maximum at around ~50 eV. A linear background is fitted to below the L3-edge and the edge jump is normalized to 1.0. Arctangents are used to model the 2p3/2 and 2p1/2 ionization edges that, due to the 2p spin orbit coupling, are split in energy by ~20 eV for Cu. Using the normalized L-edge intensity of the [CuCl4]2− model complexes, where we know the covalencies from Cl K-edge XAS [58], the highly covalent nature of the half occupied HOMO of plastocyanin could be quantified. The comparison of the L-edge intensity of the three complexes demonstrates the linear dependence between the decrease in L-edge intensity with increase in covalency of the half occupied HOMO (Figure 3.1(b)). Quantification of the highly covalent nature of the blue Cu site, with ~41% d character, revealed the activation of the site for directional electron transfer associated with the function of this metalloprotein. Additionally, shifts in energy of the L3-edge peaks from 930.5 to 931.1 and 930.7 eV for D2d CuCl4, D4h CuCl4 and plastocyanin, respectively, correlate with changes in the energy of the half occupied HOMO, indicating the sensitivity of L-edge XAS to different ligand fields due to differing coordination geometries (distorted tetrahedral, square planar, and trigonal, respectively).
Figure 3.1.
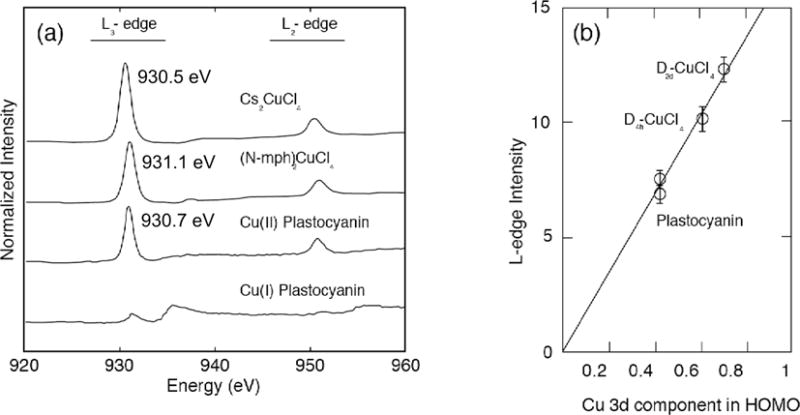
a) Intensity normalized L-edge spectra of CuII plastocyanin with reference samples (N-mph)2CuCl4 and Cs2CuCl4. b) Left: schematic of the observed Cu 2p to 3d ΨHOMO transition. b) Right: Variation of Cu L-edge intensity, plotted as a function of Cu 3dx2−y2 character. Adapted from Ref [56].
3.3 Multiplets in transition metal L-edge spectroscopy
For CuII, excitation of the 2p core electron leads to fully occupied 3d valence orbitals in the final state, however for ions with a 3d<9 ground configuration, the 2p core electron hole and 3d valence holes in the excited configuration strongly interact, significantly affecting the shape of the L-edge absorption spectrum. This is not the case for the K pre-edge absorption final state as the 1s1 core hole does not significantly interact with the 3d valence electrons, thus for the K-edge the energetic sequence of pre-edge transitions can be interpreted by consideration of the ligand field in combination with electron repulsion effects within the 3d shell in accordance with Tanabe-Sugano theory (See section 2.3). Unlike the K-edge 1s1 core-hole, the shallower L-edge 2p5 core-hole does interact strongly with 3d holes. This exchange interaction relates to the energy difference in the coupling of 3d-holes with the spin-up and spin-down configurations of the 2p-hole, significantly influencing the spectral shape of the Fe L-edge XAS, a focus of this review. The interpretation of L-edge XAS, for complexes with one or more 3d-hole(s) in the 2p core excited configuration, requires the consideration of multiplet effects that include 2p-3d exchange, and both 3d-3d and 2p-3d Coulomb repulsion, 2p final state spin-orbit coupling and 3d spin-orbit coupling [59]. In addition to these effects, one needs to include the ligand field splitting of the 3d orbitals and the 3d orbital covalency, which will vary for the degenerate symmetry blocks of valence d orbitals, i.e. the DOC [60]. The calculation of atomic multiplets for the L-edge XAS process can be described by a reduced form of the Schrödinger atomic Hamiltonian.
The first term, Have, incorporates both electron kinetic energy and electron – nucleus interactions, and does not require explicit evaluation for the calculation of XAS as these terms are equivalent for all electrons of a given ground or excited configuration. The second and third terms represent electron – electron repulsions and spin orbit couplings (both for the 3d and 2p electrons) and define the relative energy of different states within a given electron configuration. The Hartree-Fock method can be used to obtain the Slater-Condon-Shortley integrals (Fi for Coulomb repulsion and Gi for Coulomb exchange) for the ground and excited electron configurations of the XAS process. The electron – electron interactions are separated into radial integrals for Coulomb and exchange terms, where the angular part puts selection rules onto particular radial terms relevant for a given electron configuration. The Slater-Condon-Shortley integrals are scaled to 80% of the Hartree-Fock values to account for the excessive electron-electron repulsion found in these values for free transition metal ion atomic calculations. Following the evaluation of the atomic Hamiltonian the crystal field perturbation is added. The crystal field multiplet model accurately reproduces the L-edge XAS of ionic 3d transition metal complexes [61]. However, for many interesting metal complexes the effect of covalency on XAS must be included.
A software package developed for the simulation of L-edge XAS based on multiplet theory was extended from codes that were initially developed for the calculation of atomic spectra by R. D. Cowan and co-workers [62] to incorporate Butler’s point group symmetry methods for crystal field multiplet calculations by B. T. Thole. The program calculates the spin orbit coupling, Coulomb and exchange terms using the Hartree-Fock method. Transition intensities are determined in accordance to the electric dipole selection rule of ΔJ = ±1, 0 (or ΔS = 0, ΔL=1 in the uncoupled basis). A convenient software package for performing multiplet calculations of L-edge XAS is explained in Ref. [63].
Figure 3.2 shows L-edge XAS simulations for two example FeIII (3d5) complexes, with Oh crystal field symmetry, in high-spin (a) and low-spin (b) electron configurations. The top spectra show full simulations, the lower spectra exclude 2p53d6 Coulomb and exchange multiplet effects in the simulations. The shape of the lower spectra follow Tanabe-Sugano theory, with a L3/L2 ratio of 2/1. The comparison demonstrates the strong influence that 2p3d interactions have on the spectral shape. The vertical “sticks” in Figure 3.2, show the individual transition final states with intensities that contribute to the Gaussian and Lorentzian broadened simulations. It is important to note that there are many more sticks (i.e. final states) for the simulation including 2p53d6 Coulomb and exchange multiplet effects (top), and consequently the multiplet effects spread out the L-edge intensity, broadening the simulated spectrum that correlates to experiment.
Figure 3.2.
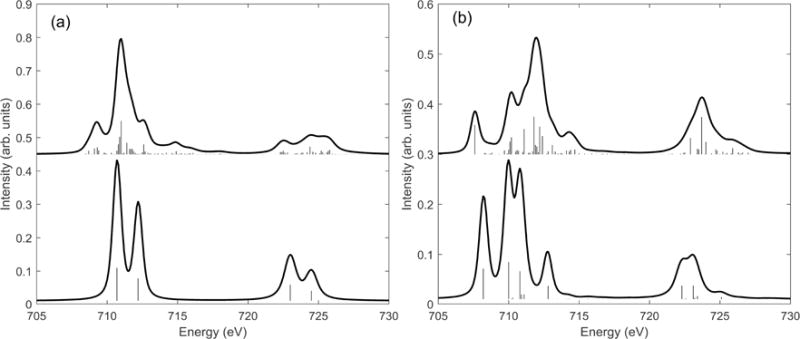
Simulations to demonstrate the strong influence of multiplet effects in high spin (a) and low spin (b) Oh FeIII L-edge XAS. The upper figures show simulations including all multiplet, crystal field and spin orbit coupling effects. The lower simulations excludes 2p3d Coulomb and exchange multiplet effects.
3.4 Charge transfer multiplet theory: the valence bond configuration interaction model (VBCI) and differential orbital covalency (DOC)
3.4.1 VBCI
Further reduction of the 80% scaled Slater-Condon-Shortley integral values, due to the nephelauxetic effect, can be used to simulate the effect of the reduction of total 3d character. However, this approach is empirical and there is no direct connection between the amount of Slater reduction and the extent of covalency. A more precise approach to model covalency is through the introduction of ligand – metal charge transfer effects, which connect different atomic multiplet configurations. The VBCI methodology applied is similar to the model used to quantify 3d-4p mixing via K-edge shakedown transitions (Section 2.2.4). In the case of ligand electron donor bonding, a configuration (where = ligand hole) is mixed with the atomic dn ground configuration. The two configurations are separated by the charge transfer potential energy, Δ, and mixed by the element T:
where h is the molecular Hamiltonian, classifying mixing pathways according to orbital symmetry. In contrast with the K-edge, L-edge XAS is sensitive to DOC. Hence the element T, which is proportional to orbital overlap, regulates the mixing between specific valence orbitals depending on their π or σ overlap. This is the mechanism for the introduction of DOC into the model. The VBCI matrix results in mixing of the charge transfer configuration into the crystal field multiplet. In the case of mixing two configurations, this is given as
The solutions for the ground (G) state wavefunctions for the bonding (B) and antibonding (AB) charge transfer states can be written as
Similarly the transition core excited (E) state wavefunctions for the bonding (B) and antibonding (AB) charge transfer states can be written as
where denotes the 2p core hole in the final state wavefunction components. The charge transfer energy in the excited state (Δ′) differs from that of the ground state (Δ) according to the differences in the ground and excited state 3d-3d interaction potential (U) and the 2p-3d electron interaction potential (Q), such that Δ′ = Δ + Q − U. Where Q − U is on the order of 1 eV. A convenient software package for the simulation of DOC is explained in Ref. [64].
Differential orbital covalency
The ground state wavefunction for the charge transfer multiplet simulation can be analyzed to obtain a molecular orbital description of metal - ligand covalency to the extent that DOC can be extracted and compared directly to percentages of unoccupied valence orbital metal character calculated by density functional theory [60]. The σ and π donor bonding contributions are mixed due to the presence of multiplet interactions, hence L-edge XAS is sensitive to DOC through the modulation of absorption intensities that are distributed across the spectrum. Hence the covalency of specific bonds must be elucidated by full spectral shape analysis. Figure 3.3 demonstrates how the distribution of π and σ character contributes to L-edge simulations of ferric systems with high and low-spin Oh ligand fields. Despite the L-edge of high-spin complexes being dominated more strongly by multiplet effects, distributing t2g (π) and eg (σ) final states across the full L-edge, the distribution is far from isotropic and parts of the spectrum are predominantly of t2g (π) character. For the low-spin case, where the ligand field is dominant over the multiplet effects, the low energy feature in the L3-edge is close to being pure t2g (dπ) in character, whereas the higher energy intense L3 peak has dominantly σ donor character.
Figure 3.3.
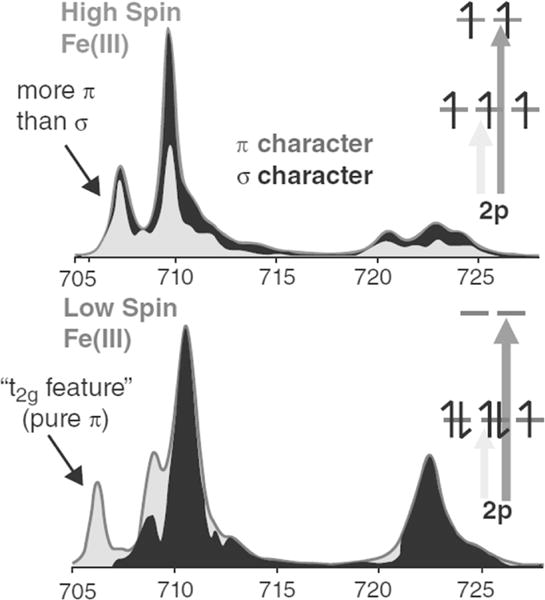
The distribution of t2g (π) and eg (σ) density of states in high and low-spin ferric charge transfer multiplet simulations. Adapted from Ref [65].
Figure 3.4 shows a selection of measured Fe L-edge spectra, with overlaying charge transfer multiplet fits. The spectra are all normalized to the post edge and are background subtracted. The compounds cover differences in coordination geometry (Td and Oh), valence state (ferric and ferrous) and bonding character. [FeIIICl4]−, [FeIIICl6]3− and [FeIIItacn2]3+ (Figure 3.4 a, b and c) are all ferric, with increasing ligand field strength from a to c. Complexes [FeIIICl4]− and [FeIIICl6]3− have weaker ligand fields and are high-spin. The crystal field splits the t2 and e orbitals in accordance with Oh and Td symmetry for [FeIIICl6]3− and [FeIIICl4]−, respectively. In both cases the weak ligand field splitting results in XAS spectra that are dominated by the 2p core-hole multiplet effects. The compound [FeIIItacn2]3+ is low-spin, and thus exhibits a much stronger crystal field, and hence 2p core hole multiplet effects have a less dominant effect on the distribution of absorption intensities. The large ligand field brings the spectrum close to a single electron picture, such that the low energy absorption at ~705.6 eV can be assigned as being associated with a 2p6t2g5 → 2p5t2g6 transition (i.e. filling the dπ* hole). Comparison with the low-spin ferrous counterpart, Figure 3.4 f, shows that [FeIItacn2]2+ lacks the low energy spectral feature at ~705.6 eV associated with an electron hole in the t2g orbitals that is present in the low spin FeIII complex. In accordance with the number of 3d holes present, the normalized total intensity of the ferrous complexes are less than their ferric equivalents (Table 3.1). Quantification of the normalized total L-edge intensity gives the total covalency of the unoccupied valence orbitals, to a precision of typically ~10%, depending on variations in the base-line of the measurement. However the t2 and e orbitals for the complexes have different metal-ligand σ and π bonding and consequently the DOC can be extracted by fitting the VBCI model to the experimental spectra [60]. The DOC is obtained by projecting out the simulation ground state wavefunction into final states for which multiplet effects have been eliminated. This allows discrimination of the different t2 and e symmetry contributions to the charge transfer pathways and therefore DOC, as given in Table 3.1.
Figure 3.4.
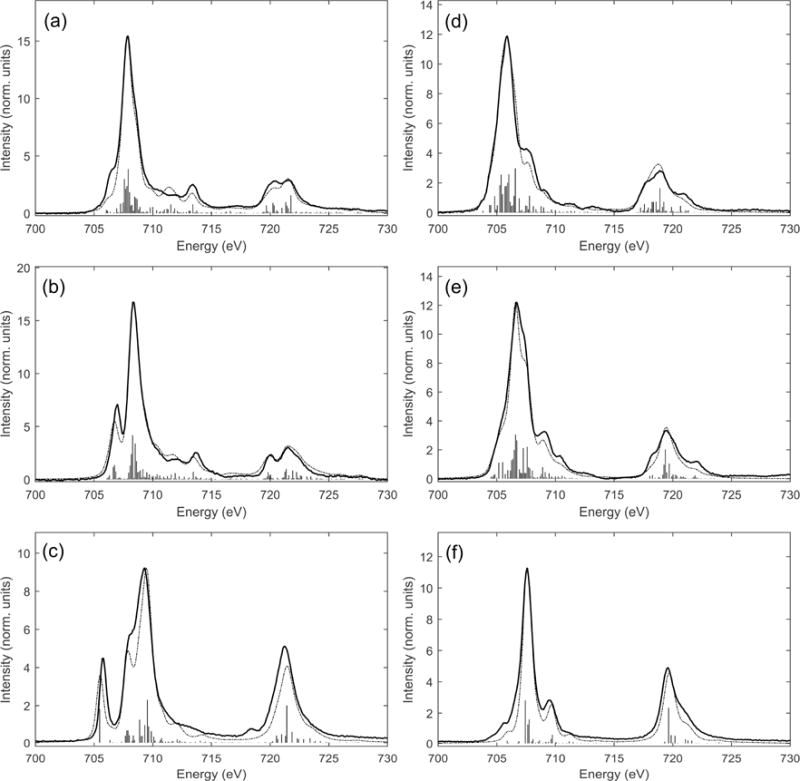
Fe L-edge spectra (solid lines) and ligand field multiplet simulations with DOC (broken lines) for (a) [FeIIICl4]− Td S=5/2, (b) [FeIIICl6]3−, Oh S=5/2, (c) [FeIII(tacn)2]3+, Oh S=1/2, (d) [FeIICl4]2− Td S=2, (e) [FeIICl6]4− Oh, S=2, and (f), [FeII(tacn)2]2+ Oh S = 0. Adapted from Ref. [60].
For each of the compounds in Figure 3.4 the DOC extracted from the charge transfer multiplet simulation fits are compared with DFT results (Table 3.1). For the Oh complexes the eg orbitals are more covalent than the t2g orbitals, while for the Td complexes the t2 orbitals are more covalent than the e orbitals, in accordance with the well-known differences in the σ and π bonding in octahedral and tetrahedral coordination geometries. The experimentally determined DOC for both the high-spin and low-spin complexes compare well with calculated values, with the calculated covalencies being generally slightly higher (i.e. less metal d character in Table 3.1) than those found experimentally. The calculations were performed using a pure density functional (BP86) method. Addition of Hartree-Fock, used in a hybrid functional, would reduce covalent interactions in the calculation to better match with experiment.
The determination of DOC based on the charge transfer multiplet simulations provides insight into covalency of the frontier molecular orbitals. The DOC extracted from fitting experimental XAS data is complementary to DFT calculations and together these can be used to understand chemical trends. This strategy was implemented by Hocking et al. to investigate how the high affinity chelation of Fe(III) is achieved in bacteria and fungi by siderophores [65]. The chelation of metal ions is vital in biology for the uptake and transport of Fe, and is relevant in medical treatment and industrial application such as radionuclide separation. Most bacteria and fungi produce siderophores to facilitate the uptake of Fe(III). Siderophores have high stability constants and selectivity for Fe(III), but the origin of their stability was difficult to access experimentally. L-edge spectroscopy enabled a differential orbital analysis of the bonding contributions to the high stability constants for siderophore model complexes, including [Fe(cat)3]3− (cat = catecholate) that has a stability constant 1044.9, with respect to reference complex [Fe(ox)3]3− (ox = oxalate), that has a stability constant of 1018 [65]. Contributions to the L-edge from both σ and π donation are distributed over the full spectra for the high-spin ferric complexes, but a higher proportion of π character is present in the low-energy feature (c.f. Figure 3.3). Comparing the intensities of the L3-edge peaks (Figure 3.5), both the dπ and dσ regions for [Fe(cat)3]3− are of lower intensity than [Fe(ox)3]3− and hence have increased covalency. The covalent contribution to the ligand-metal bond strength is given by E ∝ α2Δ, where α2 is the covalency and Δ is the energy difference between the metal and ligand valence orbitals. Using the covalency values determined by DOC, and Δ from DFT calculations, the σ and π contribution to the ligand – metal binding energy, for the cat and ox ligands were deduced. The results indicated that 20% of the increase in bond strength of [Fe(cat)3]3− with respect to [Fe(ox)3]3− originates from the increased π donor bonding with the larger contribution coming from an increase in σ donor bonding, despite the σ and π orbital covalencies increasing by similar amounts in going from [Fe(cat)3]3− to [Fe(ox)3]3. It is hence found that the σ orbitals that are at deeper energy in [Fe(cat)3]3− provide the major contribution to increased bond strength.
Figure 3.5.
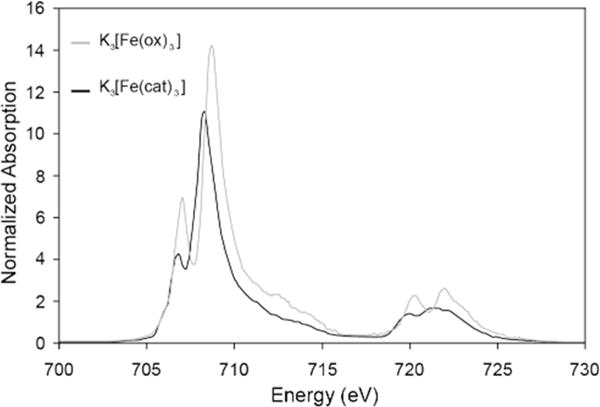
Intensity normalized Fe L-edge spectra for K3[Fe(cat)3] and K3[Fe(ox)3]. The relative ratios of the two main L3-peaks indicate the different amounts of π and σ donation into the 3d orbitals. The total intensities of the peaks indicates the relative amounts of covalency. Adapted from Ref. [65]
Back-bonding in Fe(CN)6
In addition to sensitivity to σ and π ligand to metal electron donor bonding, L-edge spectroscopy is also sensitive to metal to ligand back-bonding, enabling each to be separately quantified. Significant back-bonding can be present when occupied or partially occupied metal orbitals interact with low energy unoccupied ligand valence orbitals. L-edge XAS has contributed significantly to the understanding of heteronuclear cyanide complexes [66, 67], and photo-induced electron transfer in Prussian Blue analogues [68]. In a detailed study of low-spin Fe cyanide complexes, Hocking et al. extended the DOC methodology to quantify covalency due to back-bonding [69]. The study demonstrates how L-edge XAS is sensitive to both ligand electron donation and acceptance such that the effect of σ and π donation and π acceptance can be discriminated and separately quantified. Figure 3.6 shows the L-edge XAS spectra of K4[FeII(CN)6] and K3[FeIII(CN)6] together with charge transfer multiplet simulations. The complexes are both low-spin, with some similarities to [FeIII(tacn)2]3+ and [FeII(tacn)2]2+ (Figure 3.4 c and f). The K3[FeIII(CN)6] spectrum shows a 2p6t2g5 → 2p5t2g6 transition at 705.8 eV similar to that for [FeIII(tacn)2]3+ at 705.7 eV. The spectra of the ferric and ferrous cyanide complexes differ most distinctly from their tacn equivalents, due to additional intense peaks on the high-energy side of the L3 and L2 edges. These additional intensities are reproduced by charge transfer multiplet simulations, which show them to directly reflect and quantify the amount of back-bonding. The back-bonding peak has strong intensity due to acquiring occupied d character in the unoccupied ligand π* orbitals, and due to the unoccupied π* being close in energy to the unoccupied eg orbitals. The 3d (eg) orbitals and the CN− π* (t2g) are of different symmetry but both have T1u final state symmetry due to coupling with the 2p hole. The same symmetry and similar energies allow for excitations into the CN− π* to borrow intensity from the main eg excitation. Note that while donor bonding reduces 3d character, and therefore L-edge intensity, back-bonding shifts occupied 3d orbital character into unoccupied ligand valence orbitals, increasing L-edge intensity.
Figure 3.6.
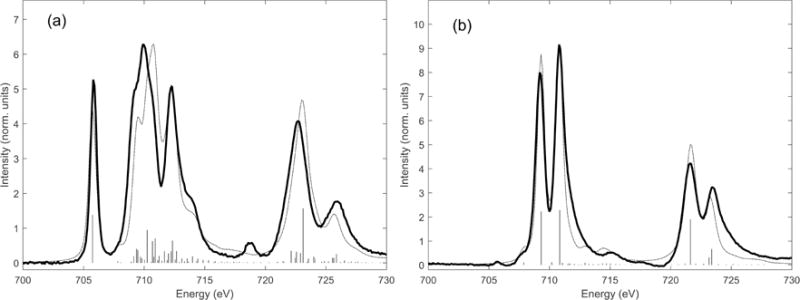
L-edge XAS spectra of (a) FeIII(CN)6 and (b) FeII(CN)6 (solid lines) and charge transfer multiplet simulations (broken lines). Adapted from Ref. [69].
The inclusion of π back bonding in addition to σ and π donation in the charge transfer multiplet model requires a linear combination of three configurations: the main 3dn configuration, the ligand to metal charge transfer configuration (LMCT) and the metal to ligand charge transfer configuration (MLCT) 3dn−1L−, where the latter configuration introduces the back-bonding. The respective ground state and excited states are given as
The VBCI Hamiltonian matrix for the three configurations becomes:
where both LMCT and MLCT have charge transfer energies Δ1 and Δ2, respectively, and covalent mixing terms T1 and T2. The charge transfer multiplet simulation fits of the K4[FeII(CN)6] and K3[FeIII(CN)6] XAS are included in Figure 3.6. The fits gave covalency values of 60% t2g, 47% eg and 14% d character in the π* CN orbitals for K3[FeIII(CN)6], and 45 % eg and 19% d character in the π* CN orbitals for K4[FeII(CN)6]. The values show that both complexes exhibit large amounts of π* back-bonding, and are consistent with DFT calculations (BP86). The DFT calculated values for K3[FeIII(CN)6] are 75% t2g, 54% eg and 14% π*, while for K4[FeII(CN)6] the DFT calculations give 57% eg and 16% π*. The study revealed that π back-donation has strong effects on the L-edge spectral shape, and that it is possible to quantify the separate effects of σ and π donation, and π back-donation using a three configuration VBCI model.
3.5 Probing DOC in heme Fe sites
3.5.1 Heme vs. non-heme, low-spin ferric porphyrin
The ability to probe electron delocalization due to both ligand to metal (i.e. donation) and metal to ligand (i.e. back-bonding) charge transfer effects make L-edge XAS particularly well suited to the investigation of metal porphyrins. The porphyrin affects the properties of the heme Fe center and is difficult to probe by optical spectroscopy due to the dominant π to π* transitions which obscure features associated with the metal center valence orbitals. Determining how the Fe valence electrons delocalize into the porphyrin is important to understanding the role of heme in biology, in processes that include electron transfer, where interactions between donor and acceptor redox sites are facilitated by super-exchange pathways, and oxygen activation, where delocalization into the porphyrin changes the catalytic frontier molecular orbitals (FMOs). L-edge XAS can be used to compare heme versus non-heme Fe electronic structure, as the intensity directly probes the unoccupied orbitals with metal character, even in highly covalent enviroments [70, 71]. Low-spin Fe(II) and Fe(III) heme complexes, [Fe(tpp)-(ImH)2] and [Fe(tpp)-(ImH)2]Cl, were investigated and compared to non-heme low spin reference compounds with no π donation or back-bonding, [FeIII(tacn)2]3+ and [FeIII(tacn)2]2+. Figure 3.7 compares the L-edge spectra for the heme versus non-heme complexes. The L-edge XAS of the heme complexes were simulated with the charge transfer multiplet model under D4h symmetry, and the differences in going from non-heme to heme were identified. The heme Fe(II) L-edges are broader than the non-heme FeII L-edge (Figure 3.7 a) due to the addition of 10% π* back-bonding, which adds additional intensity that overlays with the high energy side of the eg-orbital set. Additionally, the L-edge of the heme complex is shifted to higher energy with respect to the non-heme due to strong σ donation in the heme, increasing the ligand field, shifting the dx2−y2 and dz2 to higher energy. Comparing the Fe(III) compounds, the non-heme t2g peak is of greater intensity and is separated from the main L3 multiplet by a larger energy than that of the heme compound. Charge transfer multiplet simulations reveal that these differences are due to strong π porphyrin donation into the dπ hole. The simulations also reveal, from the intensity distribution of the dσ peak, that in [Fe(tpp)-(ImH)2]Cl the dx2−y2 is more covalent than the dz2 indicating that the heme is a stronger donor ligand than the axial imidazole ligands (Figure 3.7 b). The study identifies that there is strong π donation in the low spin heme Fe(III) that produces the redox active molecular orbital (dπ character of 54%) and little π back-bonding, whereas the heme Fe(II) HOMO has 10% ligand π back-bonding character. The relative strengths of the π donor and acceptor interactions in Fe porphyrins indicate that the electron transfer mechanism in heme metalloproteins, such as cytochromes, involves a hole type superexchange mechanism through the ligand valence orbitals that is facilitated by strong π donation from the porphyrin into Fe(III) dπ* orbitals. The strong heme π donation also plays an important role in stabilizing intermediates in catalytic cycles.
Figure 3.7.
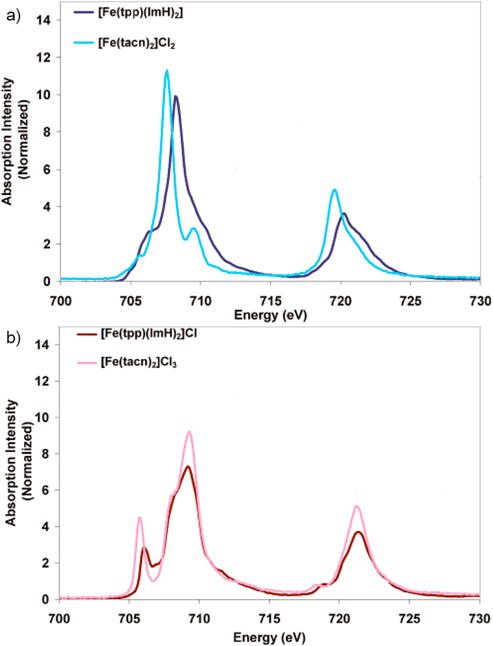
Fe L-edge XAS of heme versus non-heme Fe compounds: a) FeII heme complex [Fe(tpp)(ImH)2] and FeII non-heme complex [Fe(tacn)2]Cl2; b)FeIII heme complex [Fe(tpp)(ImH)2]Cl and non-heme complex [Fe(tacn)2]Cl3. Adapted from Ref.[71].
Oxy-picket fence porphyrin
The nature of the Fe-O2 bond present in oxy-myoglobin (Mb) and oxy-hemoglobin (Hb) is a long standing issue in bioinorganic chemistry, and a wealth of spectroscopic and computational studies have been applied in attempt to understand the electronic structure of their active sites. While the geometric structure of the Fe-O2 bond is known, the electronic structure of the Fe center has been ambiguous due to the electron delocalization of the porphyrin. The deoxygenated form of both proteins are high-spin FeII, S = 2, and become diamagnetic upon dioxygen binding. Three possible descriptions of the spin singlet ground state of oxyhemoglobin are generally considered: a low spin (S=0) ferrous center with diamagnetic O2, as proposed by Pauling [72], a low-spin (S=1/2) ferric center antiferromagnetically coupled to a O2− doublet, as proposed by Weiss [73], and an intermediate (S=1) ferrous center antiferromagnetically coupled to an O2 triplet as proposed by McClure [74], Harcout [75], and Goddard [76]. The sensitivity of L-edge absorption spectroscopy for probing electron delocalization was applied to shed new light on this long standing problem. The nature of the Fe-O2 bond was studied in Collman’s biomimetic Fe-O2 heme complex Fe picket fence porphyrin [Fe(pfp)-(1-MeIm)O2] (pfp = meso-tetra(α,α,α,α-o-pivalamidophenyl)porphrin) [77]. The L-edge spectrum of Fe-O2 pfp (Figure 3.8 a) has no clear t2 − π (dπ) peak, which would be associated with a low-spin ferric porphyrin (S=1/2) such as [FeIII(tpp)(ImH)2]Cl (Figure 3.8 b; yellow). Further comparison with other heme model complexes finds Fe-O2 pfp to be most similar to [FeII(pfp)(1-MeIm)2] (S=0) (Figure 3.8 b; blue), with least resemblance to an intermediate S=1 [FeII(pfp)] with no axial ImH (Figure 3.8 b; red). Charge transfer multiplet calculations were performed, starting from both ferrous and ferric ground states, using the lack of a dπ peak in the Fe-O2 pfp experimental spectrum (Figure 3.8 a) as a reference for the amount of charge transfer between the Fe and O2. Starting from the ferrous limit (Figure 9 a, bottom), the maximum MLCT into O2 is no greater than 30% and in the ferric limit (Figure 9 b, bottom) a similar maximum for the amount of LMCT donation from the O2 was determined, whereas calculations outside of these limits produced a clear dπ hole type peak (indicated with a ‘*’ in Figure 3.9). The best fit of Fe-O2 pfp (Figure 3.8 a) starting from a Fe(II) ground state with both MLCT and LMCT gives the dπ character to be 15% ± 5, while also revealing strong σ donation from the O2 into the dz2 of the Fe. The investigation emphasizes the limitation of oxidation state formalisms for the highly covalent Fe-O2 bond. The L-edge spectrum of Fe-O2 pfp shows an absence of a hole in the dπ orbital of the Fe, indicating a strong π interaction between the Fe and O2, limiting the extent of spin-polarization in the Fe-O2 bond. This eliminates the antiferromagnetically coupled FeIII O2− radical (the Weiss model for Fe-O2 pfp). In pfp there is no hydrogen bond to the outer oxygen of the Fe-O2; in Hb and Mb such a hydrogen bond is present and proposed to have an important role on Fe-O2 spin polarization [78]. It would be important to now obtain L-edge data for oxy-Hb or Mb, which, however, is challenging due to the complexity of detecting L-edge spectroscopic signals for proteins, which are of low Fe concentration and in solution.
Figure 3.8.
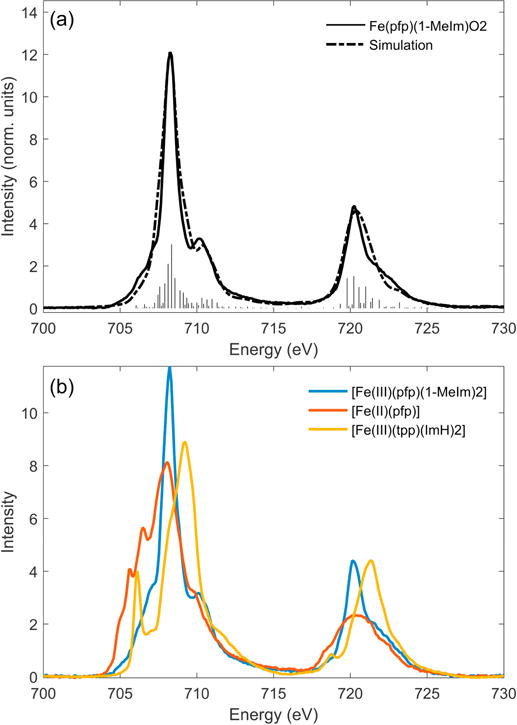
(a) L-edge spectrum of [Fe(pfp)-(1-MeIm)O2] (Fe-O2 picket fence porphyrin) with charge transfer multiplet fit. (b) L-edge spectra of [FeII(pfp)(1-MeIm)2], [FeII(pfp)] and [(FeIII(tpp)ImH)2]. Adapted from Ref. [77]
Figure 3.9.
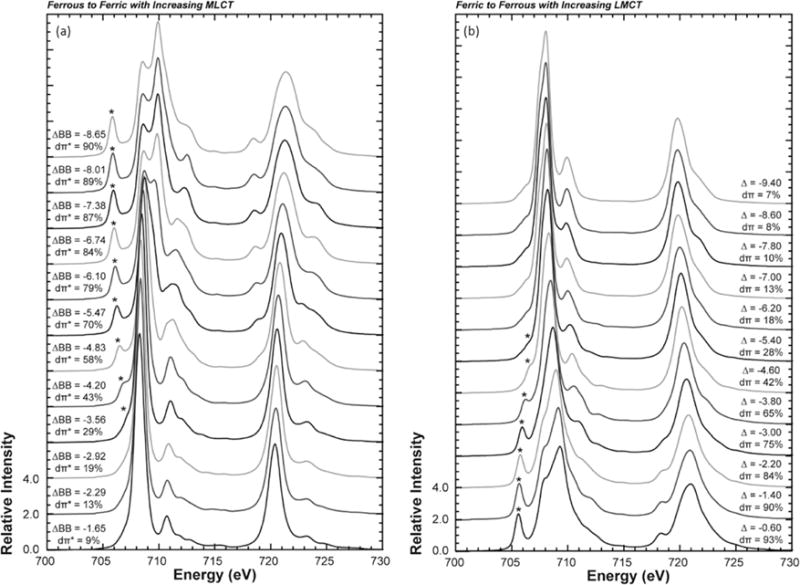
(a) multiplet simulations progressing from a ferrous low-spin (ΔBB = −1.65 eV) to a ferric low spin (ΔBB = −8.65 eV) resulting in more MLCT from 9% to 90% dπ* hole character on the iron. (b) Multiplet simulations progressing from ferric low-spin (Δ = −0.60 eV) to ferrous low spin (Δ = −9.40 eV) resulting in more LMCT into the dπ hole, giving rise to a simulation with predominantly d6 character. Adapted from Ref [77].
3.6 Outlook
There are significant challenges in progressing from model complexes to metalloenzymes and proteins with low metal ion concentrations. The low penetration depth of soft X-rays limit the volume of sample probed, and detection methods such as electron yield reduce the active penetration depth even further to ~10 Å. The shorter active depth probed by L-edge XAS can make the method particularly susceptible to radiation damage, which must be carefully managed. Radiation damage is sample specific and depends on temperature and pressure. It is hence important to perform control experiments to determine the maximum X-ray exposure time for each sample and measurement condition. Measuring the total emitted fluorescence increases the active penetration depth to greater than 1000 Å, however in biological samples the large number of oxygen atoms present dominate this fluorescence, masking the fluorescence of transition metal ions. Resolving the energy of fluorescence emissions, such that oxygen emissions can be separated from the metal ion emissions can overcome this limitation, as demonstrated in the study of blue Cu plastocyanin [56] (Figure 3.1 a) and other examples [79]. However, to extend this method beyond Cu to other transition metals, with lower energy emission lines, is more challenging due their proximity in energy with the oxygen Ka emissions, at ~525 eV, that dominate in biological systems. Hence, to study transition metal active sites, such as iron, another method is needed as described below.
4. RIXS
4.1 Introduction
Resonant inelastic X-ray scattering (RIXS) is an advanced X-ray technique that combines XAS with X-ray emission spectroscopy (XES). RIXS is a two-photon process that starts with the excitation of a core electron into a valence orbital, as in XAS, followed by detection of a photon emitted by the decay of an electron from a different orbital filling the core hole, as in XES [80, 81]. The RIXS data can be plotted as a two-dimensional plane, with the incident energy on the x-axis and the energy transfer (incident – emitted) on the y-axis (Figure 4.1) [82–84]. The higher dimensionality of the RIXS data gives more information than standard XAS experiments [10]. RIXS experiments can be performed in a variety of ways on a variety of samples. In the soft X-ray (0.1–2 keV) regime, RIXS has been performed on, for example, the C, N, and O K-edges in small molecules [85], metal oxides [86], and coordination compounds [87]. 2p3d RIXS (2p→3d excitation, 3d→2p emission) is also commonly used to study d-d interactions, ligand field, and charge transfer effects in Ti [88], Mn [89], Fe [87], and Ni [89, 90] compounds. In the hard X-ray (>2 keV) regime, 2p5d RIXS can be used to probe the valence orbitals of 5th row transition metals such as platinum [91]. 2p3d RIXS is also used to study the electronic structure of lanthanides [92]. This review will focus on using 1s2p RIXS to gain detailed electronic structure information in Fe compounds and proteins.
Figure 4.1.
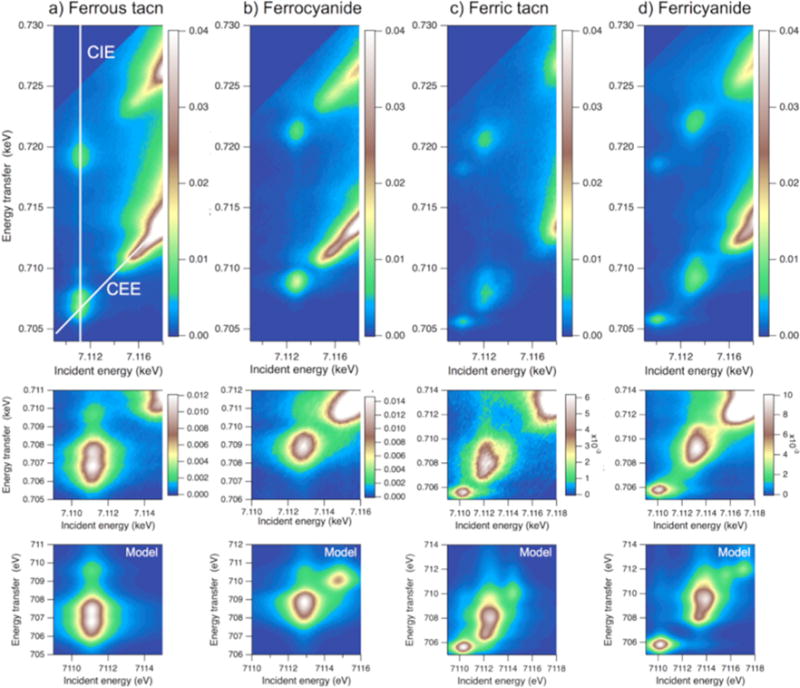
Experimental RIXS planes for ferrous tacn [FeII(tacn)2]Br2, ferrocyanide K4[FeII(CN)6], ferric tacn [FeIII(tacn)2]Br3 and ferricyanide K3[FeIII(CN)6] (\rst row). In the ferrous tacn spectrum, white lines show constant incident energy (CIE) and constant emission energy (CEE) cuts. The second row shows expanded pre-edge regions where the maximum of the color scale corresponds to the peak of the pre-edge. The third row shows VBCI modeling results for the corresponding pre-edge region. As the model only includes quadrupole transitions, the dipole-dominated rising edge is not described. Adapted from Ref.[93].
1s2p RIXS (Ka RIXS) involves a 1s→3d quadrupole excitation, as in K-edge XAS, followed by a 2p→1s electric dipole emission to give a final 2p53dN+1 configuration, the same as in L-edge XAS. Ka RIXS thus provides both K-edge and L-edge-like information in a single experiment (Figure 4.2). As mentioned in Section 3, L-edge XAS analyzed with a charge transfer multiplet model can provide detailed electronic structure insight into Fe centers (i.e. DOC) (Sections 3.4 and 3.5), but probing solution and protein samples can be very difficult with L-edge XAS (Section 3.6). K-edge XAS uses high-energy photons (~7110 eV) and can be used on a wide variety of samples. Ka RIXS therefore provides a method of obtaining L-edge-like information from samples that are difficult to measure with the traditional L-edge experimental setup. Because it is a different intensity mechanism however, Kα RIXS provides additional information than available in XAS experiments [93], making the three techniques complementary to each other.
Figure 4.2.
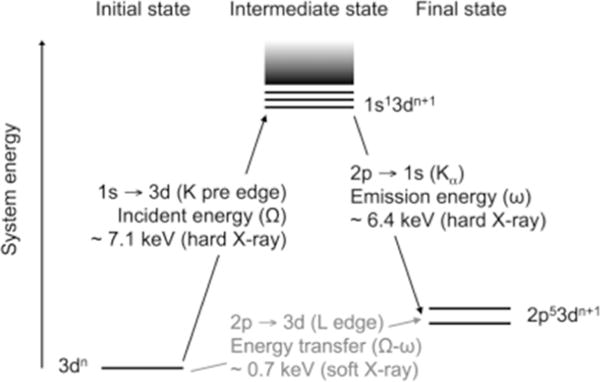
Two-step total energy schematic of the Kα RIXS process. The vertical axis shows the total energy of the electron configuration. Photon energies are shown for the case of an iron complex. Adapted from Ref.[93].
4.2 Constant emission energy cuts
To investigate the differences between Kα RIXS, K-edge XAS, and L-edge XAS, Ka RIXS and K-edge XAS were performed on the low-spin model compounds, ferrous tacn ([FeII(tacn)2]Br2) and ferrocyanide (K4[FeII(CN)6]), and their complementary low-spin ferric forms [93], which have been characterized by L-edge XAS in our previous studies [60, 69] (Section 3.4). The Kα RIXS planes of the compounds are shown in Figure 4.1. To obtain the K-edge-like information, a diagonal cut through the RIXS plane at a constant emission energy (CEE) (Figure 4.1 a) can be performed. This is also known as high energy-resolution fluorescence detection (HERFD), and as seen in Figure 4.3, this gives a higher energy-resolution spectrum compared to the standard K-edge XAS experiment. Since the cut goes diagonally through the RIXS plane, and the emission energy detector resolution (0.4 eV) is much higher than the broadening in the incident energy direction (1–2 eV), the broadening in the CEE cut is decreased relative to the broadening in the incident energy direction, unlike the standard K-edge XAS spectrum. Additionally, as seen in Figure 4.1, the lifetime broadening in the rising edge transitions (the incident energy range above 7.114 keV) increases at higher transfer energies. This broadening increases the background in the pre-edge region, and decreases the resolution of K-edge XAS, which integrates over all final states. The CEE cut avoids this problem since it can be done at lower transfer energies where the broadening from the rising edge is less pronounced. Shoulders in the rising edge can be resolved as in the ferrous CEE cuts (Figure 4.3 a,b), and the low-energy peak corresponding to the transition into the t2g hole is also more easily resolvable in the ferric systems (Figure 4.3 c,d).
Figure 4.3.
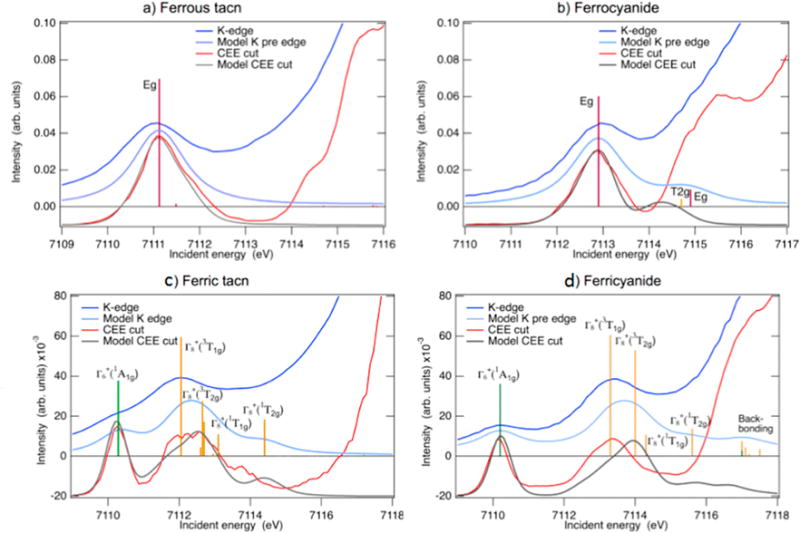
Spectra in the K pre-edge region for ferrous tacn (top left), ferrocyanide (top right), ferric tacn (bottom left), and ferricyanide (bottom right). Experimental K pre-edge spectra (blue) are compared to the spectra from the VBCI multiplet model (light blue). Modeled absorption resonances are shown as sticks. Experimental CEE cuts through the maximum of the pre-edge resonance (red) are compared to the corresponding cuts through the modeled RIXS plane (gray). The CEE cuts are arbitrarily scaled to facilitate comparison with the K pre-edge. Adapted from Ref.[93].
Since the CEE cut is diagonal through the RIXS plane, it can however be affected by off-diagonal resonances. In the ferrous tacn CEE cut (Figure 4.3 a), there is a shoulder in the pre-edge at 7112 eV. This shoulder is not an actual pre-edge transition, but instead is intensity that originates with an off-diagonal resonance. These off-diagonal resonances come from 2p-3d interactions that lead to multiple final states arising from the same intermediate state (vide infra). Since the intermediate state is the same, the incident energy is the same, and the final states simply differ in the energy transfer. As seen in the ferrous tacn pre-edge (Figure 4.1 a), there are two major resonances at 706.8 eV and 707.6 eV in the energy transfer direction, at the same incident energy, 7111.1 eV. Due to the large lifetime broadening in the incident energy direction, the diagonal cut through the resonance at 706.8 eV contains a portion of the resonance at 707.6 eV, leading to the shoulder at 7112 eV in Figure 4.3 a. This demonstrates that it is important to measure the full RIXS plane (rather than just the HERFD) in order to determine whether peaks in the CEE cuts are due to 1s^3d transitions or are a result of off-diagonal resonances.
Since the CEE cut is diagonal through the RIXS plane, it can however be affected by off-diagonal resonances. In the ferrous tacn CEE cut (Figure 4.3 a), there is a shoulder in the pre-edge at 7112 eV. This shoulder is not an actual pre-edge transition, but instead is intensity that originates with an off-diagonal resonance. These off-diagonal resonances come from 2p-3d interactions that lead to multiple final states arising from the same intermediate state (vide infra). Since the intermediate state is the same, the incident energy is the same, and the final states simply differ in the energy transfer. As seen in the ferrous tacn pre-edge (Figure 4.1 a), there are two major resonances at 706.8 eV and 707.6 eV in the energy transfer direction, at the same incident energy, 7111.1 eV. Due to the large lifetime broadening in the incident energy direction, the diagonal cut through the resonance at 706.8 eV contains a portion of the resonance at 707.6 eV, leading to the shoulder at 7112 eV in Figure 4.3 a. This demonstrates that it is important to measure the full RIXS plane (rather than just the HERFD) in order to determine whether peaks in the CEE cuts are due to 1s→3d transiMons or are a result of oc-diagonal resonances.
4.3 Constant incident energy cuts
As shown in Figure 4.1 a, a vertical cut at constant incident energy (CIE) can also be performed. The CIE cut shows all of the final states that arise from a given 1s → 3d intermediate state. This means the lifetime broadening in the CIE cut arises solely due to the 2p hole in the final states, which is significantly less (~0.4 eV in L3 and ~0.8 eV in L2) than the 1s core hole lifetime broadening in the incident energy direction (~1.2 eV) [10]. While the spectrum along the incident energy axis is dominated by d-d ligand field and multiplet interactions, the spectrum along the energy transfer axis is dominated by 2p-3d interactions and 2p spin-orbit coupling, giving an L-edge-like spectrum [94]. As seen in Figure 4.4, 2p spin-orbit coupling splits the CIE cut into two main regions, the Kα1 region at lower energy transfer, with final states corresponding to the L3 (J = 3/2) edge of the L-edge XAS, and the Kα2 region at higher energy, with final states corresponding to the L2 (J = 1/2) edge [10]. For the ferrous samples (Figure 4.1 a,b), the dominant pre-edge resonances occur at a single incident energy. This means the CIE through the pre-edge is directly analogous to the L-edge XAS spectrum, but with RIXS selection rules (vide infra) (Figure 4.4 a,b).
Figure 4.4.
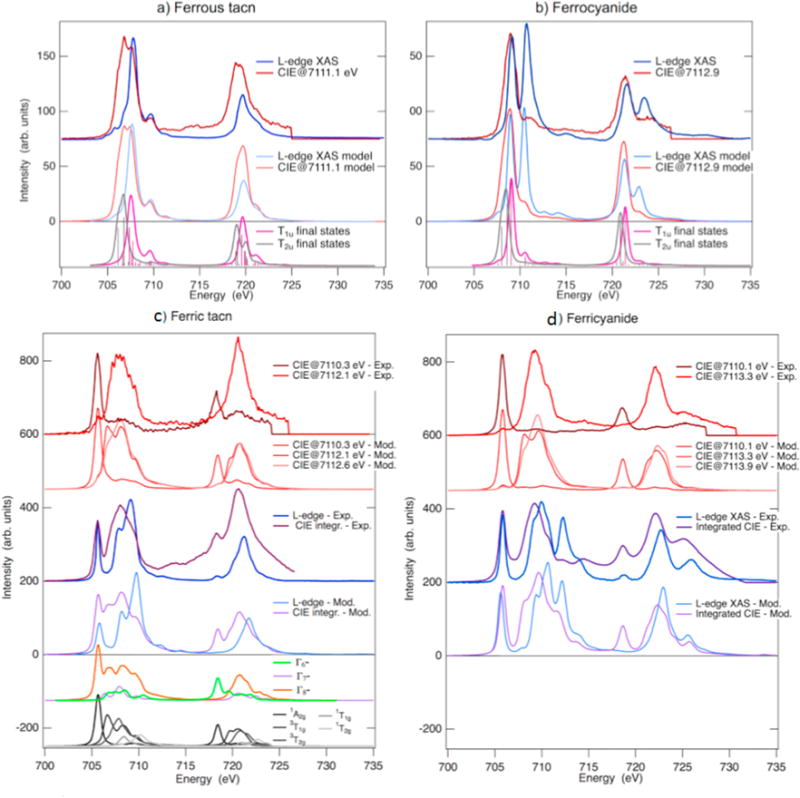
Comparison of the RIXS CIE cut from the maximum of the pre-edge resonance (dark red) to the L-edge XAS spectrum (dark blue) of ferrous tacn (top left) and ferrocyanide (top right). The results from the VBCI multiplet model are shown below the experimental results for both CIE cut (light red) and L-edge XAS (light blue). Separate contributions to the RIXS CIE spectra from final states of T1u (Γ4−) and T2u (Γ5−) symmetry are shown in purple and gray, respectively. Experimental and modeled CIE cuts through the center of the pre-edge features, together with integrated CIE spectra (purple) and L-edge XAS (blue) for ferric tacn (bottom left) and ferrocyanide (bottom right). The integrations of the experimental CIE spectra are done up to an incident energy of 7115.0 eV for ferric tacn and 7114.3 eV for ferricyanide to limit the effects from the rising edge. Contributions to the integrated CIE spectrum of ferric tacn from final states of different symmetry are shown in light green (Γ6−), violet (Γ7−), and orange (Γ8−), and contributions from different intermediate states, labeled by the symmetry of the valence state, are shown at the bottom. Adapted from Ref.[93].
For the ferrous spectra, the most obvious difference between the CIE and L-edge XAS spectra in Figure 4.4 a,b is that the CIE has much broader peaks in the L3 and L2, regions with greater intensity at lower energy compared to the L-edge XAS. From the comparison of the ferric compounds (Figure 4.4 c,d), the lifetime and instrument broadening in both the CIE cut and L-edge XAS are very similar, since the low-energy peak corresponding to transitions into the low-spin ferric t2g hole has the same width in both experiments. This means that the broadening seen in the CIE cuts of the ferrous compounds is due to final states accessible by RIXS, but not by L-edge XAS. The differences in selection rules are investigated further in the next section. Another major difference observed in all the compounds (Figure 4.4) comes from the higher background intensity in the L2 region. As mentioned above, this background intensity comes from the large incident energy broadening of the rising edge that bleeds into the CIE cut.
For the ferric compounds, the pre-edge now has resonances occurring at multiple incident energies (Figure 4.1 c,d). This means that multiple CIE cuts are required to compare with the L-edge XAS. These CIE cuts can be integrated over the different resonances to provide a full spectrum that is directly comparable to the L-edge XAS (Figure 4.4 c,d, 3rd rows). The L3 portions of the ferric spectra show two main features: the sharp low-energy peak corresponding to 1s→3d transiMons into the t2g hole, and the broader feature at higher energy corresponding to 1s→3d transiMons into the eg orbitals. As with the ferrous spectra, the eg features are broader in the low-energy side in the CIE compared to the L-edge XAS, corresponding to additional final states probed by the RIXS experiment due to the different selection rules (vide infra). Additionally, the t2g peak in the L2 is higher in intensity in the CIE cut than in the L-edge XAS spectrum.
The final major difference between the CIE and L-edge spectra is in the intensity of the π* back-bonding peaks. For ferrocyanide (Figure 4.4 b), the CIE cut (in red) has very little intensity at 710.7 eV where the intense π* back-bonding peak is located in the L-edge XAS spectrum (in blue). Likewise, the ferricyanide (Figure 4.4 d, 3rd row) CIE shows little intensity where the π* back-bonding is in the L-edge XAS spectrum at 712.2 eV (in blue). Since RIXS accesses more final states than L-edge XAS, while L-edge XAS more clearly probes the π* back-bonding peaks, the two methods provide complementary information and thus very detailed experimental electronic structure insight when analyzed together.
4.4 RIXS selection rules
As mentioned above, different final states are accessible in RIXS CIE cuts compared to L-edge XAS, since RIXS is a two photon process, while L-edge XAS is a single photon process. This is illustrated in Figure 4.5. In the ferrous case, on the left, the ground state has A1g symmetry. The final state has a 2p hole of T1u symmetry and an electron in a 3d(eg) orbital, which couple to give final states of T1u and T2u symmetry. In the L-edge XAS experiment, the 2p→3d excitation involves electric dipole selection rules and only accesses final states of T1u symmetry. In Kα RIXS, the initial 1s→3d excitaMon involves electric quadrupole selecMon rules (transform as t2g and eg in Oh) to give an Eg intermediate state. The subsequent Kα emission is electric dipole allowed (T1u), and thus accesses final states of both T1u and T2u symmetry. Ignoring spin-orbit coupling, a component of the T1u final state wavefunction can be written as a product of the 2pz electron with a 3dz2 electron, while a component of the T2u final state is a product of the 2pz electron with a 3dx2−y2 electron. Due to the difference in d orbital shapes relative to 2pz, the T1u state experiences greater electron repulsion than the T2u state, resulting in its higher energy. This is the origin of the additional intensity in the CIE cut compared to the L-edge spectrum and why it (i.e. the T2u states) occurs at lower energy (Figure 4.4 a,b). The ferric case (Figure 4.5, right), is similar to the ferrous case (Figure 4.5, left), with the two-photon Kα RIXS accessing final states that are forbidden in L-edge XAS.
Figure 4.5.

Relevant symmetry selection rules in Oh symmetry for K?? RIXS and L-edge XAS from the A1g (Γ1+) ground state of in low-spin ferrous complexes (left) and from the Γ7+ ground state of low-spin ferric complexes (right). Adapted from Ref.[94].
To investigate the bonding in iron compounds with Kα RIXS, the same charge transfer multiplet model used to analyze L-edge XAS data can be used to analyze the RIXS data. In this model, the cross section at a core resonance, F(Ω,ω), is dominated by the resonant contribution to the scattering in the Kramers-Heisenberg formula [80, 81]:
where Ω and ω are the incident and emission energy, respectively, with Ω – ω being the energy transfer, that gives L-edge-like spectra. Using this model, the Kα RIXS data of the tacn and cyanide compounds were simulated with the same parameters used to simulate the L-edge XAS data of the compounds in previous studies [60, 69]. The charge transfer multiplet model accurately reproduced the experimental RIXS plane (Figure 4.1), CEE cuts (Figure 4.3), and CIE cuts (Figure 4.4). This shows that simultaneous fitting of the RIXS and L-edge XAS data can provide great insight into the bonding of Fe centers. The charge transfer multiplet model accurately predicts the broader CIE cuts (Figure 4.4 a,b). The model also clearly shows the contributions from different final states. For both compounds (Figure 4.4 a,b), the model (bottom spectra) shows that the intensity at lower energy comes from T2u final states, as predicted by the different selection rules. The model also shows that the energy difference between the T2u and T1u final states is smaller in ferrocyanide than in ferrous tacn. This is due to reduced 3d-3d electron repulsion in ferrocyanide, indicating a more covalent Fe center.
In the ferric systems, the CIE cuts show larger intensity in the L2 region of the t2g resonance compared to the L-edge spectrum (Figure 4.4 c,d, dark red spectrum, top rows). This is reproduced with the charge transfer multiplet model (second row). A breakdown of the final state contributions (Figure 4.4 c, bottom rows) shows that this intensity derives from the Γ6− final states (green), which are not accessible by L-edge XAS (Figure 4.5, right). The ferric systems also show broader eg resonances, similar to the ferrous systems. Unlike in the ferrous systems, the extra intensity in the eg resonance is not solely due to newly accessible final states. The L-edge XAS forbidden Γ6− final states also do not contribute strongly to the eg resonance. Instead, the Γ8− final states, which are accessible through L-edge XAS, dominate (Figure 4.4 c, fifth row, orange). The difference in intensity patterns comes from the Kα RIXS intermediate states (i.e. the 1s→3d transiMons). From the assignment of the K-edge XAS, the 1s transition into the eg set of d orbitals gives (t2g)5(eg)1 and 3T1g, 3T2g, 1T1g, and 1T2g states. The intensity on the lower energy side of the eg resonance primarily comes from the 3T1g intermediate state, while the contributions to the intensity at higher energy comes from singlet intermediate states (Figure 4.4 c, bottom row). Since the intensity of the triplet states is higher in the K-edge absorption process compared to the singlet states (Figure 4.3 c), their contribution to the RIXS spectral intensity dominates. Thus in the ferric systems, which have multiple K-edge absorption resonances (Figure 4.3 c,d), both the intermediate states and the final states in RIXS are important in shaping the RIXS plane.
The different selection rules in Kα RIXS are also responsible for the difference in intensity of the π* back-bonding features mentioned in the previous section (strong in L-edge XAS, weak in RIXS). The lack of back-bonding intensity in the experimental CIE cuts is partly due to the main π* back-bonding resonance occurring at a higher incident energy. While the raw RIXS data do not show extra resonances due to overlap with the rising edge, they can be simulated using the charge transfer multiplet model. This is seen in Figure 4.1 b,d, bottom, where resonances at higher incident energy (7114.7 eV for FeII and 7117.4 eV for FeIII) are present in the cyanide compounds and not in the tacn compounds (Figure 4.1 a,c). These resonances are affected by changing the contribution of the metal-to-ligand charge transfer configuration and correspond to the π* back-bonding resonance. The ferrocyanide CIE cut is done at 7112.9 eV, but as seen in the model simulations, the main π* back-bonding resonance occurs at 7114.7 eV. This π* back-bonding feature appears at 7117.4 eV in the ferricyanide RIXS, where the CIE cuts are done at 7110.9 eV and 7113.3 eV. As seen in the CEE cuts, however (Figure 4.3 b,d, red), these resonances are overlapped by the strong rising edge transitions, and are difficult to experimentally probe through the RIXS.
The modeled intensity of the RIXS π* back-bonding resonance (Figure 4.3 b,d, black) is still lower compared to the intensity of the L-edge XAS back-bonding peak however. This is due to the different selection rules. In the L-edge XAS experiment, while the 3d (eg) and CN− π* (t2g) orbitals have different symmetries, the 2p hole couples with both to give final states of T1u symmetry. Having the same symmetry and small energy gap between these states allow for excitations into the CN− π* orbitals to borrow intensity from the main eg excitation and this accounts for the strong L-edge intensity. Alternatively, the K-edge excitation of RIXS involves a 1s orbital hole with A1g symmetry and gives intermediate states of Eg and T2g symmetry for transitions into the 3d and π* orbitals, respectively. Since they do not have the same symmetry, intensity borrowing does not occur and the π* excitation is relatively weak. This combined K-edge and L-edge XAS, and Kα RIXS study shows that RIXS can be a powerful technique in probing iron centers, and the different selection rules make the techniques complementary to each other. Additionally, the study shows that the charge transfer multiplet model used in L-edge analysis can also be applied to RIXS with the same efficacy to provide electronic structure information. This also standardizes RIXS for use when L-edge XAS is not possible as in metalloenzyme intermediates.
4.5 Probing highly covalent heme systems
As indicated in the introduction, the major experimental advantage of Kα RIXS is that it can be used to probe metalloprotein and solution samples to gain L-edge-like information. Kα RIXS, in conjunction with the charge transfer multiplet model, was applied to cytochrome c (cyt c) in order to experimentally determine the DOC and explore the bonding in the reduced and oxidized forms of the protein [95]. The Fe center in heme proteins have been difficult to directly study with traditional spectroscopic methods (see Section 3). This is the first time that a protein has been investigated through Kα-RIXS with the extraction of DOC, allowing for a correlation between the structural and electronic properties in this and eventually other biological systems [95]. Cyt c is a paradigm protein for probing structure-function relationships in bioinorganic chemistry. While cyt c is an electron transfer (ET) protein, it also functions as a peroxidase in programmed cell death (e.g., apoptosis), which requires cleaving the S(Met)-Fe bond [96]. To calibrate the RIXS analysis, L-edge XAS and Kα RIXS data were collected on two heme model compounds FeII(tpp)(ImH)2 and [FeIII(tpp)(ImH)2]+ (tpp=tetraphenylporphyrin, ImH=imidazole) [71], in addition to the Kα RIXS measurements of both reduced and oxidized cyt c. Figure 4.6 shows the structure of the model compared to the protein active site, with the primary difference being the S-Met axial ligand in the protein compared to N-His in the model. Figure 4.7 shows the reduced cyt c RIXS data and a comparison of the CEE and CIE cuts with the ferrous model. The CEE and CIE data show that the model and protein are indeed very similar. The primary differences are seen in the CIE cuts, where the protein has less intensity in the shoulder at 710 eV and also has a more intense L2 edge. These differences can be reproduced using the charge transfer multiplet model, which gives a difference in the DOC. This analysis showed that the axial methionine in the protein is more covalent than the histidine in the model (70% vs 77% metal character, respectively, in the dz2 orbital).
Figure 4.6.
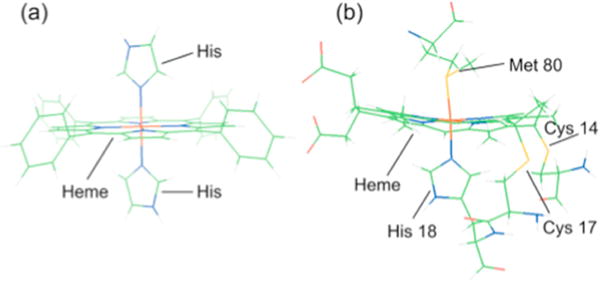
Molecular structures of (a) FeTPP(ImH)2, and (b) its active side counterpart in cytochrome c. Adapted from Ref.[95].
Figure 4.7.
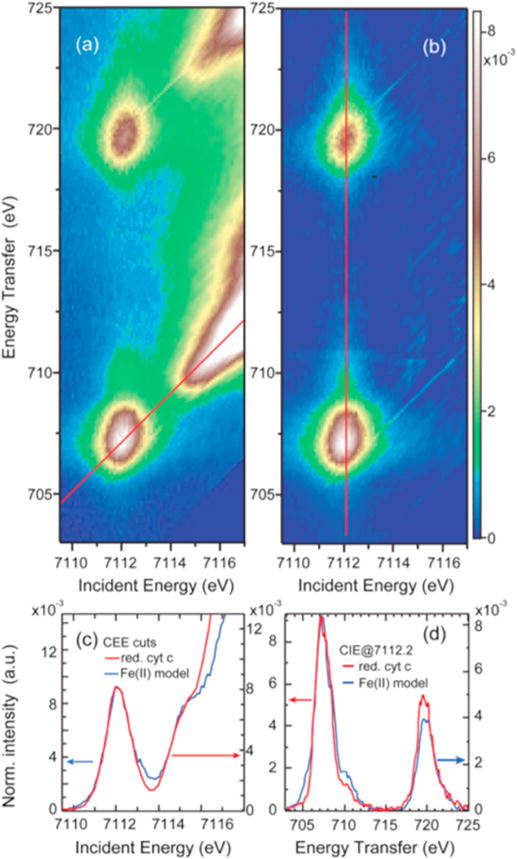
Ferrous cyt c: (a) Full 1s2p RIXS plane; (b) rising-edge subtracted Kα RIXS plane; (c) comparison of the CEE cut through the uncorrected plane (red line in (a)) with the CEE cut of FeIITPP(ImH)2; (d) comparison of the CIE cut along the red line in (b) with the CIE cut of FeIITPP(ImH)2. Adapted from Ref.[95].
Figure 4.8 shows the RIXS data of the oxidized cyt c, and a comparison of the CEE and CIE cuts with the ferric bis-imidazole model compound. In the CEE cuts, the low-energy peak is lower in intensity for the protein, while the main peak is shifted lower in energy. In the CIE cuts associated with dπ excitation (green), the protein has less intensity in the low energy peak, but higher intensity in the 708.2 eV shoulder. In the cuts associated with dσ excitation (red), the protein peak is shifted 0.3 eV lower in energy. As in the ferrous case, the protein has a higher intensity L2 edge than the model. Reproducing the spectral differences with the charge transfer multiplet model shows that the dz2 orbital is also more covalent in the ferric protein compared to the bis Im model (62% vs 67% metal character respectively). This shows that the bond to the axial methionine is more covalent than to the histidine in both the reduced and oxidized forms. Also the Fe-S(Met) covalency is higher in the ferric than the ferrous state. Additionally, the DOC analysis shows that the reduced form of cyt c has more π* back-bonding into the porphyrin than the oxidized form (7% vs 3% metal 3d character).
Figure 4.8.
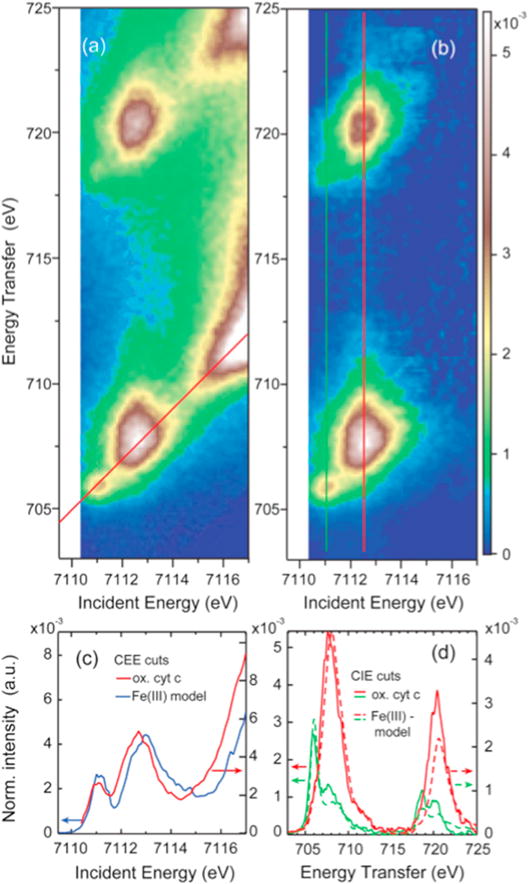
Ferric cyt c: (a) Full 1s2p RIXS plane, (b) rising-edge subtracted Kα RIXS plane, (c) comparison of the CEE cut through the uncorrected plane (red line in (a)) with the CEE cut of FeIIITPP(ImH)2, (d) comparison of the CIE cuts along the green and red lines in (b) with the corresponding CIE cuts of the ferric model complex. Adapted from Ref.[95].
These results were used to calibrate DFT calculations which showed that, although the Fe-S(Met) bond is more covalent than the Fe-N(His) bond, the Fe-N(His) bond is stronger than the Fe-S(Met) (7.2 vs 2.6 kcal/mol in FeII, 14.7 vs 5.5 kcal/mol for FeIII) because the N(His) σ donor orbital is 1.1 eV lower in energy than the Met b1 valence donor orbital (see Section 3.4.2 for π and σ covalency contributions to ligand-metal bond strength). Importantly, these results show that S(Met) binds more strongly to the FeIII than the FeII. Past studies that treated the S(Met)-Fe bond as stronger in the reduced state than in the oxidized state, in fact, reflect the fact that both N(His) and H2O replacement ligands bind stronger to the FeIII than the FeII center relative to Met. This study also shows that the FeII-S(Met) bond is weak (2.6 kcal/mol) and under entatic (i.e. constrained) control by the protein to keep it bound at physiological temperature (i.e. to overcome the entropic contribution to the Gibbs free energy) for its electron transfer function.
4.6 Outlook
The study on cytochrome c established a methodology utilizing RIXS to study the bonding in metalloproteins with highly covalent active site environments. Model compounds that are measurable by both RIXS and L-edge XAS are first analyzed, in order to create a framework through which the RIXS data of the metalloprotein site, not easily accessible by L-edge XAS, can be analyzed. This methodology can be extended to other heme enzyme sites, such as Fe-O2 in oxyhemoglobin (with [Fe(pfp)-(1-MeIm)O2] as a reference model compound (Section 3.5.2)) and FeIV=O sites in compound I and II in a range of metalloenzymes and their models.
5 Concluding Comments
X-ray absorption spectroscopy at the K-edge and L-edge accesses rich electronic structure information. Both methods can be used to probe the unoccupied 3d orbitals of transition metal sites; however, their different absorption transition operators lead to specific sensitivities, giving complimentary information. Metal K-edge spectroscopy includes both electric quadrupole (1s → 3d) pre-edge and electric dipole (1s → 4p) edge transitions. The K pre-edge is sensitive to coordination number and symmetry, exhibiting enhanced intensities in non-centrosymmetric coordination environments due to ligand-enabled mixing of metal 4p character into the 3d orbitals. K-edge XAS can thus be used to quantify this 3d – 4p mixing, as well as aspects regarding the covalency of ligand-metal bonds, particularly from shakedown transitions on the edge. L-edge XAS probes electric dipole allowed 2p → 3d transitions providing a more direct probe of covalent delocalization in that the covalency of specific d orbitals can be differentiated. With the use of charge transfer multiplet simulations of the entire L-edge spectral shape, the DOC of metal ions can be obtained, leading to detailed insight into ligand-metal σ and π donation and π back-bonding. The short penetration depth of L-edge XAS limits applicability for the study of low concentration biological systems. Fluorescence detection can to some extent overcome the short penetration depth of electron yield detected L-edge XAS, extending the detected depth to over 1000 Å. However, for the study of bioinorganic metal sites, the fluorescence from non-metal atoms can dominate the total emission (particularly the oxygen Kα emissions), masking the weaker emissions that originate from the metal centers. Discrimination of emission energies can be achieved to some extent with Ge diode or Si drift detection, however in many cases further development, such as dispersion methods [97, 98], will be required, before partial fluorescence detected L-edge XAS can be applied to transition metal sites in biological systems. K-edge XAS requires hard X-rays, which are more deeply penetrating in matter than soft X-ray L-edge XAS, and is better suited for the study of low concentration samples. K-edge XAS, however lacks the detailed sensitivity to differential orbital covalency that L-edge provides. Resonant inelastic X-ray scattering (RIXS) combines hard X-ray K-edge absorption with Kα emission resulting in the same final state configuration obtained with L-edge XAS. Due to the presence of the absorption intermediate state, Kα RIXS can also access final states forbidden by L-edge XAS, and is therefore highly sensitive to DOC. RIXS spectra at pre-edge incident energies (i.e. CIE cuts) give L-edge like spectra, from which DOC can be extracted. Furthermore, RIXS spectra at Kα emission energies (i.e. CEE cuts) give high resolution K-edge like spectra. Determination of DOC based on L-edge XAS and RIXS measurements requires the use of semi-empirical crystal field multiplet simulations, with valence bond configuration interactions, to uncouple multiplet effects from π and σ bonding and π back bonding contributions to spectra. Alternative theoretical methods offering ab initio approaches have recently been developed, including ROCIS [99] and RASPT2 [100, 101]. In principle, the application of these multi-reference methods will be effective in situations where metal clusters are of low symmetry, and charge transfer multiplet simulations become over parameterized.
The sensitivity of Kα RIXS to low concentration metal sites, combined with ability to access final states forbidden by L-edge XAS, make the method particularly precise for quantifying bonding contributions to frontier molecular orbitals in bio-inorganic systems. In particular we have shown that Kα RIXS can access the frontier molecular orbitals of heme sites, which cannot be accessed by traditional optical spectroscopies, due to the intense intra-ligand heme transitions and high covalency that mask signals associated with the metal ion. For these reasons it will be important to apply Kα RIXS to the study of metal heme sites in protein and enzyme systems, including, the investigation of O2 binding and activation and quantification of how heme relate to non-heme iron active sites.
Highlights.
Directly probe metal oxidation state, geometry and coordination number
Quantify differential orbital covalency
Spectroscopic access to highly-covalent sites, including hemes
Application of resonant inelastic x-ray scattering to bioinorganic sites
Acknowledgments
M.L.B. acknowledges the support of the Human Frontier Science Program. This research was supported by the National Institute of General Medical Sciences of the National Institutes of Health under award number R01GM040392 (E.I.S.), NSF grant CHE-1360046 (E.I.S.) and P41GM103393 (K.O.H). Use of the Stanford Synchrotron Radiation Lightsource, SLAC National Accelerator Laboratory, is supported by the U.S. Department of Energy, Office of Science, Office of Basic Energy Sciences under Contract No. DE-AC02-76SF00515. The SSRL Structural Molecular Biology Program is supported by the DOE Office of Biological and Environmental Research, and by the National Institutes of Health, National Institute of General Medical Sciences (P41GM103393).
Footnotes
Publisher's Disclaimer: This is a PDF file of an unedited manuscript that has been accepted for publication. As a service to our customers we are providing this early version of the manuscript. The manuscript will undergo copyediting, typesetting, and review of the resulting proof before it is published in its final citable form. Please note that during the production process errors may be discovered which could affect the content, and all legal disclaimers that apply to the journal pertain.
References
- 1.X-ray Data Booklet, Lawrence Berkeley National Laboratory. University of California; 2001. [Google Scholar]
- 2.Solomon EI, Basumallick L, Chen P, Kennepohl P. Coord Chem Rev. 2005;249:229–253. [Google Scholar]
- 3.Zhang HH, Hedman B, Hodgson KO. X-ray Absorption Spectroscopy and EXAFS Analysis: The Multiple-Scattering Method and Applications in Inorganic and Bioinorganic Chemistry. In: Solomon EI, Lever ABP, editors. Inorganic Electronic Structure and Spectroscopy, Methodology. Wiley; New York: 1999. [Google Scholar]
- 4.Kjaergaard CH, Qayyum MF, Wong SD, Xu F, Hemsworth GR, Walton DJ, Young NA, Davies GJ, Walton PH, Johansen KS, Hodgson KO, Hedman B, Solomon EI. Proc Natl Acad Sci. 2014;111:8797–8802. doi: 10.1073/pnas.1408115111. [DOI] [PMC free article] [PubMed] [Google Scholar]
- 5.Wilson SA, Chen J, Hong S, Lee Y-M, Clémancey M, Garcia-Serres R, Nomura T, Ogura T, Latour J-M, Hedman B, Hodgson KO, Nam W, Solomon EI. J Am Chem Soc. 2012;134:11791–11806. doi: 10.1021/ja3046298. [DOI] [PMC free article] [PubMed] [Google Scholar]
- 6.Park GY, Qayyum MF, Woertink J, Hodgson KO, Hedman B, Narducci Sarjeant AA, Solomon EI, Karlin KD. J Am Chem Soc. 2012;134:8513–8524. doi: 10.1021/ja300674m. [DOI] [PMC free article] [PubMed] [Google Scholar]
- 7.Cho J, Jeon S, Wilson SA, Liu LV, Kang EA, Braymer JJ, Lim MH, Hedman B, Hodgson KO, Valentine JS, Solomon EI, Nam W. Nature. 2011;478:502–505. doi: 10.1038/nature10535. [DOI] [PMC free article] [PubMed] [Google Scholar]
- 8.Halime Z, Kieber-Emmons MT, Qayyum MF, Mondal B, Gandhi T, Puiu SC, Chufán EE, Sarjeant AAN, Hodgson KO, Hedman B, Solomon EI, Karlin KD. Inorg Chem. 2010;49:3629–3645. doi: 10.1021/ic9020993. [DOI] [PMC free article] [PubMed] [Google Scholar]
- 9.Solomon EI, Hedman B, Hodgson KO, Dey A, Szilagyi RK. Coord Chem Rev. 2005;249:97–129. [Google Scholar]
- 10.Glatzel P, Bergmann U. Coord Chem Rev. 2005;249:65–95. [Google Scholar]
- 11.de Groot F. Chem Rev. 2001;101:1779–1808. doi: 10.1021/cr9900681. [DOI] [PubMed] [Google Scholar]
- 12.De Groot F, Kotani A. Core level spectroscopy of solids, CRC press. 2008 [Google Scholar]
- 13.Stöhr J. NEXAFS spectroscopy. Springer Science & Business Media; 2013. [Google Scholar]
- 14.Cabaret D, Bordage A, Juhin A, Arfaoui M, Gaudry E. PCCP. 2010;12:5619–5633. doi: 10.1039/b926499j. [DOI] [PubMed] [Google Scholar]
- 15.Roemelt M, Beckwith MA, Duboc C, Collomb MN, Neese F, DeBeer S. Inorg Chem. 2012;51:680–687. doi: 10.1021/ic202229b. [DOI] [PubMed] [Google Scholar]
- 16.Leto DF, Jackson TA. Inorg Chem. 2014;53:6179–6194. doi: 10.1021/ic5006902. [DOI] [PMC free article] [PubMed] [Google Scholar]
- 17.Chang HW, Lu YR, Chen JL, Chen CL, Lee JF, Chen JM, Tsai YC, Yeh PH, Chou WC, Dong CL. PCCP. 2016;18:18705–18718. doi: 10.1039/c6cp01192f. [DOI] [PubMed] [Google Scholar]
- 18.Darmon JM, Yu RP, Semproni SP, Turner ZR, Stieber SCE, DeBeer S, Chirik PJ. Organometallics. 2014;33:5423–5433. doi: 10.1021/om500727t. [DOI] [PMC free article] [PubMed] [Google Scholar]
- 19.Tomson NC, Williams KD, Dai X, Sproules S, DeBeer S, Warren TH, Wieghardt K. Chem Sci. 2015;6:2474–2487. doi: 10.1039/c4sc03294b. [DOI] [PMC free article] [PubMed] [Google Scholar]
- 20.Chatterjee R, Han G, Kern J, Gul S, Fuller FD, Garachtchenko A, Young ID, Weng TC, Nordlund D, Alonso-Mori R, Bergmann U, Sokaras D, Hatakeyama M, Yachandra VK, Yano J. Chem Sci. 2016;7:5236–5248. doi: 10.1039/c6sc00512h. [DOI] [PMC free article] [PubMed] [Google Scholar]
- 21.Moonshiram D, Gimbert-Suriñach C, Guda A, Picon A, Lehmann CS, Zhang X, Doumy G, March AM, Benet-Buchholz J, Soldatov A, Llobet A, Southworth SH. J Am Chem Soc. 2016;138:10586–10596. doi: 10.1021/jacs.6b05680. [DOI] [PubMed] [Google Scholar]
- 22.Shelby ML, Lestrange PJ, Jackson NE, Haldrup K, Mara MW, Stickrath AB, Zhu D, Lemke HT, Chollet M, Hoffman BM, Li X, Chen LX. J Am Chem Soc. 2016;138:8752–8764. doi: 10.1021/jacs.6b02176. [DOI] [PMC free article] [PubMed] [Google Scholar]
- 23.Vollmers NJ, Müller P, Hoffmann A, Herres-Pawlis S, Rohrmüller M, Schmidt WG, Gerstmann U, Bauer M. Inorg Chem. 2016;55:11694–11706. doi: 10.1021/acs.inorgchem.6b01704. [DOI] [PubMed] [Google Scholar]
- 24.Yan JJ, Gonzales MA, Mascharak PK, Hedman B, Hodgson KO, Solomon EI. J Am Chem Soc. 2017;139:1215–1225. doi: 10.1021/jacs.6b11260. [DOI] [PMC free article] [PubMed] [Google Scholar]
- 25.Elsen A, Jung U, Vila F, Li Y, Safonova OV, Thomas R, Tromp M, Rehr JJ, Nuzzo RG, Frenkel AI. J Phys Chem C. 2015;119:25615–25627. [Google Scholar]
- 26.Gallo E, Lamberti C, Glatzel P. Inorg Chem. 2013;52:5633–5635. doi: 10.1021/ic400350w. [DOI] [PubMed] [Google Scholar]
- 27.Glatzel P, Bergmann U, Yano J, Visser H, Robblee JH, Gu W, de Groot FMF, Christou G, Pecoraro VL, Cramer SP, Yachandra VK. J Am Chem Soc. 2004;126:9946–9959. doi: 10.1021/ja038579z. [DOI] [PMC free article] [PubMed] [Google Scholar]
- 28.Glatzel P, Schroeder H, Pushkar Y, Boron T, Mukherjee S, Christou G, Pecoraro VL, Messinger J, Yachandra VK, Bergmann U, Yano J. Inorg Chem. 2013;52:5642–5644. doi: 10.1021/ic4005938. [DOI] [PMC free article] [PubMed] [Google Scholar]
- 29.Hadt RG, Hayes D, Brodsky CN, Ullman AM, Casa DM, Upton MH, Nocera DG, Chen LX. J Am Chem Soc. 2016;138:11017–11030. doi: 10.1021/jacs.6b04663. [DOI] [PubMed] [Google Scholar]
- 30.Kunnus K, Schreck S, Föhlisch A, Electron J. Spectrosc Relat Phenom. 2015;204, Part B:345–355. [Google Scholar]
- 31.Kurian R, van Schooneveld MM, Zoltán N, Vankó G, de Groot FMF. J Phys Chem C. 2013;117:2976–2981. [Google Scholar]
- 32.Leidel N, Chernev P, Havelius KGV, Schwartz L, Ott S, Haumann M. J Am Chem Soc. 2012;134:14142–14157. doi: 10.1021/ja304970p. [DOI] [PubMed] [Google Scholar]
- 33.Penfold TJ, Reinhard M, Rittmann-Frank MH, Tavernelli I, Rothlisberger U, Milne CJ, Glatzel P, Chergui M. J Phys Chem A. 2014;118:9411–9418. doi: 10.1021/jp5055588. [DOI] [PubMed] [Google Scholar]
- 34.Thomas R, Kas J, Glatzel P, Al Samarai M, de Groot FMF, Alonso Mori R, Kavčič M, Zitnik M, Bucar K, Rehr JJ, Tromp M. J Phys Chem C. 2015;119:2419–2426. [Google Scholar]
- 35.Kau LS, Spira-Solomon DJ, Penner-Hahn JE, Hodgson KO, Solomon EI. J Am Chem Soc. 1987;109:6433–6442. [Google Scholar]
- 36.Kau L-S, Penner-Hahn J, Solomon EE, Hodgson O IK. J Phys Colloques. 1986;47 C8-1177-C1178-1180. [Google Scholar]
- 37.Smith TA, Penner-Hahn JE, Hodgson KO, Berding MA, Doniach S. Polarized Cu K-Edge Studies. In: Hodgson KO, Hedman B, Penner-Hahn JE, editors. EXAFS and Near Edge Structure III: Proceedings of an International Conference; Stanford, CA. July 16–20, 1984; Berlin, Heidelberg: Springer Berlin Heidelberg; 1984. pp. 58–60. [Google Scholar]
- 38.Hahn JE, Scott RA, Hodgson KO, Doniach S, Desjardins SR, Solomon EI. Chem Phys Lett. 1982;88:595–598. [Google Scholar]
- 39.Blair RA, Goddard WA. Phys Rev B. 1980;22:2767–2776. [Google Scholar]
- 40.Brouder C. J Phys: Condens Matter. 1990;2:701. [Google Scholar]
- 41.Ballhausen CJ. McGraw-Hill. New York: 1962. [Google Scholar]
- 42.DeBeer George S, Brant P, Solomon EI. J Am Chem Soc. 2005;127:667–674. doi: 10.1021/ja044827v. [DOI] [PubMed] [Google Scholar]
- 43.Shadle SE, Penner-Hahn JE, Schugar HJ, Hedman B, Hodgson KO, Solomon EI. J Am Chem Soc. 1993;115:767–776. [Google Scholar]
- 44.DeBeer S, Randall DW, Nersissian AM, Valentine JS, Hedman B, Hodgson KO, Solomon EI. J Phys Chem B. 2000;104:10814–10819. [Google Scholar]
- 45.DeBeer George S, Basumallick L, Szilagyi RK, Randall DW, Hill MG, Nersissian AM, Valentine JS, Hedman B, Hodgson KO, Solomon EI. J Am Chem Soc. 2003;125:11314–11328. doi: 10.1021/ja035802j. [DOI] [PubMed] [Google Scholar]
- 46.DuBois JL, Mukherjee P, Stack TDP, Hedman B, Solomon EI, Hodgson KO. J Am Chem Soc. 2000;122:5775–5787. [Google Scholar]
- 47.Tanabe Y, Sugano S. J Phys Soc Jpn. 1954;9:753–766. [Google Scholar]
- 48.Westre TE, Kennepohl P, DeWitt JG, Hedman B, Hodgson KO, Solomon EI. J Am Chem Soc. 1997;119:6297–6314. [Google Scholar]
- 49.Hatfield WE, Fay RC, Pfluger CE, Piper TS. J Am Chem Soc. 1963;85:265–269. [Google Scholar]
- 50.Beattie JK, Moore CJ. Inorg Chem. 1982;21:1292–1295. [Google Scholar]
- 51.Hamilton W. Acta Crystallogr. 1962;15:353–360. [Google Scholar]
- 52.Brown SJ, Olmstead MM, Mascharak PK. Inorg Chem. 1990;29:3229–3234. [Google Scholar]
- 53.Kistenmacher TJ, Stucky GD. Inorg Chem. 1968;7:2150–2155. [Google Scholar]
- 54.Gewirth AA, Cohen SL, Schugar HJ, Solomon EI. Inorg Chem. 1987;26:1133–1146. [Google Scholar]
- 55.Coster D, Kronig RDL. Physica. 1935;2:13–24. [Google Scholar]
- 56.George SJ, Lowery MD, Solomon EI, Cramer SP. J Am Chem Soc. 1993;115:2968–2969. [Google Scholar]
- 57.DeBeer George S, Metz M, Szilagyi RK, Wang H, Cramer SP, Lu Y, Tolman WB, Hedman B, Hodgson KO, Solomon EI. J Am Chem Soc. 2001;123:5757–5767. doi: 10.1021/ja004109i. [DOI] [PubMed] [Google Scholar]
- 58.Hedman B, Hodgson KO, Solomon EI. J Am Chem Soc. 1990;112:1643–1645. [Google Scholar]
- 59.Groot Fd. Coord Chem Rev. 2005;249:31–63. [Google Scholar]
- 60.Wasinger EC, de Groot FMF, Hedman B, Hodgson KO, Solomon EI. J Am Chem Soc. 2003;125:12894–12906. doi: 10.1021/ja034634s. [DOI] [PubMed] [Google Scholar]
- 61.de Groot FM, Fuggle JC, Thole BT, Sawatzky GA. Phys Rev B Condens Matter. 1990;41:928–937. doi: 10.1103/physrevb.41.928. [DOI] [PubMed] [Google Scholar]
- 62.Cowan T. The Theory of Atomic Structure and Spectra. University of California Press; Berkeley, CA: 1981. [Google Scholar]
- 63.Stavitski E, de Groot FMF. Micron. 2010;41:687–694. doi: 10.1016/j.micron.2010.06.005. [DOI] [PubMed] [Google Scholar]
- 64.Delgado-Jaime MU, Zhang K, Vura-Weis J, de Groot FMF. J Synchrotron Radiat. 2016;23:1264–1271. doi: 10.1107/S1600577516012443. [DOI] [PMC free article] [PubMed] [Google Scholar]
- 65.Hocking RK, DeBeer George S, Raymond KN, Hodgson KO, Hedman B, Solomon EI. J Am Chem Soc. 2010;132:4006–4015. doi: 10.1021/ja9090098. [DOI] [PMC free article] [PubMed] [Google Scholar]
- 66.Arrio MA, Sainctavit P, Cartier dit Moulin C, Mallah T, Verdaguer M, Pellegrin E, Chen CT. J Am Chem Soc. 1996;118:6422–6427. [Google Scholar]
- 67.Arrio MA, Scuiller A, Sainctavit P, Cartier dit Moulin C, Mallah T, Verdaguer M. J Am Chem Soc. 1999;121:6414–6420. [Google Scholar]
- 68.Cartier dit Moulin C, Villain F, Bleuzen A, Arrio M-A, Sainctavit P, Lomenech C, Escax V, Baudelet F, Dartyge E, Gallet J-J, Verdaguer M. J Am Chem Soc. 2000;122:6653–6658. [Google Scholar]
- 69.Hocking RK, Wasinger EC, de Groot FMF, Hodgson KO, Hedman B, Solomon EI. J Am Chem Soc. 2006;128:10442–10451. doi: 10.1021/ja061802i. [DOI] [PubMed] [Google Scholar]
- 70.Hocking RK, George SD, Gross Z, Walker FA, Hodgson KO, Hedman B, Solomon EI. Inorg Chem. 2009;48:1678–1688. doi: 10.1021/ic802248t. [DOI] [PMC free article] [PubMed] [Google Scholar]
- 71.Hocking RK, Wasinger EC, Yan YL, deGroot FMF, Walker FA, Hodgson KO, Hedman B, Solomon EI. J Am Chem Soc. 2007;129:113–125. doi: 10.1021/ja065627h. [DOI] [PMC free article] [PubMed] [Google Scholar]
- 72.Pauling L, Coryell CD. Proc Natl Acad Sci. 1936;22:210–216. doi: 10.1073/pnas.22.4.210. [DOI] [PMC free article] [PubMed] [Google Scholar]
- 73.Weiss JJ. Nature. 1964;202:83–84. doi: 10.1038/202083b0. [DOI] [PubMed] [Google Scholar]
- 74.McClure DS. Radiat Res Suppl. 1960;2:218–242. [Google Scholar]
- 75.Harcourt RD. Int J Quantum Chem. 1971;5:479–495. [Google Scholar]
- 76.Goddard WA, Olafson BD. Proc Natl Acad Sci. 1975;72:2335–2339. doi: 10.1073/pnas.72.6.2335. [DOI] [PMC free article] [PubMed] [Google Scholar]
- 77.Wilson SA, Kroll T, Decreau RA, Hocking RK, Lundberg M, Hedman B, Hodgson KO, Solomon EI. J Am Chem Soc. 2013;135:1124–1136. doi: 10.1021/ja3103583. [DOI] [PMC free article] [PubMed] [Google Scholar]
- 78.Chen H, Ikeda-Saito M, Shaik S. J Am Chem Soc. 2008;130:14778–14790. doi: 10.1021/ja805434m. [DOI] [PubMed] [Google Scholar]
- 79.Wang H, Peng G, Miller LM, Scheuring EM, George SJ, Chance MR, Cramer SP. J Am Chem Soc. 1997;119:4921–4928. [Google Scholar]
- 80.Gel’mukhanov F, Ågren H. Phys Rep. 1999;312:87–330. [Google Scholar]
- 81.Kotani A, Shin S. Rev Mod Phys. 2001;73:203–246. [Google Scholar]
- 82.Carra P, Fabrizio M, Thole BT. Phys Rev Lett. 1995;74:3700–3703. doi: 10.1103/PhysRevLett.74.3700. [DOI] [PubMed] [Google Scholar]
- 83.Glatzel P, Bergmann U, Gu W, Wang H, Stepanov S, Mandimutsira BS, Riordan CG, Horwitz CP, Collins T, Cramer SP. J Am Chem Soc. 2002;124:9668–9669. doi: 10.1021/ja026028n. [DOI] [PubMed] [Google Scholar]
- 84.Rueff JP, Journel L, Petit PE, Farges F. Phys Rev B. 2004;69:235107. [Google Scholar]
- 85.Benkert A, Meyer F, Hauschild D, Blum M, Yang W, Wilks RG, Bär M, Reinert F, Heske C, Weinhardt L. J Phys Chem A. 2016;120:2260–2267. doi: 10.1021/acs.jpca.6b02636. [DOI] [PubMed] [Google Scholar]
- 86.Liu YS, Glans PA, Chuang CH, Kapilashrami M, Guo J, Electron J. Spectrosc Relat Phenom. 2015;200:282–292. [Google Scholar]
- 87.Kunnus K, Zhang W, Delcey MG, Pinjari RV, Miedema PS, Schreck S, Quevedo W, Schröder H, Föhlisch A, Gaffney KJ, Lundberg M, Odelius M, Wernet P. J Phys Chem B. 2016;120:7182–7194. doi: 10.1021/acs.jpcb.6b04751. [DOI] [PubMed] [Google Scholar]
- 88.Matsubara M, Uozumi T, Kotani A, Harada Y, Shin S. J Phys Soc Jpn. 2002;71:347–356. [Google Scholar]
- 89.Ghiringhelli G, Matsubara M, Dallera C, Fracassi F, Tagliaferri A, Brookes NB, Kotani A, Braicovich L. Phys Rev B. 2006;73:035111. [Google Scholar]
- 90.Kunnus K, Josefsson I, Schreck S, Quevedo W, Miedema PS, Techert S, de Groot FMF, Odelius M, Wernet P, Föhlisch A. J Phys Chem B. 2013;117:16512–16521. doi: 10.1021/jp4100813. [DOI] [PubMed] [Google Scholar]
- 91.Glatzel P, Singh J, Kvashnina KO, van Bokhoven JA. J Am Chem Soc. 2010;132:2555–2557. doi: 10.1021/ja907760p. [DOI] [PubMed] [Google Scholar]
- 92.Kvashnina KO, Butorin SM, Glatzel P. J Anal At Spectrom. 2011;26:1265–1272. [Google Scholar]
- 93.Lundberg M, Kroll T, DeBeer S, Bergmann U, Wilson SA, Glatzel P, Nordlund D, Hedman B, Hodgson KO, Solomon EI. J Am Chem Soc. 2013;135:17121–17134. doi: 10.1021/ja408072q. [DOI] [PMC free article] [PubMed] [Google Scholar]
- 94.Kroll T, Lundberg M, Solomon EI. X-Ray Absorption and X-Ray Emission Spectroscopy. John Wiley & Sons, Ltd; 2016. X-Ray Absorption and RIXS on Coordination Complexes, in; pp. 407–435. [Google Scholar]
- 95.Kroll T, Hadt RG, Wilson SA, Lundberg M, Yan JJ, Weng TC, Sokaras D, Alonso-Mori R, Casa D, Upton MH, Hedman B, Hodgson KO, Solomon EI. J Am Chem Soc. 2014;136:18087–18099. doi: 10.1021/ja5100367. [DOI] [PMC free article] [PubMed] [Google Scholar]
- 96.Ow YLP, Green DR, Zhenyue H, Mak TW. Nat Rev Mol Cell Bio. 2008;9:532–542. doi: 10.1038/nrm2434. [DOI] [PubMed] [Google Scholar]
- 97.Golnak R, Xiao J, Atak K, Unger I, Seidel R, Winter B, Aziz EF. J Phys Chem A. 2016;120:2808–2814. doi: 10.1021/acs.jpca.6b01699. [DOI] [PubMed] [Google Scholar]
- 98.Mitzner R, Rehanek J, Kern J, Gul S, Hattne J, Taguchi T, Alonso-Mori R, Tran R, Weniger C, Schröder H, Quevedo W, Laksmono H, Sierra RG, Han G, Lassalle-Kaiser B, Koroidov S, Kubicek K, Schreck S, Kunnus K, Brzhezinskaya M, Firsov A, Minitti MP, Turner JJ, Moeller S, Sauter NK, Bogan MJ, Nordlund D, Schlotter WF, Messinger J, Borovik A, Techert S, de Groot FMF, Föhlisch A, Erko A, Bergmann U, Yachandra VK, Wernet P, Yano J. J Phys Chem Lett. 2013;4:3641–3647. doi: 10.1021/jz401837f. [DOI] [PMC free article] [PubMed] [Google Scholar]
- 99.Roemelt M, Maganas D, DeBeer S, Neese F. J Chem Phys. 2013;138:204101. doi: 10.1063/1.4804607. [DOI] [PubMed] [Google Scholar]
- 100.Josefsson I, Kunnus K, Schreck S, Föhlisch A, de Groot F, Wernet P, Odelius M. J Phys Chem Lett. 2012;3:3565–3570. doi: 10.1021/jz301479j. [DOI] [PubMed] [Google Scholar]
- 101.Pinjari RV, Delcey MG, Guo M, Odelius M, Lundberg M. J Chem Phys. 2014;141:124116. doi: 10.1063/1.4896373. [DOI] [PubMed] [Google Scholar]
- 102.Shen G, Wang Y. Rev Mineral Geochem. 2014;78:745–777. [Google Scholar]


