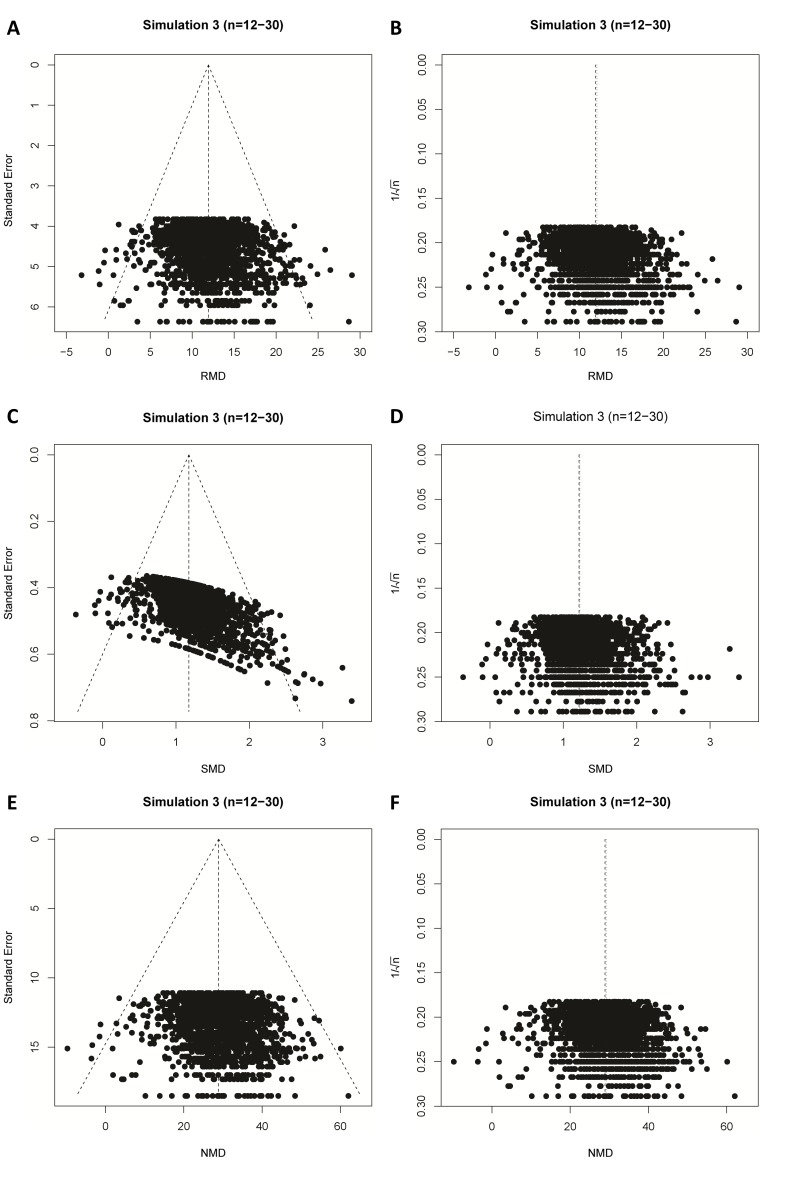
Figure 6. Simulation 3 funnel plots of biased meta-analyses.
Representative funnel plots of simulated biased meta-analyses using a raw mean difference (RMD; A–B), a standardized mean difference (SMD; C–D), or a normalised mean difference (NMD; E–F) effect measure. The present example contains 3000 studies with a small study sample size (n = 12–30) and an intervention effect present (difference in normal distribution means between control and intervention group = 10). Publication bias was introduced stepwise, by removing 10% of primary studies in which the difference between the intervention and control group means was significant at p<0.05, 50% of studies where the significance level was p≥0.05 to p<0.10, and 90% of studies where the significance level was p≥0.10. Precision estimates are standard error (A, C, E) or sample size-based (B, D, F), where n = total primary study sample size.

