Abstract
MTG16 is a member of the myeloid translocation gene (MTG) family of transcriptional corepressors. While MTGs were originally identified in chromosomal translocations in acute myeloid leukemia, recent studies have uncovered a role in intestinal biology. For example, Mtg16–/– mice have increased intestinal proliferation and are more sensitive to intestinal injury in colitis models. MTG16 is also underexpressed in patients with moderate/severe ulcerative colitis. Based on these findings, we postulated that MTG16 might protect against colitis-associated carcinogenesis. MTG16 was downregulated at the protein and RNA levels in patients with inflammatory bowel disease and in those with colitis-associated carcinoma. Mtg16–/– mice subjected to inflammatory carcinogenesis modeling exhibited worse colitis and increased tumor multiplicity and size. Loss of MTG16 also increased severity of dysplasia, apoptosis, proliferation, DNA damage, and WNT signaling. Moreover, transplantation of WT marrow into Mtg16–/– mice failed to rescue the Mtg16–/– protumorigenic phenotypes, indicating an epithelium-specific role for MTG16. While MTG dysfunction is widely appreciated in hematopoietic malignancies, the role of this gene family in epithelial homeostasis, and in colon cancer, was unrealized. This report identifies MTG16 as an important modulator of colitis and tumor development in inflammatory carcinogenesis.
Keywords: Gastroenterology, Genetics, Inflammation, Oncology
Myeloid translocation gene 16 is a modulator of colitis and tumor development in colitis-associated carcinoma.
Introduction
Inflammation is a well-known risk factor for malignancy and patients with inflammatory bowel diseases (IBDs), such as ulcerative colitis (UC) or Crohn’s colitis, are at an increased risk for developing colorectal cancer (CRC) (1–3). In IBD patients, factors that increase colon cancer risk include longer duration of colitis, greater anatomic extent of colitis, and the presence of other inflammatory manifestations such as primary sclerosing cholangitis (4, 5). In rodents, the administration of colitis-inducing agents accelerates development of colorectal tumors (6, 7). Despite advances in our understanding of the interplay between IBD and CRC, our knowledge of the molecular mechanisms underlying the development and progression of colitis-associated carcinoma (CAC) remains unclear (8).
Recent work has implicated the myeloid translocation genes (MTGs) in intestinal inflammation, stem cell function, and epithelial repair — all processes contributing to the development of CAC (9–13). The MTG family includes MTG16 (CBFA2T3), MTGR1 (CBFA2T2), and MTG8 (RUNX1T1) (14). The founding family member, MTG8, was first identified as a chromosomal translocation in acute myeloid leukemia (AML) (14). MTGs form repression complexes that alter chromatin structure and repress transcription. Knockout mice have revealed key functions of MTGs in intestinal biology, with a midgut deletion phenotype observed in 25% of Mtg8–/– mice (9) and Mtgr1–/– mice exhibiting a progressive depletion of the secretory intestinal lineages (15). Furthermore, both Mtgr1–/– and Mtg16–/– mice have increased enterocyte proliferation with an expansion of transit-amplifying cell populations and skewed lineage allocation, indicative of disrupted intestinal homeostasis (12, 15, 16). When colitis was induced with dextran sodium sulfate (DSS), both Mtgr1–/– and Mtg16–/– mice were more sensitive to injury in comparison with wild-type (WT) mice, demonstrating that MTGs are required for maintaining intestinal integrity when the epithelium is challenged (10, 13). Relevance to human disease is suspected, as UC patients have reductions in MTG16 expression (10). In addition to their roles in healing and repair, multiple nonsynonymous MTG16 mutations have been identified in epithelial malignancies, including CRC (17). While these collective findings implicate MTGs as modulators of systems often targeted during oncogenesis, such as stemness, differentiation, and epithelial regeneration programs, the precise role of each MTG family member in regulating intestinal carcinogenesis remains unclear.
Because Mtg16–/– mice demonstrated abnormal intestinal wound healing, we hypothesized that the loss of MTG16 would also impact intestinal carcinogenesis. In support of this, we observed that MTG16 protein and RNA levels were reduced in patients with IBD and CAC and Mtg16–/– mice had more severe colitis, decreased survival, and increased tumor burden, dysplasia, and protumorigenic M2 macrophages after inflammatory carcinogenesis modeling. Tumors from Mtg16–/– mice had an increased ratio of proliferation to apoptosis and augmented DNA damage, as well as more nuclear β-catenin suggestive of heightened WNT activation. Transplantation of WT bone marrow into Mtg16–/– mice was unable to reduce tumor burden, indicating that increased tumorigenesis was not due to hematopoietic MTG16 loss. Modulating MTG16 expression in colonic epithelial cells and CRC lines altered WNT signaling and proliferation, revealing a potentially novel epithelium-based MTG16 regulatory circuit. Collectively, our data implicate MTG16 as a tumor suppressor in inflammatory carcinogenesis.
Results
Mtg16 is decreased in inflammatory carcinogenesis.
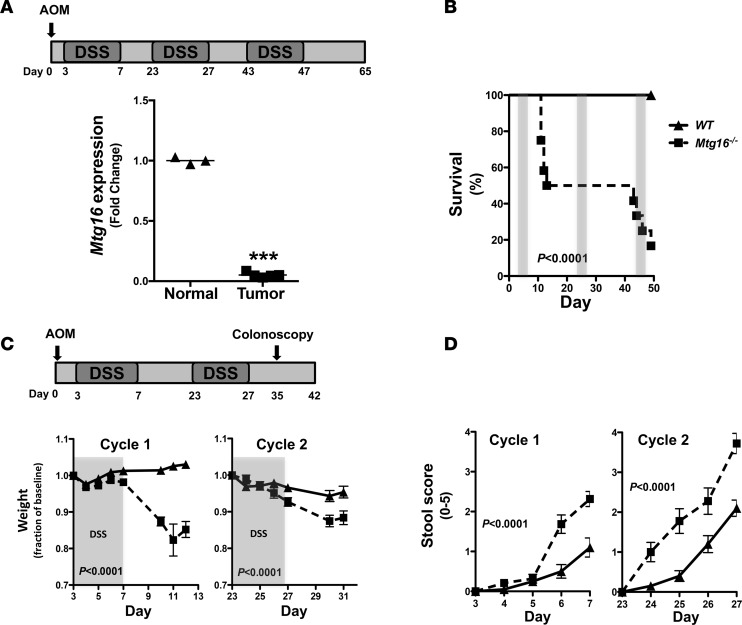
Expression of genes critical to stem cell function is often perturbed in the process of carcinogenesis (i.e., APC, p53, KRAS) (18, 19). As MTG16 contributes to hematopoietic stem cell function (20) and is critical to intestinal injury responses (10), we reasoned that MTG16 contributes to inflammatory carcinogenesis. To determine if its expression levels were altered in tumors generated via inflammatory carcinogenesis modeling, we treated WT mice using the scheme outlined in Figure 1A using standard azoxymethane (AOM)/DSS dosing (12.5 mg/kg AOM i.p. and 2% DSS ad lib) (21, 22). In line with our hypothesis, there was a 20-fold decrease in Mtg16 messenger RNA levels in the resulting tumors as compared with adjacent nonmalignant mucosa (P < 0.001, Figure 1A).
Figure 1. MTG16 is required for survival after colonic injury.
(A) Schematic of azoxymethane/dextran sodium sulfate (AOM/DSS) inflammatory carcinogenesis protocol (top) and Mtg16 mRNA expression in tumors and normal adjacent tissue of C57BL/6 mice treated with 12.5 mg/kg AOM followed by 3 cycles of 2% DSS (bottom) (normal = 3, tumor = 4, Student’s t test, ***P < 0.001). (B) Mortality curves in WT versus Mtg16–/– mice undergoing AOM/DSS treatment protocol (WT = 12, Mtg16–/– = 12, log-rank test). (C) Schematic of reduced dose and duration of AOM/DSS inflammatory carcinogenesis protocol (top) and fractional change in daily weight during the course of the protocol (bottom). DSS administration period is highlighted in gray (WT = 20, Mtg16–/– = 19, Student’s t test). (D) Stool score during each cycle of DSS (WT = 20, Mtg16–/– = 19, Student’s t test). ▲ = WT mice, ■ = Mtg16–/– mice.
AOM/DSS induces more severe colitis in Mtg16–/– mice.
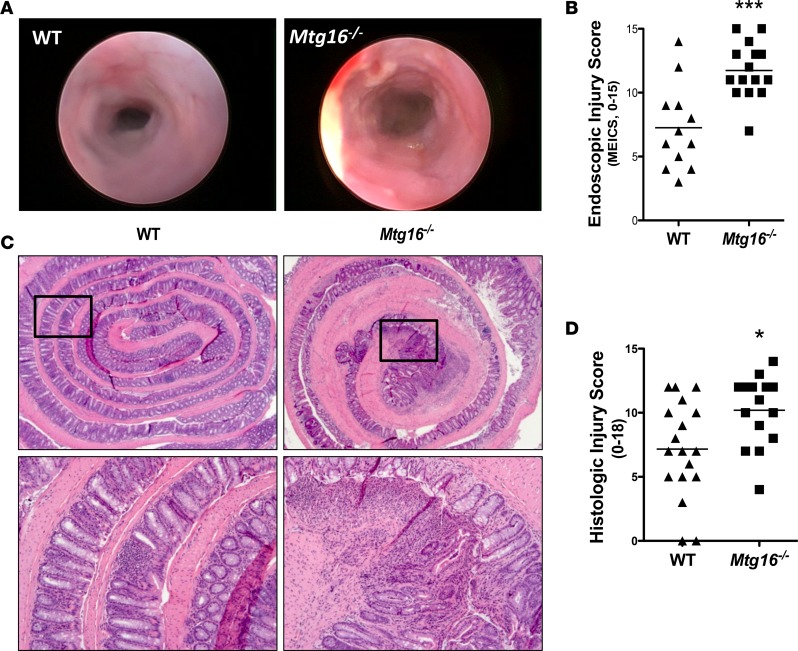
We hypothesized that MTG16 is functionally relevant in the pathogenesis of CAC. To test this, we subjected 8- to 12-week-old WT or Mtg16–/– mice to the AOM/DSS protocol outlined in Figure 1A. Mtg16–/– mice were extremely sensitive to AOM/DSS treatment, demonstrating 83% mortality (P < 0.0001, Figure 1B) by the third DSS cycle. Because of the high mortality, we reduced the AOM dose to 10 mg/kg and performed only 2 cycles of DSS (Figure 1C). Despite improvement in Mtg16–/– survival, mortality was still greater compared with WT mice (18% vs. 3%, P < 0.0001, data not shown). Additionally, Mtg16–/– mice lost significantly more weight and exhibited delayed recovery in comparison with WT mice (P < 0.0001, Figure 1C). Both groups of mice developed loose stools but blood and frank diarrhea were more frequently present in the Mtg16–/– mice, resulting in a higher stool score (P < 0.0001, Figure 1D). In order to visually assess colonic injury, 10 days after the second cycle of DSS a random subset of mice underwent endoscopic evaluation. The murine endoscopic index of colitis severity (MEICS) (23) score was higher in Mtg16–/– mice (11.7 ± 0.6 vs. 7.3 ± 1.0, P < 0.001, Figure 2, A and B). Following the completion of the AOM/DSS protocol, histopathological analysis of Swiss-rolled colons by a blinded, experienced mouse gastrointestinal pathologist (MKW) confirmed endoscopic observations, indicating increased overall inflammation, depth of inflammation, crypt damage, and percentage of crypts involved. These data together are represented in the mean combined inflammation score, which was significantly higher in the Mtg16–/– colons compared with the WT colons (10.2 ± 0.7 vs. 7.2 ± 0.9, P < 0.05, Figure 2, C and D). Taken together, these data show that MTG16 plays a significant role in colonic integrity after AOM/DSS–induced injury.
Figure 2. Mtg16–/– mice have increased AOM/DSS–induced colonic injury.
(A) Representative endoscopic images from WT and Mtg16–/– mice treated with azoxymethane/dextran sodium sulfate (AOM/DSS) after the second cycle of DSS. (B) Murine endoscopic index of colitis severity (MEICS) scores (WT = 12, Mtg16–/– = 15). (C) Representative histologic images from WT and Mtg16–/– mice (top, ×2.5 magnification; bottom, ×10 magnification). (D) Histologic injury score (WT = 18, Mtg16–/– = 15). Student’s t test *P < 0.05, ***P < 0.001.
MTG16 is a tumor suppressor in inflammatory carcinogenesis.
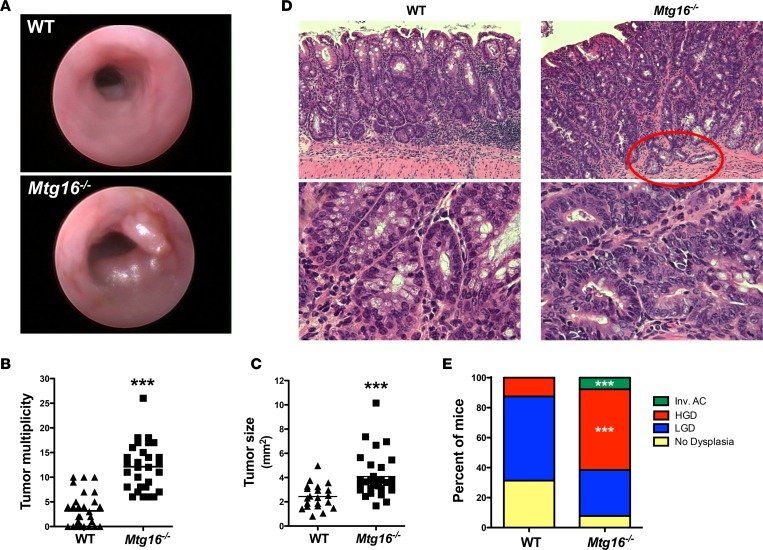
In addition to exhibiting more severe histologic injury, Mtg16–/– mice also had greater tumor multiplicity and size upon endoscopic examination (Figure 3A). The endoscopic findings were confirmed upon gross examination, as Mtg16–/– mice had greater tumor multiplicity compared with WT mice (12.1 ± 0.9 vs. 3.2 ± 0.6 tumors per mouse, P < 0.001, Figure 3B). Mtg16–/– tumors were also larger, as measured by cross-sectional area (4.1 ± 0.3 mm2 vs. 2.4 ± 0.2 mm2, P < 0.001, Figure 3C) and more frequently displayed high-grade dysplasia (P = 0.003, χ2 test for a trend, Figure 3, D and E). Interestingly, one Mtg16–/– tumor was classified as an invasive adenocarcinoma, a feature rarely observed with this low dose of AOM and over such a short time frame. Despite prolonged aging, WT and Mtg16–/– mice treated with DSS alone or a single AOM injection did not develop tumors. Thus, loss of MTG16 promotes tumor formation in an inflammatory carcinogenesis challenge.
Figure 3. MTG16 protects from inflammatory carcinogenesis.
(A) Representative endoscopic images of tumors in WT and Mtg16–/–azoxymethane/dextran sodium sulfate–treated mice (day 35). (B) Tumor multiplicity and (C) tumor size (WT = 30, Mtg16–/– = 29, length × width averaged/mouse, Student’s t test, ***P < 0.001). (D) Representative H&E of WT and Mtg16–/– mice. Red circle highlights an invasive adenocarcinoma (top, ×10 magnification; bottom, ×40 magnification). (E) Percentage of mice displaying highest extent of dysplasia (WT = 30, Mtg16–/– = 29). Fisher’s exact test, ***P < 0.001. LGD, low-grade dysplasia; HGD, high-grade dysplasia; Inv. AC, invasive adenocarcinoma.
Altered cellular homeostasis in Mtg16–/– tumors.
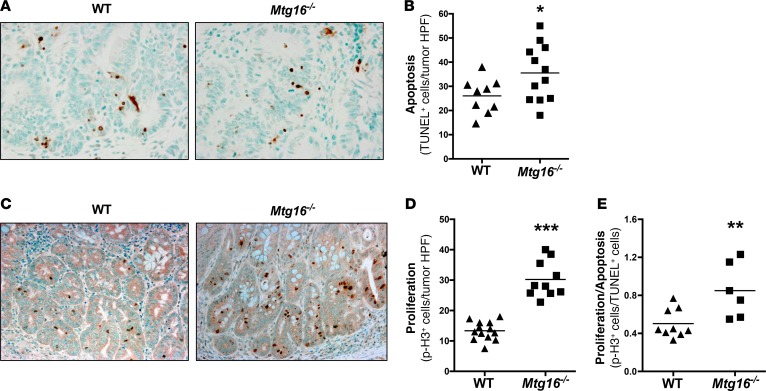
To further characterize MTG16-deficient tumors, we used TUNEL to quantify intratumoral apoptosis. As Mtg16–/– mice consistently had larger tumors, we were surprised to see increased numbers of TUNEL+ cells (35.5 ± 3.5 vs. 26.1 ± 2.4 TUNEL+ cells per HPF, P = 0.04, Figure 4, A and B). However, proliferation was also increased in Mtg16–/– tumors as measured by phospho-histone H3 immunohistochemistry (p-H3, 30.2 ± 1.9 and 13.4 ± 0.8 p-H3+ cells per high-power field [HPF], P < 0.001, Figure 4, C and D). Similarly, apoptosis and proliferation in Mtg16–/– crypts were also increased (0.5 ± 0.06 vs. 0.3 ± 0.02 TUNEL+ cells per crypt, P < 0.05, Supplemental Figure 1A; 1.3 ± 0.08 and 0.5 ± 0.02 p-H3+ cells per crypt, P < 0.001, Supplemental Figure 1B; supplemental material available online with this article; https://doi.org/10.1172/jci.insight.78210DS1). However, in Mtg16–/– tumors, the proliferative/apoptotic ratio was higher (0.9 ± 0.1 vs. 0.5 ± 0.05, P < 0.01, Figure 4E), suggesting that the balance between apoptosis and proliferation is skewed towards tumor growth.
Figure 4. Cellular growth kinetics are altered in Mtg16–/– tumors.
(A) Representative images from TUNEL-labeled tumors (×40 magnification) and (B) quantification of intratumoral apoptosis (WT = 9, Mtg16–/– = 12). (C) Representative images (×20 magnification) and (D) quantification of phospho-histone H3 (p-H3) labeling within tumor tissue (WT = 13, Mtg16–/– = 10). (E) Ratio of p-H3/TUNEL in WT versus Mtg16–/– tumors (WT = 9, Mtg16–/– = 6). Student’s t test, *P < 0.05, **P < 0.01, ***P < 0.001.
MTG16 regulates epithelial proliferation.
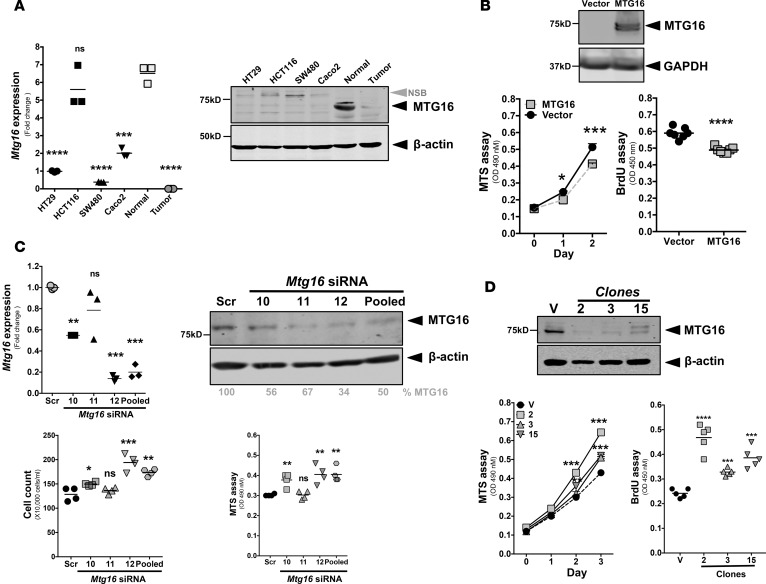
To determine if the effect of MTG16 on epithelial proliferation was cell intrinsic, we turned to in vitro approaches. As higher proliferation was observed in Mtg16–/– tumors, we tested whether MTG16 could modify the growth of established CRC cells. We noted decreases in both MTG16 messenger RNA and protein in HT29, HCT116, SW480, and Caco2 CRC lines, similar to those observed in primary CRC and far lower than in the normal colon (Figure 5A). Interestingly, in the HCT116 line, Mtg16 message levels were similar to those observed in normal colon; however, protein expression was absent, suggesting posttranscriptional mechanisms regulating MTG16 expression in this line. Ectopically expressing MTG16 in HCT116 cells attenuated proliferation as determined by both MTS and BrdU incorporation assays (Figure 5B and Supplemental Figure 7). To test the impact of MTG16 loss in normal epithelial cells, we reduced MTG16 levels in the young adult mouse colon (YAMC; see ref. 24) cell line via RNA interference and then reproduced by deletion via CRISPR/Cas9–mediated genome editing. Interfering with MTG16 expression using individual siRNAs as well as pooled siRNAs markedly reduced MTG16 protein levels and augmented cell growth (Figure 5C). We observed variation in MTG16 knockdown efficiency when using different siRNAs. siRNA 11 was minimally effective and had no effect on cell growth. On the other hand, siRNA 12 and pooled siRNAs were most efficient in reducing MTG16 levels and significantly increased cellular growth as demonstrated by cell counts and the MTS assay. In confirmatory studies, CRISPR/Cas9–mediated genome editing with 2 gRNAs targeting exon 4 of MTG16 yielded multiple clones with markedly reduced MTG16 levels (Figure 5D) and consequently increased proliferation (Figure 5D). Surprisingly, although gene editing was confirmed by sequence analysis, we observed residual immunoreactivity in CRISPR-edited clones, which are likely due to MTG family member cross-reactivity. These results collectively indicate an epithelial cell–autonomous role for MTG16 in regulating cellular growth dynamics of nontransformed colonic and CRC lines.
Figure 5. MTG16 attenuates epithelial proliferation.
(A) Mtg16 mRNA expression (adjusted to Gapdh) and protein levels in different colorectal cancer (CRC) lines with matched human CRC and adjacent normal sample (compared with normal, triplicate samples). NSB, nonspecific band. (B) Immunoblot analysis of MTG16 expression in HCT116 cells, cell growth by MTS assay (triplicate samples) and proliferation as determined by BrdU incorporation 48 hours after plating (vector = 7, MTG16 = 7). (C) Mtg16 mRNA expression (adjusted to GAPDH, triplicate samples), protein levels, change in cell growth by MTS assay (triplicate samples) and cell count (quadruplicate samples) method after 96 hours of siRNA treatment in young adult mouse colon (YAMC) cells using 3 individual siRNAs and 1 pooled siRNA. (D) MTG16 protein levels in different clones (2, 3, and 15) of YAMC cells after CRISPR-mediated knockout of Mtg16, cell growth by MTS assay (triplicate samples) and cellular proliferation by BrdU incorporation (5 samples/each). Each experiment repeated at least 2 times. One-way ANOVA and Newman-Keuls post-test, *P < 0.05, **P < 0.01, ***P < 0.001, ****P < 0.0001. Scr, scrambled; V, vector; ns, not significant.
Genes commonly mutated in cancer are preferentially dysregulated in Mtg16–/– tumors.
Given that MTG16 is a transcriptional regulator, we predicted that loss of MTG16 would result in global transcriptome changes that subsequently modify tumorigenic phenotypes. Therefore, we performed RNA sequencing (RNA-seq) on Mtg16–/– and WT tumors. Some of the most downregulated genes in Mtg16–/– tumors included genes commonly altered in cancer such as the homeobox (Hox) genes HoxD10, HoxD11, Sparc/osteonectin (Spock3), and kallikrein-related peptidase-15 (Klk15) (Supplemental Figure 2A), while significantly upregulated genes included matrix metallopeptidase 12 (Mmp12), aquaporin 5 (Aqp5), urokinase receptor (Plaur), and haptoglobin (Hp). Five of these genes were selected for validation by quantitative real-time PCR (qRT-PCR) and demonstrated similar expression patterns (Supplemental Figure 2B). Ingenuity pathway analysis (IPA) identified the NF-κB axis as a central node. IPA also revealed that TNF, IL-1β, and β-catenin, a key mediator of Wnt signaling, were top upstream regulators (Supplemental Figure 3, A and B). Overall, these data indicate that critical pathways commonly dysregulated in cancer are altered in Mtg16–/– tumors.
Wnt signaling is attenuated by MTG16.
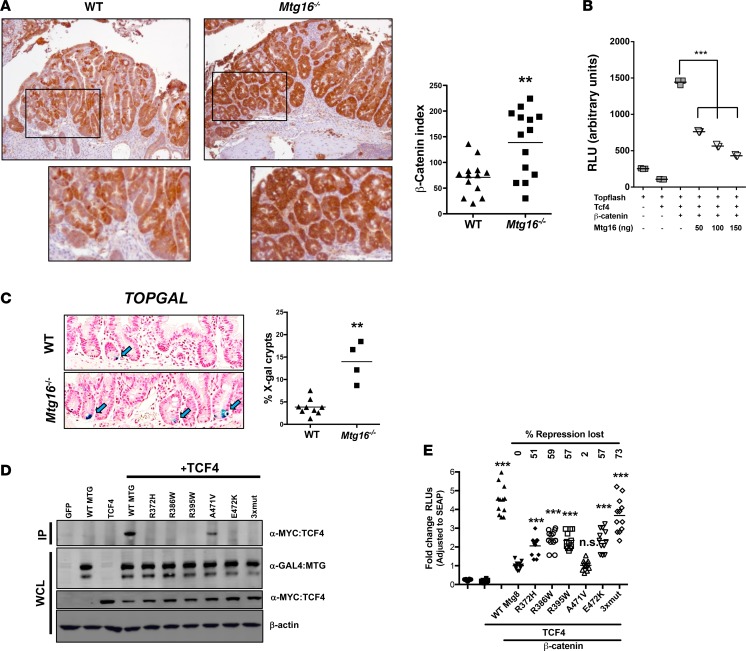
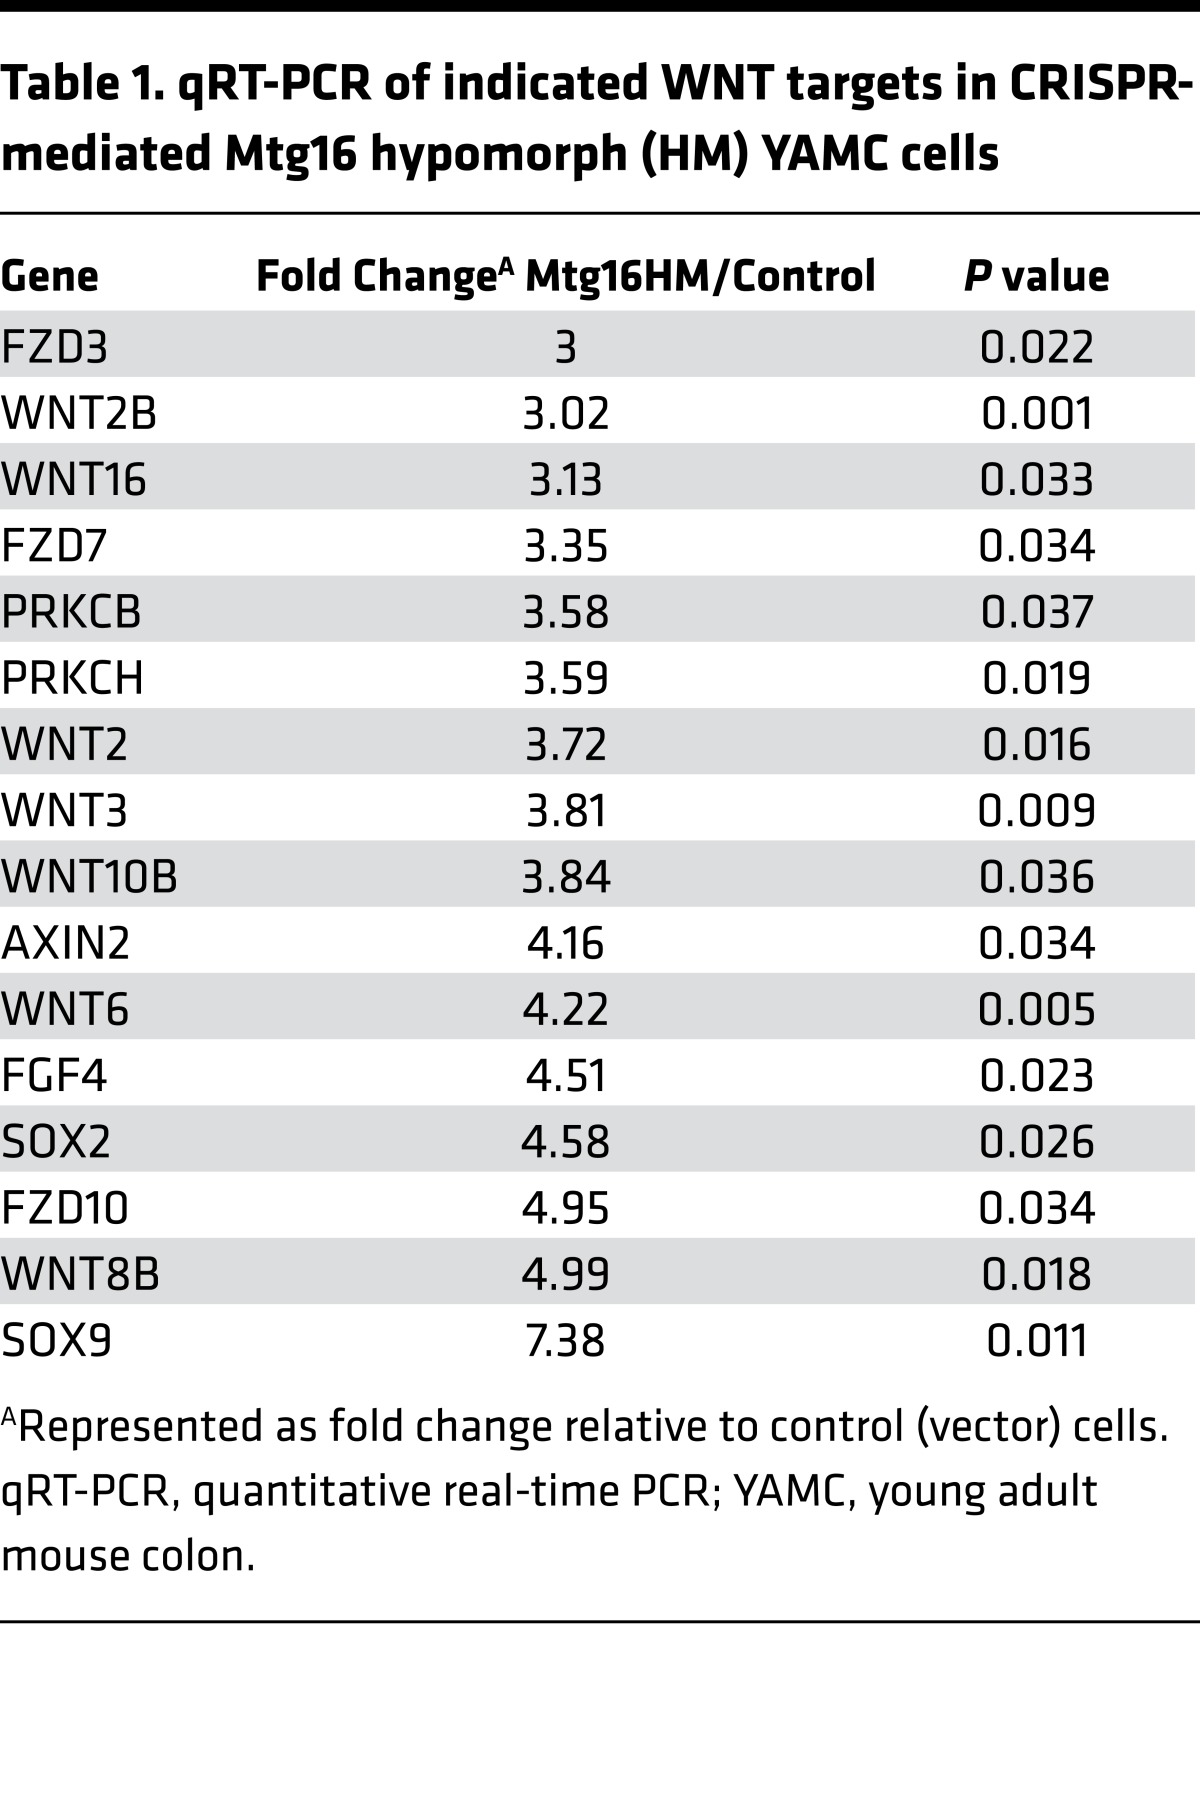
β-Catenin is a principal effector of the WNT signaling pathway and a known driver of CRC pathogenesis. Given that β-catenin was a dysregulated node in Mtg16–/– tumors, we determined β-catenin expression and localization in WT and Mtg16–/– tumors by IHC. We observed uniform intense staining in Mtg16–/– tumors, whereas WT tumors often exhibited regional and subregional variation in β-catenin staining intensity and nuclear localization (Figure 6A). Quantification using a previously reported β-catenin staining index demonstrated higher scores in Mtg16–/– tumors compared with WT tumors (138.7 ± 17.2 vs. 71.1 ± 9.3, P < 0.01, Figure 6A). Titrating MTG16 into NIH 3T3 cells suppressed WNT activity in a dose-dependent fashion, as measured by suppression of TOPFLASH reporter activity (Figure 6B). To determine if WNT signaling is perturbed at baseline in the murine intestine, Mtg16–/– mice were interbred with the TOPGAL reporter mouse, allowing for quantification of WNT activity in the intestine. While positive crypt cells were rarely observed in WT TOPGAL reporter mice (consistent with prior reports by Davies et al.; see ref. 25), they were increased 3-fold in Mtg16–/– crypts (Figure 6C). Furthermore, loss of MTG16 increased expression of WNT-associated transcripts in intestinal epithelial cells (YAMC hypomorph cells vs. control, Table 1). Taken together, these data indicate that MTG16 regulates WNT signaling.
Figure 6. MTG16 represses Wnt signaling.
(A) β-Catenin expression by immunohistochemistry. Representative images from WT and Mtg16–/– tumors stained for β-catenin (left, images ×10 magnification) and quantification of β-catenin staining index (right, percentage of tumors with nuclear β-catenin multiplied by expression intensity (WT = 13, Mtg16–/– = 14), Student’s t test. (B) MTG16-repressed transcription of TOPFLASH reporter in NIH3T3 cells transfected with increasing amounts of Mtg16, as shown (triplicates and repeated twice). (C) Increased frequency of X-gal–positive crypts in Mtg16–/– mice (left, images ×20 magnification) and quantification of percentage of X-gal–positive crypts (right, WT = 12, Mtg16–/– = 4 mice), Student’s t test. (D) Coimmunoprecipitation of MTG colorectal cancer–associated (CRC-associated) mutants and TCF4 and (E) TOPFLASH assay with individual MTG8 mutants (n = 12/category). One-way ANOVA and Newman-Keuls post-test, **P < 0.01, ***P < 0.001. RLU, relative light units; IP, immunoprecipitation; WCL, whole-cell lysate.
Table 1. qRT-PCR of indicated WNT targets in CRISPR-mediated Mtg16 hypomorph (HM) YAMC cells.
Previous work by Sjoblom et al. identified several nonsynonymous mutations in MTG16 and MTG8 in CRC (17), and querying The Cancer Genome Atlas (TCGA) database (http://cancergenome.nih.gov) (26) identifies MTGs as mutational targets in CRC. Many of these mutations, such as R386W and R395W (MTG8-referenced numbering), occur in residues contained within the nervy homology region 2 (NHR2) domain and are highly conserved across family members and species. As our data would suggest that mutational targeting of MTGs should result in inactivation of repressor activity, we modeled a subset of these mutants and tested their impact on WNT signaling. All mutants tested, with the exception of the A471V mutant, impaired both TCF4 interaction (Figure 6D) and the ability to repress TCF4-mediated TOPFLASH activity (Figure 6E). Thus, MTGs have the ability to attenuate WNT signaling and this activity is targeted during tumorigenesis.
Altered intratumoral immune environment in Mtg16–/–tumors. MTG16 is required for hematopoietic progenitor cell fate decisions and early progenitor differentiation (27). Accordingly, Mtg16–/– bone marrow fails to rescue WT mice from lethal irradiation (20). Because MTG16 is critical in hematopoietic stem cell function and Mtg16–/– colons exhibited greater inflammation and overall injury compared with WT, we characterized the intratumoral inflammatory cell infiltrate by immunohistochemistry. Mtg16–/– tumors exhibited decreased B220+ B lymphocytes compared with WT tumors (6.7 ± 0.9 vs. 18.8 ± 1.2 B220+ cells per HPF, P < 0.001, Supplemental Figure 4, A and B), although there was no significant difference in intratumoral CD3+ T lymphocyte numbers (12.1 ± 1.4 vs. 12.7 ± 1.8 CD3+ cells per HPF, P = 0.79, Supplemental Figure 4C).
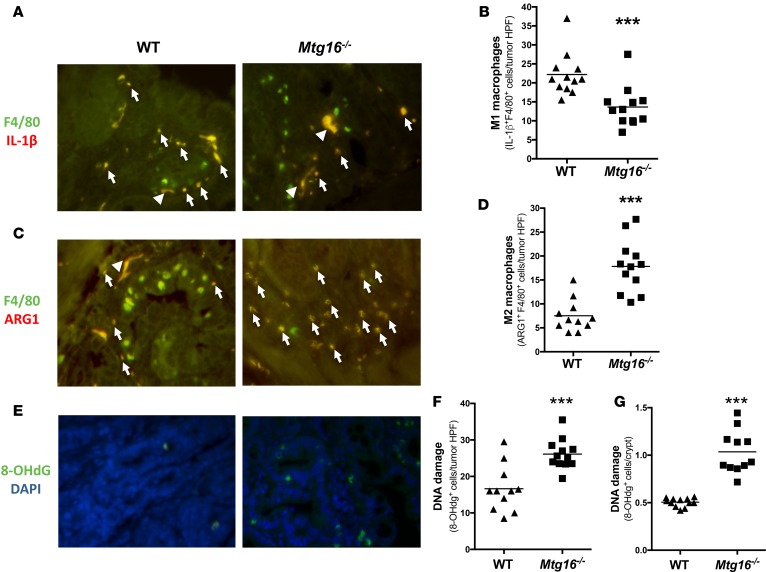
While M1 macrophages are antitumoral, M2 macrophages are generally considered protumorigenic because they increase angiogenesis, promote wound healing, and suppress immune responses (28). Accordingly, we observed decreased IL-1β+F4/80+ macrophages, indicative of a diminished M1 response (13.6 ± 1.5 vs. 22.2 ± 1.6 double positive/tumor HPF, P < 0.001, Figure 7, A and B) and increased ARG1+F4/80+ macrophages, a marker of M2 activation (17.8 ± 1.6 vs. 7.5 ± 1.0 double positive/tumor HPF, P < 0.001, Figure 7, C and D) in Mtg16–/– tumors. Macrophages can also promote tumorigenesis through production of inflammatory cytokines, which promote tissue destruction and DNA damage in an environment rich in reactive nitrogen and oxygen intermediates (29, 30). Indeed, oxidative DNA damage was increased in Mtg16–/– tumors as compared with WT tumors (26.1 ± 1.2 vs. 16.6 ± 1.9 8-hydroxy-2-deoxyguanosine+ [8-OHdG+] cells per HPF, P < 0.001, Figure 7, E and F). Additionally, DNA damage was increased in the crypts of the Mtg16–/– mice (1.0 ± 0.1 vs. 0.5 ± 0.01 8-OHdG+ cells per crypt, P < 0.001, Figure 7G). Collectively, these data suggest a protumor inflammatory microenvironment in Mtg16–/– tumors, with increased M2 macrophages, decreased M1 macrophages, and resultant increased DNA damage.
Figure 7. Mtg16–/– tumors display altered intratumoral immune environment and increased DNA damage.
Skewing towards M2 macrophage phenotypes inMtg16–/–tumors. (A) Representative images of IL-1β+/F4/80+ cells in WT and Mtg16–/– tumors; white arrow heads indicate nonspecific staining, white arrows indicate dual staining. (B) Quantification of M1 macrophages per tumor high-power field (HPF) (WT = 12, Mtg16–/– = 12). (C) Representative images of ARG1+/F4/80+ cells in WT and Mtg16–/– tumors and (D) quantification of M2 macrophages per tumor HPF (WT = 12, Mtg16–/– = 12). (E) DNA damage was assessed using 8-hydroxy-2-deoxyguanosine (8-OHdG) immunohistochemical staining. Representative images from tumors and (F) quantification of 8-OHdG+ cells in tumors (WT = 12, Mtg16–/– = 13) and (G) crypts (WT = 12, Mtg16–/– = 12, all representative images at ×40 magnification). Student’s t test, ***P < 0.001.
Loss of hematopoietic MTG16 does not promote tumorigenesis.
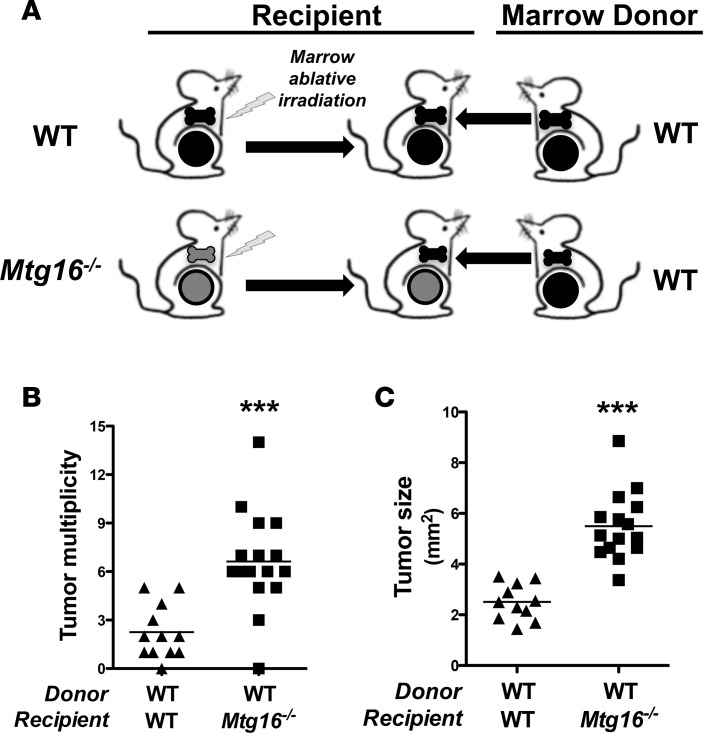
It is well established that MTG16 is a regulator of hematopoietic stem cell function (20, 27). To test whether the increased tumorigenesis observed in Mtg16–/– mice was due to an MTG16 hematopoietic cell–autonomous effect, we transferred WT bone marrow into irradiated Mtg16–/– and WT mice and subjected these mice to the AOM/DSS inflammatory carcinogenesis protocol (Figure 8A). Since Mtg16–/– marrow is incapable of rescuing WT mice from lethal irradiation, we could not use Mtg16–/– marrow as source transplant material (20). Nontransplanted irradiated controls did not survive 2 weeks after irradiation, indicating complete ablation of the endogenous marrow. The transfer of WT bone marrow into Mtg16–/– recipients failed to rescue the Mtg16–/– AOM/DSS phenotype (6.6 ± 0.8 vs. 2.3 ± 0.5 tumors per mouse for Mtg16–/– marrow vs. WT marrow, P < 0.001, Figure 8B). Additionally, Mtg16–/– tumors were larger than WT tumors (5.2 ± 0.5 mm2 vs. 2.3 ± 0.3 mm2, P < 0.001, Figure 8C). As these results were similar to those observed in our earlier nontransplanted Mtg16–/– mice (Figure 3, B and C), the absence of MTG16 in hematopoietic lineages is likely not responsible for the protumorigenic phenotype in Mtg16–/– mice.
Figure 8. Restoration of hematopoietic MTG16 fails to rescue Mtg16–/– AOM/DSS phenotype.
(A) Schematic of bone marrow transplant experiment. Fifteen WT and 17 Mtg16–/– mice were irradiated, transplanted with WT bone marrow, allowed to recover 12 weeks, and followed by azoxymethane/dextran sodium sulfate (AOM/DSS) inflammatory carcinogenesis protocol. (B) Mtg16–/– and WT mouse tumor multiplicity (WT = 12, Mtg16–/– = 16) and (C) size (WT = 11, Mtg16–/– = 15). Student’s t test, ***P < 0.001.
MTG16 is underexpressed in human CAC and sporadic colon cancer.
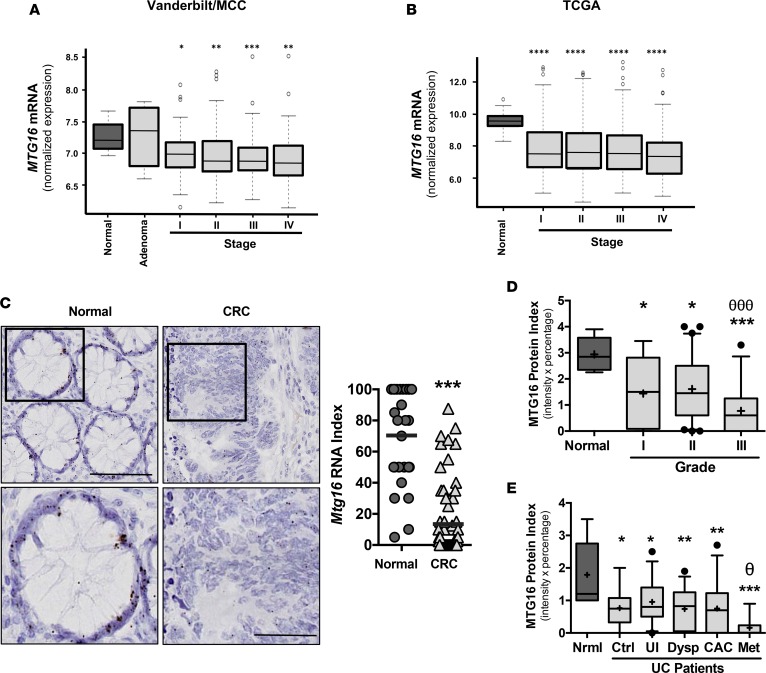
To determine if MTG16 was dysregulated in human cancers, we examined MTG16 mRNA levels in the Vanderbilt/Moffitt Cancer Center CRC expression array dataset. While MTG16 was not reduced in the adenoma stage, it was reduced in all carcinoma stages (Figure 9A). Similarly, analysis of TCGA also confirmed reduction of MTG16 in all stages of CRC (Figure 9B). Because tumors comprise a heterogeneous cellular environment, we probed a CRC tissue microarray using high-resolution in situ hybridization to determine if epithelial expression of MTG16 was reduced. While MTG16 is uniformly expressed in the epithelium of normal crypts (Supplemental Figure 5), its expression was reduced by varying degrees in the epithelial component of the tumor (Figure 9C). MTG16 protein level was also decreased in comparison with normal tissue (Figure 9D and Supplemental Figure 6). Thus, MTG16 is reduced at the adenoma to carcinoma stage, suggesting a possible role in cancer progression.
Figure 9. MTG16 expression is reduced in human colorectal cancer (CRC) and ulcerative colitis (UC) samples.
(A) Analysis of the combined Moffitt Cancer Center (MCC) and Vanderbilt Medical Center colon tumor expression array data set (10 normal samples, 6 adenomas, 33 stage I, 76 stage 2, 82 stage 3, and 59 stage 4, for a combined total of 250 CRC samples). (B) MTG16 mRNA levels in the indicated CRC stage from TCGA datasets (n = 41 normal samples, 75 stage I, 174 stage II, 126 stage III, 64 stage IV). (C) MTG16 mRNA in situ hybridization was performed on the Vanderbilt CRC tissue microarray (left) and quantified (right). (D) Box-and-whisker plot (line, median; +, mean; hinges, 25th and 75th percentile; whiskers, 10th to 90th percentile) demonstrating MTG16 staining extent (intensity and fraction of biopsy at that intensity) in cores from normal (n = 8), grade I (n = 27), grade II (n = 119), and grade III (n = 51) from human CRC. (E) Box-and-whisker plot (line, median; +, mean; hinges, 25th and 75th percentile; whiskers, 10th to 90th percentile) demonstrating MTG16 staining extent in cores from normal, non-UC patients (normal [Nrml], n = 9), control, noncancer UC patients (control [Ctrl], n = 10), uninvolved UC tissue adjacent to dysplasia (UI, n = 39), dysplastic (Dysp, n = 30), colitis-associated carcinoma (CAC, n = 28), and metastatic (Met, n = 8) tissue from patients with UC. One-way ANOVA and Newman-Keuls post-test were used to compare multiple groups such as those seen with MTG16 protein index in the human CAC array. For expression array and TCGA analysis, Wilcoxon rank-sum test with continuity correction was applied. *P < 0.05, **P < 0.01, ***P < 0.001, ****P < 0.0001 for all categories compared with normal tissue; θP < 0.05 between uninvolved UC and metastatic UC; θθθP < 0.001 between grade I and grade III.
We next asked whether MTG16 was differentially expressed in various UC disease states. Immunohistochemical staining an IBD tissue microarray for MTG16 demonstrated reduced MTG16 levels in CAC tissue and a further reduction in metastasis (0.01 ± 0.1, P < 0.05, Figure 9E and Supplemental Figure 6). Collectively, these data demonstrate that MTG16 is underexpressed in CRC, IBD, and CAC and may contribute to their pathogenesis.
Discussion
MTGs are transcriptional corepressors, first identified in chromosomal translocations [(8:21) and (16:21)] occurring in AML. These translocations generate fusion proteins, which redirect MTG repression complexes to targets essential for myeloid differentiation (31). To date, we have learned a great deal about the biological functions of MTG16 through the analysis of Mtg16–/– mouse phenotypes. In addition to hematopoietic stem cell defects (20), these mice have increased enterocyte proliferation, altered intestinal differentiation, protection against radiation enteritis (12), and develop severe colitis after DSS-induced injury (10), indicating that MTG16 is a key contributor to intestinal epithelial homeostasis.
In this report, we identified MTG16 as a tumor suppressor in colitis-associated carcinogenesis. Mtg16–/– mice exhibited increased tumor multiplicity and burden. These tumors were characterized by augmented proliferation and increased nuclear and cytoplasmic β-catenin, suggesting hyperactive WNT signaling. Further, IPA of intratumoral RNA-seq data indicated that β-catenin (CTNNB1) was a top upstream regulator in Mtg16–/– tumors. Using in vitro approaches, we determined that MTG16 reduces epithelial proliferation, potentially due to attenuated β-catenin–dependent TCF4 activity. Moreover, we observed increased WNT signaling in MTG16-deficient crypts. We acknowledge that the effect on WNT signaling and on epithelial cell proliferation are modest in in vitro studies, but argue that the integrated effects of even subtle phenotypes can yield impressive differences in tumor growth over extended time frames. Our long term, in vivo experiments support this conclusion. Thus, we hypothesize that MTG modulation of WNT signaling is the likely mechanism underlying MTG16’s tumor-suppressive effects (32).
While this study modeled inflammatory tumorigenesis, it is important to note that alterations in WNT signaling that stimulate proliferation and promote tumor development are commonly observed in sporadic colon cancer. In line with this, we have observed decreased MTG16 RNA and protein in sporadic colon cancer samples as compared with adjacent epithelium. Furthermore, a number of nonsynonymous mutations have been identified in MTG16 in sporadic CRC samples, all of which suggests that MTG16 would function as a tumor suppressor in sporadic colon cancer as it does in inflammatory tumorigenesis (17). However, we have recently demonstrated in the WNT-dependent Apc1638/+ murine polyp model that loss of MTG16 did not affect adenoma initiation (11). We believe that these results reflect important differences in the molecular mechanisms of CAC and sporadic CRC. Indeed, while the 2 tumor types share some common molecular features, they are distinct in the order of mutational acquisition. While mutations in the WNT pathway frequently occur early in sporadic CRC, in CAC these alterations are usually identified in the later stages of tumorigenesis, i.e., high-grade dysplasia and adenocarcinoma (33). In support of this, Mtg16–/– tumors in the Apc1638/+ model did show a higher degree of dysplasia than those from WT mice. Furthermore, transcriptomic analysis of the Vanderbilt University Medical Center/Moffitt Cancer Center CRC dataset revealed no change in MTG16 RNA levels at the adenoma stage, although downregulation was seen at the transition to cancer and invasion. Thus, we hypothesize that loss of MTG16 contributes to sporadic CRC progression.
Additionally, loss of MTG16 or concurrent increases in WNT signaling may also stimulate other pathways that promote tumor cell survival and proliferation. Using an unbiased RNA-seq approach, we identified several additional signaling targets that may contribute to increased tumorigenesis observed in Mtg16–/– colons in response to AOM/DSS treatment. The most significantly downregulated genes in Mtg16–/– tumors included several members of the homeobox family, which is generally known to be dysregulated in tumorigenesis and metastasis (34). Interestingly, single nucleotide polymorphisms in distal enhancer regions of the Hox genes have recently been associated with increased IBD risk (35); thus, downregulation of these genes in Mtg16–/– tumors supports the increase in both tumorigenesis and inflammatory injury. The NF-κB pathway was also aberrantly regulated in Mtg16–/– tumors, a pathway that has been implicated in the regulation of apoptosis, proliferation, and tumor cell invasiveness, properties that are significantly enhanced in Mtg16–/– tumors (Figure 4, A–D) (36–38). As alterations in HOX and NF-κB signaling may be a driving force in the enhanced tumorigenesis observed in Mtg16–/– mice, future studies will test for cooperation between loss of MTG16 and activation of these pathways in inflammatory carcinogenesis.
In addition to an epithelial autonomous effect, MTG16 loss may also affect tumor growth by influencing the inflammatory microenvironment. Mtg16–/– tumors displayed increased M2 macrophages and decreased M1 macrophages, with this macrophage balance favoring tumor growth and progression. AOM/DSS–treated Mtg16–/– mice also exhibited decreased overall survival and more severe colitis. Because of the prominent role of MTG16 in both benign and malignant hematopoiesis, we had assumed that promotion of a protumorigenic microenvironment was due to loss of MTG16 in immune cells. However, transplantation of Mtg16–/– marrow had no effect on tumor development, suggesting that the macrophage skewing and tumor-promoting aspects of MTG16 loss was non–hematopoietic cell autonomous. This implies that epithelium-derived MTG16 influences the recruitment or differentiation of immune cells in tumorigenesis. However, while we have not detected MTG16 expression in fibroblasts, endothelial cells, or smooth muscle, it is possible that loss of MTG16 in these other tissues may be contributing to the composition of the tumor microenvironment. We are in the process of generating a conditional Mtg16 allele to formally test the epithelial- and immune cell–derived contributions of MTG16 in inflammation and CAC.
Members of the MTG family contain highly similar NHRs, which are thought to be sites of binding for key regulators and downstream effectors. Our lab has recently examined the role of another MTG family member, myeloid translocation gene related-1 (MTGR1), in inflammatory carcinogenesis. In contrast to Mtg16–/–, Mtgr1–/– mice were extremely sensitive to DSS-induced injury. Resulting Mtgr1–/– tumors were also fewer, smaller, and showed decreased levels of β-catenin as compared with WT mice (21). Based on these data, it is our current hypothesis that MTGR1 is important in survival of initiated tumor cells after injury. Indeed, in the noninflammatory Apc1638/+ polyp model, MTGR1 loss induced a 10-fold increase in tumor number, while MTG16 deficiency had little effect. Thus, our current results highlight the context-specific role of MTGs in tumorigenesis. Despite both proteins being able to regulate WNT signaling by binding to TCF4, it is likely that other signaling pathways, such as NF-κB, HOX, or microenvironmental signaling, combine to determine the exact phenotypic outcome of MTG loss. Further, as these 2 MTGs have 80%–95% homology in their NHRs, these data suggest that nonhomologous regions may have opposing effects in inflammatory carcinogenesis.
In this work, we extend our understanding of MTG16 beyond its known roles in hematopoiesis by identifying it as a tumor suppressor in inflammatory tumorigenesis. Mechanistically, MTG16 regulated WNT signaling, epithelial proliferation, and the tumor microenvironment, all of which influence tumor growth and progression. Furthermore, MTG16 appears to contribute to human disease, as MTG16 was decreased in both IBD and CAC. Interestingly, MTG16 downregulation occurs early in IBD and its expression is even further diminished in CAC, suggesting its levels may serve as a biomarker for advanced cancer risk in patients with IBD. MTG16 levels are also reduced in CRC and it is a mutational target in CRC, suggesting that it may play a broader role and have an impact in sporadic CRC. Cumulatively, our results suggest that MTG16 may be a tumor suppressor in a diverse spectrum of epithelium-based malignancies.
Methods
Animal care.
Male and female Mtg16–/– mice were previously described (27). Animals were provided water and standard chow diet from Harlan Laboratories ad libitum and kept on a 12-hour light/12-dark cycle. Mtg16–/– mice were interbred with TOPGAL mice (Tg [TCF/Lef1-lacZ]34Efu).
AOM/DSS protocol.
Eight- to twelve-week-old C57BL/6 WT (n = 33) or Mtg16–/– (n = 35) mice were injected i.p. with the indicated dose of AOM (Sigma-Aldrich). Three days after injection, the animals were started on the first of 3 (Figure 1A) or 2 (Figure 1C) cycles of 2% DSS (w/v) ad libitum. Each cycle lasted 5 days and was followed by a 16-day recovery period. Stools were examined for consistency and the presence of blood during the treatment period: normal stools = 0 points, loose stool = 1 point, diarrhea = 2 points, and presence of gross blood = 2 points. During the second cycle of recovery (day 35), colonoscopy (Karl Storz Veterinary Endoscopy) was performed to assess injury, tumor multiplicity, and tumor grade (23). Upon sacrifice, tumors were quantified in a blinded fashion under stereo-dissecting microscopy. A histologic injury score was calculated and severity of dysplasia determined by an experienced GI pathologist (MKW) (10, 21). All in vivo procedures were carried out in accordance with protocols approved by the Vanderbilt Institutional Animal Care and Use Committee.
Bone marrow transplant.
A single-cell suspension of bone marrow cells was obtained from the tibia and femurs of three 6-week-old WT donor mice, and red blood cells were lysed with erythrocyte lysis buffer (Buffer EL, Qiagen). Bone marrow cells (1 × 10⁶) were injected via the tail vein into 15 WT and 17 Mtg16–/– lethally irradiated (9 Gy) 8- to 12-week-old recipient mice as outlined in Figure 8A. Because Mtg16–/– bone marrow fails to rescue irradiated mice, the converse bone marrow transplant was not performed. In a modification of a previously described protocol, the mice were then fed acidified water (0.015% HCl in autoclaved water) supplemented with 1.1 g/l neomycin sulfate and 125 mg/l polymyxin B sulfate for 2 weeks after transplantation (38). Twelve weeks after transplantation, the mice were placed on the AOM/DSS protocol described above.
RNA quantification.
RNA was purified from cell lines, tumors, and adjacent nontumor tissue using the RNeasy Mini Kit (Qiagen). cDNA was produced using the iScript kit (Bio-Rad). SYBR Green–based (Bio-Rad) qRT-PCR was performed for the following targets: Mtg16, HoxD10 (accession: NM_013554), HoxD11 (accession: NM_008273), Spock3 (accession: NM_023689), Klk15 (accession: NM_174865), and Mmp12 (accession: NM_008605). Glyceraldehyde 3-phosphate dehydrogenase (Gapdh)–specific primers and Wnt pathway primers (MWNT-I) were purchased from RealTimePrimers. Analysis was performed in triplicate as previously described (13). Fold-change was calculated using the delta-delta Ct method (39).
Immunohistochemistry.
Five-micron sections of paraffin-embedded colons were cut and hematoxylin and eosin (H&E) staining was performed by the Vanderbilt University Translational Pathology Shared Resource. Histologic analysis was performed in a blinded fashion for severity of inflammation (40) and dysplasia by a gastrointestinal pathologist (MKW). For immunohistochemical analysis, sections were dewaxed, hydrated, and endogenous peroxidase activity quenched. Antigen retrieval was performed and sections were blocked and then incubated overnight at 4°C in primary antibody at the following concentrations: anti–β-catenin (BD Transduction Laboratories, catalog 610154), 1:1,000; anti–p-H3 (Millipore, catalog 06-507), 1:150; anti-CD3 (Serotec, catalog MCA147), 1:1,000; anti–CD45r/B220 (BD Pharmingen, catalog 550286), 1:1,000; F4/80 (AbD Serotec, catalog MCA497R), 1:40; anti–arginase I (ARG1) (Santa Cruz Biotechnology, catalog sc-20150), 1:500; anti–IL-1β (R&D Systems, catalog AF-401), 1:40; and anti–8-OHdG (Abcam, catalog ab26842), 1:400. For Vanderbilt CRC tissue microarray staining, CBFA2T3 antibody (MTG16; Proteintech, catalog 17190-1-AP) was used. Specificity of the MTG16 antibody was verified by preblocking the sections with peptide antigen (Proteintech ag9265, aa 167–615). Clinical information is described in Supplemental Table 1 for CRC and Supplemental Table 2 for CAC tissue microarray. The Vectastain ABC Elite System (Vector Labs) was used to visualize staining for immunohistochemistry. For immunofluorescence, slides were counterstained with DAPI (Invitrogen) and mounted with ProLong Gold Antifade (Invitrogen). Identification of intratumoral apoptotic cells was performed using the ApopTag Plus Peroxidase in situ Apoptosis Kit (Millipore). Intratumoral immune cell, apoptosis, proliferation, and DNA damage indices were generated by counting the number of positive cells per HPF (×40 objective) within each tumor from Mtg16–/– and WT tumor-bearing mice. Crypt indices were generated by counting 50 crypts per mouse and presented as the mean number of positive cells per crypt. Tumor β-catenin staining was quantified using a previously reported index incorporating intensity of staining and percentage of nuclear β-catenin–positive cells/HPF (21).
Cell culture.
Cos-7, HCT116, SW480, HT29, NIH 3T3, and HEK293 cell lines were obtained from ATCC and cultured in their respective media. YAMC cells were maintained under permissive growth conditions (33°C) in RPMI medium supplemented with 10% FBS, 2 mM glutamine, and 5 units/ml IFN-γ. Cells were transferred to 37°C in IFN-γ–free RPMI 1640 medium for 24 hours prior to experimental analyses. To evaluate the effect of MTG16 manipulation on cell growth, cells were seeded at 5 × 10³ cells/well in 96-well plates. For cell counting, 2.5 × 10⁵ cells/well were plated in 6-well plates, trypsinized, and counted after 96 hours of siRNA treatment (with trypan blue exclusion). MTS assay was done according to the manufacturer’s instructions (CellTiter96 AQueous One Solution Cell Proliferation Assay; Promega). Briefly, 10 μl of MTS solution was added to each well, followed by a 2-hour incubation. The viability of each sample was analyzed at 490-nm absorbance. BrdU incorporation assay was performed 48 hours after cell plating using the BrdU Cell Proliferation Assay Kit (Cell Signaling Technology, 6813) according to the manufacturer’s instructions.
Gene expression.
For knockdown experiments, MTG16 and scrambled siRNAs were purchased from GE Dharmacon (On TARGET plus J-049042-10, 11, 12, and pooled L-049042-01) and transfected into YAMC cells using Lipofectamine RNAimax (Life Technologies) as per manufacturer’s instructions. Transient overexpression of MTG16 was accomplished with an untagged human MTG16, myc-tagged, HA-tagged, and GAL4-tagged mouse MTG16 constructs using Lipofectamine 2000 and expression was detected by immunoblot analysis using respective antibodies (MTG16: Abcam; Cat No. 33072, myc tag and HA tag antibodies were obtained from Vanderbilt Antibody resource core [VAPR, clones MYC9E10 and 12CA5] while Gal4 antibody was obtained from Santa Cruz Biotechnology [catalog sc-510x]). For mutational analysis, the indicated mutations were engineered in human Mtg8 using the QuikChange mutagenesis kit (Agilent, 200518) and verified by DNA sequencing. Mtg16-deficient YAMC cells were established using a CRISPR/Cas9 system according to the standard protocol. For efficient deletion/mutation, we used 2 gRNAs targeting exon 4 of Mtg16. The first gRNA (CGGCAGCAGCCACTCACCCACGG) was subcloned in the pLX-sg3 vector (Addgene plasmid 50662) according to the recommended protocol. The other gRNA (GCGCACACTGGTGCTGGGCCTGG) was subcloned in lentiCRISPR v2 (Addgene plasmid 52961) (41). gRNAs were designed using an online CRISPR Design Tool (https://chopchop.rc.fas.harvard.edu). YAMC cells were infected with a control vector or the MT16 targeting constructs. Following blasticidin and puromycin selection, the genomic sequence was verified for Cas9-induced mutation/deletion in exon4 of Mtg16 and protein expression was checked by immunoblotting.
Coimmunoprecipitations and immunoblotting.
Coimmunoprecipitations were performed as described previously using Cos-7 cells (42). In brief, Cos-7 cells were plated at 1.5 × 10⁶ cells/10-cm plate and transfected with 2.5 μg of GAL4-tagged WT or mutant MTG and myc-tagged TCF4. Cell lysates were harvested in RIPA (0.5% Triton X-100/0.1% sodium deoxycholate/0.1% sodium dodecyl sulfate) 48 hours after transfection. MTG was precipitated with GAL4DBD antibody beads (Santa Cruz Biotechnology, SC-510AC). For immunoblotting, 5× sample loading buffer was added and the samples resolved in a 4%–10% Tris-glycine acrylamide gel. The membrane was probed with anti–myc tag and anti-GAL4 to detect the interaction between MTG and TCF4 and imaged on an Odyssey scanning system (LI-COR).
TOPFLASH assay.
TOPFLASH-luciferase reporter (32) and CMV-SEAP (encoding secreted alkaline phosphatase [SEAP]) constructs were transfected into NIH 3T3 cells with sequential addition of β-catenin, TCF4, and MTG (either WT or mutant). Luciferase assay was conducted after 48 hours of transfection and luciferase levels were adjusted for transfection efficiency and viability using the SEAP values for each well.
Moffitt/Vanderbilt-Ingram Cancer Center expression array.
The array was previously described (43). The source of the data is the NCBI’s Gene Expression Omnibus (GEO GSE17538).
RNA scope.
The RNA in situ probe for Mtg16 was ordered from Advanced Cell Diagnostics and the sequence is available in their online database. Tissue microarrays were processed and stained exactly according to the manufacturer’s protocol. Staining was scored as percentage of positive cells per core. All cores were also stained with a positive control probe for the housekeeping gene peptidylprolyl isomerase B (cyclophilin B, PPIB) and cores that did not stain robustly with the positive control were omitted. Clinical information of specimens is described in Supplemental Table 1.
RNA-seq analysis.
Initial raw sequencing data were aligned to a reference mouse genome (mm9) using TopHat (version 1.3.1) software (44). The transcript of mouse genome mm9 was downloaded from UCSC as implemented in the Bioconductor package GenomicFeatures. The Bioconductor packages Rsamtools and DESeq were used to estimate the read count for expression of each gene and to detect differentially expressed (DE) genes. For count-based gene expression data, DESeq uses a model based on the negative binomial distribution which includes a dispersion parameter to better estimate variance (45). The P values from DESeq were adjusted by Benjamini and Hochberg’s method to control false discovery rate (FDR) (46). The RNA-seq data have been uploaded to the NCBI Sequence Read Archive (SRA) with project ID PRJNA391745.
Statistics.
Analyses comparing 2 groups including apoptosis, proliferation, immune cell, DNA damage indices, tumor counts, and tumor burden measurements were analyzed using a 2-tailed Student’s t test. Data are presented as individual dots and a line identifying the mean is displayed. A P value less than 0.05 was considered significant. Survival was assessed utilizing survival curve comparison (Kaplan-Meier). Two-way ANOVA was utilized to determine statistical significance between groups when analyzing weight changes and stool scores. Percentages of mice displaying altered dysplasia grade were determined using Fisher’s exact test for each grade. To compare the trajectories of different groups over time, we used a linear model with fixed-effects groups, time points, and group-by-time interaction. Parameters from the model were estimated and used to compare the slopes of MTG16 and control groups. One-way ANOVA and Newman-Keuls post-test was used to compare multiple groups such as those seen with the MTG16 protein index in the human CAC array. For expression array and TCGA analysis, Wilcoxon rank-sum test with continuity correction was applied. All of these analyses were performed using GraphPad Prism 5.0c.
Study approval.
This study was performed in strict accordance with the recommendations in the Guide for the Care and Use of Laboratory Animals of the NIH. The protocol was approved by the Institute of Animal Care and Use Committee at Vanderbilt University (protocol number M/10/355). The protocols and procedures for this study were approved by the Institutional Review Boards at University of Alabama-Birmingham Medical Center, Vanderbilt Medical Center, Veterans Administration Hospital (Nashville, Tennessee, USA), and H. Lee Moffitt Cancer Center, and informed consent was obtained from each subject per institutional protocol.
Author contributions
EMM, CWB, MKM, BP, JJS, AMB, YAC, BZ, SPS, SVP, MAF, FLR, and RN conducted experiments, acquired data, and analyzed data. EMM, CWB, MKM, JJS, AMB, YAC, BP, MAF, MKW, MJR, SWH, KTW, and CSW designed experiments. XC and JL performed bioinformatics analysis and statistics review of data. EMM, CWB, MKM, BP, JJS, AMB, YAC, JJT, LAC, SPS, MKW, MJR, SWH, KTW, and CSW generated the manuscript.
Supplementary Material
Acknowledgments
This work was supported by the NIH grants 5T32DK007673 (EMM), K08DK080221, R01DK099204 (CSW), P50CA095103 (MKW), 1F30DK096718 (BP), 1F31CA167920 (CWB), T32GM07347 (BP), R01AT004821 (KTW), K23DK094832 (MJR), P30DK058404 (Vanderbilt Digestive Disease Research Center), and UL1TR000445 (Vanderbilt CTSA); Merit Review Grants from the Office of Medical Research, Department of Veterans Affairs 1I01BX001426 (CSW), 2I01BX001453 (KTW), and 1IK2BX002126 (LAC); and the American Cancer Society ACS-RSG 116552 (CSW). The funders had no role in study design, data collection and analysis, decision to publish, or preparation of the manuscript.
Version 1. 08/14/2017
Electronic publication
Footnotes
Conflict of interest: The authors have declared that no conflict of interest exists.
Reference information: JCI Insight. 2017;2(16):e78210. https://doi.org/10.1172/jci.insight.78210.
Contributor Information
Bobak Parang, Email: bparang@gmail.com.
J. Joshua Smith, Email: smithj5@mskcc.org.
Joshua J. Thompson, Email: joshua.j.thompson@vanderbilt.edu.
Baolin Zhang, Email: zhangbaolin723@gmail.com.
Melissa A. Fischer, Email: mel.steaplet@vanderbilt.edu.
Xi Chen, Email: steven.chen@med.miami.edu.
Jiang Li, Email: riverlee2008@gmail.com.
Rishi Naik, Email: rishi.d.naik@vanderbilt.edu.
M. Kay Washington, Email: Kay.Washington@vanderbilt.edu.
Keith T. Wilson, Email: keith.wilson@vanderbilt.edu.
References
- 1.Beaugerie L, Itzkowitz SH. Cancers complicating inflammatory bowel disease. N Engl J Med. 2015;373(2):195. doi: 10.1056/NEJMc1505689. [DOI] [PubMed] [Google Scholar]
- 2.Adami HO, et al. The continuing uncertainty about cancer risk in inflammatory bowel disease. Gut. 2016;65(6):889–893. doi: 10.1136/gutjnl-2015-311003. [DOI] [PMC free article] [PubMed] [Google Scholar]
- 3.Rubin DC, Shaker A, Levin MS. Chronic intestinal inflammation: inflammatory bowel disease and colitis-associated colon cancer. Front Immunol. 2012;3:107. doi: 10.3389/fimmu.2012.00107. [DOI] [PMC free article] [PubMed] [Google Scholar]
- 4.Imam MH, Thackeray EW, Lindor KD. Colonic neoplasia in young patients with inflammatory bowel disease and primary sclerosing cholangitis. Colorectal Dis. 2013;15(2):198–203. doi: 10.1111/j.1463-1318.2012.03133.x. [DOI] [PubMed] [Google Scholar]
- 5.Torres J, Pineton de Chambrun G, Itzkowitz S, Sachar DB, Colombel JF. Review article: colorectal neoplasia in patients with primary sclerosing cholangitis and inflammatory bowel disease. Aliment Pharmacol Ther. 2011;34(5):497–508. doi: 10.1111/j.1365-2036.2011.04753.x. [DOI] [PubMed] [Google Scholar]
- 6.Ullman TA, Itzkowitz SH. Intestinal inflammation and cancer. Gastroenterology. 2011;140(6):1807–1816. doi: 10.1053/j.gastro.2011.01.057. [DOI] [PubMed] [Google Scholar]
- 7.Sussman DA, Santaolalla R, Strobel S, Dheer R, Abreu MT. Cancer in inflammatory bowel disease: lessons from animal models. Curr Opin Gastroenterol. 2012;28(4):327–333. doi: 10.1097/MOG.0b013e328354cc36. [DOI] [PMC free article] [PubMed] [Google Scholar]
- 8.Xie J, Itzkowitz SH. Cancer in inflammatory bowel disease. World J Gastroenterol. 2008;14(3):378–389. doi: 10.3748/wjg.14.378. [DOI] [PMC free article] [PubMed] [Google Scholar]
- 9.Calabi F, Pannell R, Pavloska G. Gene targeting reveals a crucial role for MTG8 in the gut. Mol Cell Biol. 2001;21(16):5658–5666. doi: 10.1128/MCB.21.16.5658-5666.2001. [DOI] [PMC free article] [PubMed] [Google Scholar]
- 10.Williams CS, et al. MTG16 contributes to colonic epithelial integrity in experimental colitis. Gut. 2013;62(10):1446–1455. doi: 10.1136/gutjnl-2011-301439. [DOI] [PMC free article] [PubMed] [Google Scholar]
- 11.Parang B, et al. Myeloid translocation genes differentially regulate colorectal cancer programs. Oncogene. 2016;35(49):6341–6349. doi: 10.1038/onc.2016.167. [DOI] [PMC free article] [PubMed] [Google Scholar]
- 12.Poindexter SV, et al. Transcriptional corepressor MTG16 regulates small intestinal crypt proliferation and crypt regeneration after radiation-induced injury. Am J Physiol Gastrointest Liver Physiol. 2015;308(6):G562–G571. doi: 10.1152/ajpgi.00253.2014. [DOI] [PMC free article] [PubMed] [Google Scholar]
- 13.Martinez JA, et al. Deletion of Mtgr1 sensitizes the colonic epithelium to dextran sodium sulfate-induced colitis. Gastroenterology. 2006;131(2):579–588. doi: 10.1053/j.gastro.2006.06.009. [DOI] [PubMed] [Google Scholar]
- 14.Davis JN, McGhee L, Meyers S. The ETO (MTG8) gene family. Gene. 2003;303:1–10. doi: 10.1016/S0378-1119(02)01172-1. [DOI] [PubMed] [Google Scholar]
- 15.Amann JM, et al. Mtgr1 is a transcriptional corepressor that is required for maintenance of the secretory cell lineage in the small intestine. Mol Cell Biol. 2005;25(21):9576–9585. doi: 10.1128/MCB.25.21.9576-9585.2005. [DOI] [PMC free article] [PubMed] [Google Scholar]
- 16.Parang B, et al. The transcriptional corepressor MTGR1 regulates intestinal secretory lineage allocation. FASEB J. 2015;29(3):786–795. doi: 10.1096/fj.14-254284. [DOI] [PMC free article] [PubMed] [Google Scholar]
- 17.Sjöblom T, et al. The consensus coding sequences of human breast and colorectal cancers. Science. 2006;314(5797):268–274. doi: 10.1126/science.1133427. [DOI] [PubMed] [Google Scholar]
- 18.Judson H, et al. Relationship between point gene mutation, chromosomal abnormality, and tumour suppressor gene methylation status in colorectal adenomas. J Pathol. 2006;210(3):344–350. doi: 10.1002/path.2044. [DOI] [PubMed] [Google Scholar]
- 19.Salahshor S, Kressner U, Pâhlman L, Glimelius B, Lindmark G, Lindblom A. Colorectal cancer with and without microsatellite instability involves different genes. Genes Chromosomes Cancer. 1999;26(3):247–252. [PubMed] [Google Scholar]
- 20.Fischer MA, Moreno-Miralles I, Hunt A, Chyla BJ, Hiebert SW. Myeloid translocation gene 16 is required for maintenance of haematopoietic stem cell quiescence. EMBO J. 2012;31(6):1494–1505. doi: 10.1038/emboj.2011.500. [DOI] [PMC free article] [PubMed] [Google Scholar]
- 21.Barrett CW, et al. MTGR1 is required for tumorigenesis in the murine AOM/DSS colitis-associated carcinoma model. Cancer Res. 2011;71(4):1302–1312. doi: 10.1158/0008-5472.CAN-10-3317. [DOI] [PMC free article] [PubMed] [Google Scholar]
- 22.Greten FR, et al. IKKbeta links inflammation and tumorigenesis in a mouse model of colitis-associated cancer. Cell. 2004;118(3):285–296. doi: 10.1016/j.cell.2004.07.013. [DOI] [PubMed] [Google Scholar]
- 23.Becker C, Fantini MC, Neurath MF. High resolution colonoscopy in live mice. Nat Protoc. 2006;1(6):2900–2904. doi: 10.1038/nprot.2006.446. [DOI] [PubMed] [Google Scholar]
- 24.Whitehead RH, VanEeden PE, Noble MD, Ataliotis P, Jat PS. Establishment of conditionally immortalized epithelial cell lines from both colon and small intestine of adult H-2Kb-tsA58 transgenic mice. Proc Natl Acad Sci USA. 1993;90(2):587–591. doi: 10.1073/pnas.90.2.587. [DOI] [PMC free article] [PubMed] [Google Scholar]
- 25.Davies PS, Dismuke AD, Powell AE, Carroll KH, Wong MH. Wnt-reporter expression pattern in the mouse intestine during homeostasis. BMC Gastroenterol. 2008;8:57. doi: 10.1186/1471-230X-8-57. [DOI] [PMC free article] [PubMed] [Google Scholar]
- 26.Cerami E, et al. The cBio cancer genomics portal: an open platform for exploring multidimensional cancer genomics data. Cancer Discov. 2012;2(5):401–404. doi: 10.1158/2159-8290.CD-12-0095. [DOI] [PMC free article] [PubMed] [Google Scholar]
- 27.Chyla BJ, et al. Deletion of Mtg16, a target of t (16;21), alters hematopoietic progenitor cell proliferation and lineage allocation. Mol Cell Biol. 2008;28(20):6234–6247. doi: 10.1128/MCB.00404-08. [DOI] [PMC free article] [PubMed] [Google Scholar]
- 28.Allavena P, Sica A, Garlanda C, Mantovani A. The Yin-Yang of tumor-associated macrophages in neoplastic progression and immune surveillance. Immunol Rev. 2008;222:155–161. doi: 10.1111/j.1600-065X.2008.00607.x. [DOI] [PubMed] [Google Scholar]
- 29.Biswas SK, Sica A, Lewis CE. Plasticity of macrophage function during tumor progression: regulation by distinct molecular mechanisms. J Immunol. 2008;180(4):2011–2017. doi: 10.4049/jimmunol.180.4.2011. [DOI] [PubMed] [Google Scholar]
- 30.Meira LB, et al. DNA damage induced by chronic inflammation contributes to colon carcinogenesis in mice. J Clin Invest. 2008;118(7):2516–2525. doi: 10.1172/JCI35073. [DOI] [PMC free article] [PubMed] [Google Scholar]
- 31.Gamou T, et al. The partner gene of AML1 in t(16;21) myeloid malignancies is a novel member of the MTG8(ETO) family. Blood. 1998;91(11):4028–4037. [PubMed] [Google Scholar]
- 32.Moore AC, et al. Myeloid translocation gene family members associate with T-cell factors (TCFs) and influence TCF-dependent transcription. Mol Cell Biol. 2008;28(3):977–987. doi: 10.1128/MCB.01242-07. [DOI] [PMC free article] [PubMed] [Google Scholar]
- 33.Tang A, et al. Dynamic activation of the key pathways: linking colitis to colorectal cancer in a mouse model. Carcinogenesis. 2012;33(7):1375–1383. doi: 10.1093/carcin/bgs183. [DOI] [PubMed] [Google Scholar]
- 34.Shah N, Sukumar S. The Hox genes and their roles in oncogenesis. Nat Rev Cancer. 2010;10(5):361–371. doi: 10.1038/nrc2826. [DOI] [PubMed] [Google Scholar]
- 35.Mokry M, et al. Many inflammatory bowel disease risk loci include regions that regulate gene expression in immune cells and the intestinal epithelium. Gastroenterology. 2014;146(4):1040–1047. doi: 10.1053/j.gastro.2013.12.003. [DOI] [PubMed] [Google Scholar]
- 36.Dolcet X, Llobet D, Pallares J, Matias-Guiu X. NF-kB in development and progression of human cancer. Virchows Arch. 2005;446(5):475–482. doi: 10.1007/s00428-005-1264-9. [DOI] [PubMed] [Google Scholar]
- 37.Bond M, Fabunmi RP, Baker AH, Newby AC. Synergistic upregulation of metalloproteinase-9 by growth factors and inflammatory cytokines: an absolute requirement for transcription factor NF-kappa B. FEBS Lett. 1998;435(1):29–34. doi: 10.1016/S0014-5793(98)01034-5. [DOI] [PubMed] [Google Scholar]
- 38.Borghaei RC, Rawlings PL, Javadi M, Woloshin J. NF-kappaB binds to a polymorphic repressor element in the MMP-3 promoter. Biochem Biophys Res Commun. 2004;316(1):182–188. doi: 10.1016/j.bbrc.2004.02.030. [DOI] [PubMed] [Google Scholar]
- 39.Schmittgen TD, Livak KJ. Analyzing real-time PCR data by the comparative C(T) method. Nat Protoc. 2008;3(6):1101–1108. doi: 10.1038/nprot.2008.73. [DOI] [PubMed] [Google Scholar]
- 40.Dieleman LA, et al. Chronic experimental colitis induced by dextran sulphate sodium (DSS) is characterized by Th1 and Th2 cytokines. Clin Exp Immunol. 1998;114(3):385–391. doi: 10.1046/j.1365-2249.1998.00728.x. [DOI] [PMC free article] [PubMed] [Google Scholar]
- 41.Sanjana NE, Shalem O, Zhang F. Improved vectors and genome-wide libraries for CRISPR screening. Nat Methods. 2014;11(8):783–784. doi: 10.1038/nmeth.3047. [DOI] [PMC free article] [PubMed] [Google Scholar]
- 42.Amann JM, et al. ETO, a target of t (8;21) in acute leukemia, makes distinct contacts with multiple histone deacetylases and binds mSin3A through its oligomerization domain. Mol Cell Biol. 2001;21(19):6470–6483. doi: 10.1128/MCB.21.19.6470-6483.2001. [DOI] [PMC free article] [PubMed] [Google Scholar]
- 43.Smith JJ, et al. Experimentally derived metastasis gene expression profile predicts recurrence and death in patients with colon cancer. Gastroenterology. 2010;138(3):958–968. doi: 10.1053/j.gastro.2009.11.005. [DOI] [PMC free article] [PubMed] [Google Scholar]
- 44.Trapnell C, Pachter L, Salzberg SL. TopHat: discovering splice junctions with RNA-Seq. Bioinformatics. 2009;25(9):1105–1111. doi: 10.1093/bioinformatics/btp120. [DOI] [PMC free article] [PubMed] [Google Scholar]
- 45.Anders S, Huber W. Differential expression analysis for sequence count data. Genome Biol. 2010;11(10):R106. doi: 10.1186/gb-2010-11-10-r106. [DOI] [PMC free article] [PubMed] [Google Scholar]
- 46.Benjamini Y, Drai D, Elmer G, Kafkafi N, Golani I. Controlling the false discovery rate in behavior genetics research. Behav Brain Res. 2001;125(1–2):279–284. doi: 10.1016/s0166-4328(01)00297-2. [DOI] [PubMed] [Google Scholar]
Associated Data
This section collects any data citations, data availability statements, or supplementary materials included in this article.


