

Abstract
Checkpoint inhibitors have demonstrated efficacy in patients with recurrent or metastatic head and neck squamous cell carcinoma (HNSCC). However, the majority of patients do not benefit from these agents. To improve the efficacy of checkpoint inhibitors, intratumoral (i.t.) injection with innate immune activators, TLR7 and TLR9 agonists, were tested along with programmed death-1 receptor (PD-1) blockade. The combination therapy suppressed tumor growth at the primary injected and distant sites in human papillomavirus–negative (HPV-negative) SCC7 and MOC1, and HPV-positive MEER syngeneic mouse models. Abscopal effects and suppression of secondary challenged tumor suggest that local treatment with TLR agonists in combination with anti–PD-1 provided systemic adaptive immunity. I.t. treatment with a TLR7 agonist increased the ratio of M1 to M2 tumor-associated macrophages (TAMs) and promoted the infiltration of tumor-specific IFNγ-producing CD8+ T cells. Anti–PD-1 treatment increased T cell receptor (TCR) clonality of CD8+ T cells in tumors and spleens of treated mice. Collectively, these experiments demonstrate that combination therapy with i.t. delivery of TLR agonists and PD-1 blockade activates TAMs and induces tumor-specific adaptive immune responses, leading to suppression of primary tumor growth and prevention of metastasis in HNSCC models.
Keywords: Immunology
Keywords: Cancer immunotherapy, Head & neck cancer
Combination therapy with TLR-agonists and PD-1 blockade improves efficacy against murine head and neck cancer models by activating tumor-associated macrophages and expanding tumor-specific T cell clonalities.
Introduction
Head and neck squamous cell carcinoma (HNSCC) is the sixth most common cancer worldwide (1) and has two primary etiologies: i) smoking and alcohol consumption; and ii) HPV infection (1, 2). In contrast to HPV-positive HNSCC patients, which have a more favorable prognosis (3, 4), patients with HPV-negative HNSCC have a poor prognosis, with more than half of the patients developing recurrent or metastatic diseases (5). Recently, checkpoint inhibitors, such as mAbs against programmed death-1 receptor (PD-1) and its ligand (PD-L1), have shown promising therapeutic efficacy in both HPV-positive and -negative HNSCC (6–8). However, these agents confer a benefit in only a minority of patients (9, 10), creating a demand to develop new strategies in cancer immunotherapy with defined immunologic mechanisms of action to treat metastatic and recurrent HNSCC tumors.
The tumor microenvironment (TME) consists of various cell types that accommodate tumor growth (11). High numbers of CD8+ T cells in the TME positively correlate with overall survival in patients with colorectal cancer, in HPV-positive HNSCC, and in patients with other solid tumors (12–15). Recent T cell receptor (TCR) sequencing analyses show that tumor infiltrating lymphocytes (TILs) recognize and target mutated neoantigens, which are then clonally expanded and enriched at the tumor site (16). In the TME, tumors and tumor-associated macrophages (TAMs) express or release immunosuppressive factors, such as checkpoint modulators (e.g., PD-L1) that dampen cytotoxic functions of tumor-specific CD8+ T cells (17). TAMs are recruited from the BM to the TME and promote tumor growth (18–20). TAMs that exhibit protumorigenic and antiinflammatory properties are designated as M2-like macrophages (18–20). In contrast, the macrophages involved in inflammatory responses and pathogen clearance are categorized as M1-like macrophages. TAM accumulation in tumors, especially if they express M2-like cytokines (21), correlates with a poor clinical outcome (22). As macrophages including TAMs are plastic, M2-like macrophages can be converted to an M1-like phenotype (21–23), which is associated with extended survival in patients (24–27).
Innate immune stimulators, including TLR agonists, are under active investigation in the treatment of solid tumors (28–31). TLR agonists initiate innate immune activation in the TME and break immunosuppression and tolerance (32, 33). Among the family of TLRs, TLR7 and TLR9 are expressed primarily in macrophages, plasmacytoid DCs (pDCs), NK and B cells, and likely target stromal cells, but not tumor cells (34). 1V270, developed in our laboratory, is a low–molecular weight TLR7 agonist conjugated to a phospholipid and is a highly potent and stable immune activator (35–37). The lipid moiety in 1V270 prevents an unwanted systemic cytokine storm and improves safety after local administration (38). We have previously demonstrated that intratumoral (i.t.) administration of 1V270 significantly suppresses tumor growth in a murine B16 melanoma model (36). SD-101 — the recently reported TLR9 agonist — is a 30-nucleotide phosphorothioate oligodeoxynucleotide with multiple immunostimulatory CpG motifs (CpG-ODN) (30, 39). SD-101 is optimized to induce high levels of type I IFN and causes maturation of pDC and B cells when delivered i.t. (30, 40, 41). Since TLR agonists act on innate immune cells — not on adaptive immune cells, which PD-1 blockade targets — we hypothesized that activation of antigen-presenting cells (APCs) in the TME by i.t. treatment with TLR agonists would enhance the efficacy of the PD-1 blockade that targets adaptive immune cells. Here, we demonstrate that i.t. treatment with 1V270 or SD-101, in combination with anti–PD-1 antibody, suppressed the growth of tumors not only at the injected site, but also at distant uninjected sites. I.t. treatment with the TLR7 agonist increased the M1/M2 TAM ratio and increased recruitment of activated CD8+ T cells in the TME. Furthermore, TCR analysis by high-throughput RNA sequencing showed that the combination therapy increased CD8+ T cell clonality both locally and systemically. Taken together, TLR7 or TLR9 agonists appear to represent a therapeutic avenue to improving the efficacy of PD-1 blockade in HNSCC.
Results
Combination therapy with i.t. TLR agonists and systemic anti–PD-1 antibody exhibits therapeutic efficacy on tumors at both primary and distant sites.
To evaluate whether local treatment with TLR7 or TLR9 agonists as monotherapy or in combination with anti–PD-1 can suppress tumor growth, C3H mice implanted with SCC7 on both flanks were divided into four treatment groups: i) vehicle; ii) TLR agonist (1V270 or SD-101) (i.t.); iii) anti–PD-1 mAb (i.p. route): and iv) combination therapy with TLR agonist and anti–PD-1. Thereafter, tumor growth was monitored (Figure 1, A–F). 1V270 (100 μg/injection) was given to tumors on the right flank on days 8, 9, 10, 11, and 12. Efficacy of this schedule was determined by preliminary experiments (Figure 1A and Supplemental Figure 1, A–D; supplemental material available online with this article; https://doi.org/10.1172/jci.insight.93397DS1). SD-101 (50 μg/injection) was administered on days 7, 11, 14, 18, and 20 (Figure 1D), similar to a previous report (30). Anti–PD-1 (250 μg/injection) or corresponding isotype control mAb was administered i.p. on days 6, 11, 14, and 18 (30). The sequence of the two therapies, anti–PD-1 prior to TLR agonist, was chosen according to the results of previous experiments (30). Monotherapy with a TLR agonist, 1V270 or SD-101, or anti–PD-1 significantly suppressed tumor growth not only at the primary injected site, but also at uninjected sites (P < 0.001, Figure 1, B, C, E, and F). When TLR agonists were used in combination with anti–PD-1 antibody, both 1V270 and SD-101 significantly enhanced the suppressive efficacy of anti–PD-1 (P < 0.001, Figure 1, B, C, E and F).
Figure 1. Combination therapy with i.t. administration of TLR agonists and systemic anti–PD-1 antibody inhibits tumor growth at both primary and distant sites.

(A–C) The combination therapy with 1V270 and anti–PD-1 antibody. Experimental protocol of the combination therapy with 1V270 and anti–PD-1 antibody (A). SCC7 (1 × 10⁵) cells were implanted in both flanks (n = 12–16/group). 1V270 (100 μg/injection) was i.t. injected into right flank (injected site) daily from days 8–12. Anti–PD-1 antibody or isotype mAb (250 μg/injection) was given i.p. on day 6, 11, 14, and 18. (B and C) Tumor growth at 1V270 injected (B) and uninjected (C) sites was monitored. (D–F) The combination therapy with SD-101 and anti–PD-1. Experimental protocol of the combination therapy with SD-101 and anti–PD-1 antibody (D). SCC7-bearing mice (n = 7–8/group) received SD-101 (50 μg/injection) i.t. in right flank on days 7, 11, 14, and 18. Anti PD-1 antibody (250 μg/injection) was given on day 4, 6, 11, 14, and 18. Tumor growth at injected (E) and uninjected (F) sites was monitored. Data (means ± SEM) are pooled from 2–3 independent experiments showing similar results. *P < 0.05, **P < 0.01, ***P < 0.001 (two-way repeated measures ANOVA with Bonferroni post hoc test). (G–J) Systemic cytokine induction by 1V270 or SD-101 as monotherapy or in combination with anti–PD-1 antibody. Serum samples were collected on day 13 in the experiment using 1V270 (1 day after the last i.t.1V270 injection and 2 days after the second anti–PD-1 treatment) (A), and day 13 in the experiments using SD-101 (1 day after i.t. SD-101/third anti–PD-1 treatment) (D) (magenta arrowheads). Levels of cytokine production of IL-1β (G), IL-6 (H), IP-10 (I), and RANTES (J) were determined by Luminex beads assay. Data represent mean ± SEM. *P < 0.05, **P < 0.01 (Kruskal-Wallis test with Dunn’s post hoc test comparing treatment groups against vehicle).
Systemic cytokine induction after i.t. administration of TLR7 and TLR9 agonists.
Cytokine release syndrome is a serious adverse effect of immunotherapies, including therapies with TLR agonists (42). To evaluate systemic proinflammatory cytokine production after treatment, serum samples were collected on day 13 for 1V270 and on day 12 for SD-101 (Figure 1, G–J). The proinflammatory cytokines IL-1β and IL-6, as well as the type I IFN–inducing chemokines RANTES and IP-10, were measured. No significantly elevated cytokines or chemokines were detected after 1V270 treatment alone or in combination with anti–PD-1 antibody. In contrast, i.t. SD-101 treatment and/or combination with anti–PD-1 induced significantly higher release of IL-1β and IP-10 (P < 0.05, Figures 1, G and I).
I.t. treatment with 1V270 or SD-101 suppresses tumor growth of HPV-positive HNSCC.
Tumor immunogenicity defines sensitivity to immunotherapy and outcomes after treatment (43, 44). Highly immunogenic tumors are more sensitive to immunotherapies than poorly immunogenic tumors (44). To confirm that the treatment with TLR7 and TLR9 agonists is effective in immunogenic HPV-positive HNSCC models, HPV-positive MEER-implanted mice were treated with 1V270 and SD-101, either alone or in combination with anti–PD-1 antibody (Figure 2A). 1V270 significantly suppressed tumor growth as monotherapy at both injected and uninjected sites, with further reduction in tumor growth observed in combination therapy (Figure 2, B and C). Tumors, at both injected and uninjected sites, were completely suppressed by SD-101 monotherapy (Figure 2, D and E). The therapeutic effects of the combination therapy were further validated in the Murine oral cancer 1 (MOC1) model that is generated from 7,12-dimethylbenz[a]anthracene–induced (DMBA-induced) murine primary oral cavity squamous cell carcinoma (45). MOC1 cells form T cell–inflamed tumors capable of inducing immunologic memory (46). The combined TLR7/9 plus anti–PD-1 therapy was as effective in the MOC1 model as other HNSCC models (Supplemental Figure 2).
Figure 2. I.t. treatment with 1V270 or SD-101 suppresses tumor growth of HPV-positive HNSCC.

(A) HPV-positive MEER cells (2 × 10⁶) were implanted in both flanks of C57BL/6 mice. When the tumors reached 2–4 mm diameter, tumor-bearing mice (n = 10/group) were given i.t. 1V270 or SD-101 alone or in combination with anti–PD-1 antibody. (B–E) Tumor growth in mice treated with 1V270 or SD-101 is shown in separate figures using the same data of tumor growth in mice treated with vehicle and anti–PD-1 antibody as the following: (B) 1V270 injected site, (C) 1V270 uninjected site, (D) SD-101 injected site, and (E) SD-101 uninjected site. Combination therapy (magenta, closed circle) and SD-101 monotherapy (blue, open triangle) overlapped after day 22 in D. Data represent mean ± SEM. **P < 0.01, ***P < 0.001 (two-way repeated measures ANOVA with Bonferroni post hoc test). Data shown are representative of two independent experiments showing similar results.
I.t. treatment with TLR7 agonist upregulates immune-related genes.
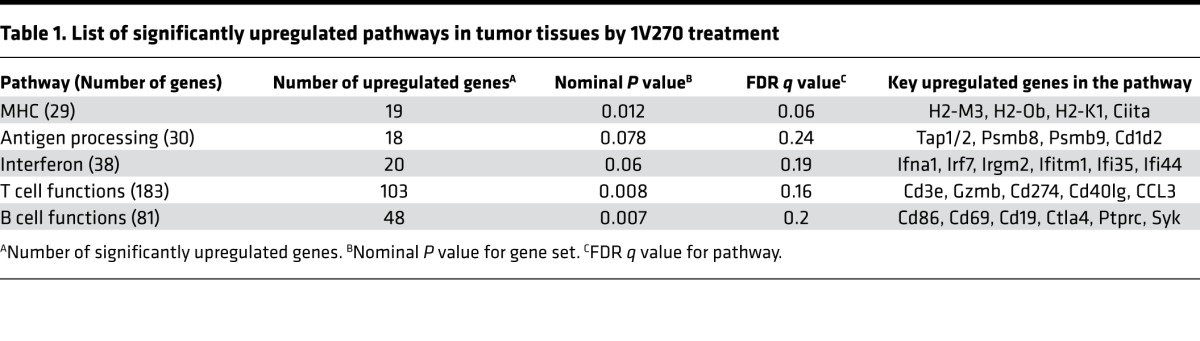
Although both TLR agonists enhanced the tumor suppressive efficacy of PD-1 blockade, SD-101 induced significantly higher serum cytokines, which may indirectly influence tumor progression (47). Hence, we used 1V270, which did not cause systemic cytokine release, for subsequent studies into immune mechanisms of action. For the initial assessment, we investigated gene expression profiles in the tumor tissue specimens after 1V270 treatment by nCounter PanCancer Immune Profiling Panel (NanoString Technologies). The tumors were treated with i.t. 1V270 (n = 5) or vehicle (n = 4) and were harvested 24 hours after the last 1V270 treatment. Table 1 shows the pathways and genes that were significantly enhanced by 1V270 treatment. Among 750 immune-related genes, over 300 genes were upregulated by treatment with 1V270, and 5 of 16 functional pathways were significantly upregulated. 1V270 treatment increased expression of the type I IFN–related genes (Ifna1, Irf7, and Ifi35), genes related to antigen-presenting machinery (MHC related genes [H2-M3, H2-1, and Ciita]), and genes related to cross presentation (Tap1/2 and Cd86). Of importance, 1V270 treatment upregulated genes indicative of T cell infiltration (Cd3e and Cd40lg), the tumoricidal effector molecule Granzyme (GzmB), and IFNγ-inducible genes (Irgm2, Psmb8, Psmb9). Simultaneously, Cd274 (Pd-l1) expression was increased, underscoring the enhanced sensitivity of tumors to combination 1V270 and anti–PD-1 therapy. These data led us to hypothesize that 1V270 treatment upregulates antigen-presenting functions and promotes recruitment of effector T cells in the TME.
Table 1. List of significantly upregulated pathways in tumor tissues by 1V270 treatment.
I.t. injection of 1V270 increases M1/M2 ratio in the TME.
To test the hypothesis that 1V270 treatment promotes the antigen-presenting function of cells in the TME, tumor infiltrating immune cells and splenocytes were isolated on day 13 (24 hours after the final i.t. treatment with 1V270) and day 21. Flow cytometric analysis revealed that approximately 80% or more of CD45+ tumor-infiltrating immune cells were TAMs characterized as the CD45+CD11b+F4/80+ subset on both days 13 and 21 (Supplemental Figure 3, A–C). TAMs were further classified into two phenotypes: M1-like (CD206–) and M2-like (CD206+) macrophages (48–50) (Supplemental Figure 3A). On day 13 after 1V270 monotherapy and combination therapy, the ratio of M1 to M2 macrophage ratio (M1/M2 ratio) was increased in the injected tumors (P < 0.05, Figure 3A). This trend was also observed in tumors harvested on day 21 (Figure 3B). In the uninjected tumors, M1/M2 ratios were similar between treatment groups (Supplemental Figure 3D). The higher the M1/M2 ratio on day 21, the more effective the suppression of tumor growth (Spearman rank correlation –0.74, P < 0.0001, Figure 3C), and this correlation was explained by significant differences among the treatment group means. The tumor infiltration by CD206–F4/80+ M1-like macrophages was confirmed by IHC (Figure 3D). To assess the kinetics of M1 and M2 populations after the 1V270 injection, we assessed the expression of CD206 and MHC class II on days 13 and 20 (M1, CD206−MHC class II+; M2, CD206+MHC class II–) (Figure 3, E and F, and Supplemental Figure 3E). The expression of CD206 was suppressed by 1V270 monotherapy and combination therapy as early as day 13, while MHC class II expression was upregulated in 1V270 and anti–PD-1 treatments on day 21. These data were supported by NanoString gene expression data of tumors harvested on day 13 (Supplemental Table 1). M1 related 15 genes (M1 set) and M2 related 10 genes (M2 set) out of 693 genes were identified (48–51) and 11 out of 15 genes and 6 out of 10 genes were significantly upregulated in the M1 and M2 set, respectively. Among the M2 set of genes, the expression of both CD206 and CD163 was significantly downregulated.
Figure 3. I.t. injection of 1V270 increases M1/M2 ratio in TAMs.

(A–D) SCC7-bearing C3H mice (n = 4–8/group) were treated as described in Figure 1A. Tumors were harvested on day 13 (A) and 21 (B) and tumor-infiltrating cells were analyzed by flow cytometry. TAMs were identified as CD45+CD11b+F4/80+ subset. CD206 expression was used to identify M2 macrophages. The ratios of M1 to M2 (M1/M2) were calculated as % M1 (CD206–) population in CD45+CD11b+F4/80+ divided by % M2 (CD206+) population in CD45+CD11b+F4/80+. M1/M2 ratios of TAMs on days 13 (A) and 21 (B) are shown as scatter plots. Each dot represents an individual animal, and bars indicate means ± SEM. *P < 0.05 and **P < 0.01 (Kruskal-Wallis test with Dunn’s post hoc test). (C) The relationship between the M1/M2 ratio and tumor volume (day 21). Spearman r = –0.74, P < 0.0001. Both the tumor volume at day 21 and the M1/M2 ratio differ significantly among treatment groups (P < 0.05). The significant correlation between tumor volumes and M1/M2 ratio disappeared when we adjusted for the treatment groups. (D) Representative IHC images of the tumors (day 21). Section (5 μm) of cryopreserved tumor tissue was stained for F4/80 (magenta), CD206 (green), and DAPI (blue). Scale bars: 20 μm. (E and F) Kinetics of M1 and M2 population after the 1V270 injection. TAMs on days 13 and 21 were analyzed. M1- and M2 -like macrophages were identified as CD206−MHC class II+ and CD206+MHC class II– populations, respectively. Each dot represents an individual animal, and bars indicate means ± SEM. *P < 0.05 and **P < 0.01 (Kruskal-Wallis test with Dunn’s post hoc test).
I.t. injection of 1V270 promotes maturation and antigen uptake of macrophages migrating from tumors to draining lymph nodes.
To further study whether local 1V270 treatment promotes the antigen-presenting function of TAMs, we evaluated antigen uptake and expression of maturation markers, costimulatory molecules CD40 and CD80, on TAMs and macrophages in draining lymph nodes (dLNs). Alexa Fluor 488–conjugated OVA was administered i.t. to SCC7-bearing mice treated with the combination therapy on day 12 and day 20. On days 13 and 21, tumors and dLNs were isolated, and CD11b+F4/80+ macrophages associated with antigen (Alexa Fluor 488–positive cells) were detected by flow cytometry (Figure 4, A and B, and Supplemental Figure 4). On day 13, the combination therapy significantly increased the antigen-positive macrophages in both injected tumors and the dLN, compared with vehicle treatment (Figure 4, A and B). The antigen-positive macrophage population in the combination-treated mice declined over time from 29.9 % to 20.6 % in dLN on days 13 and 21, respectively (Supplemental Figure 4). The numbers of CD11b+ myeloid cells, CD11b+F4/80+ macrophages, and CD40+ and CD80+ cells in the dLN at the injected site were increased by the combination therapy (Figure 4C). Furthermore, 1V270 also induced PD-L1 expression on CD11b+F4/80+ macrophages (Figure 4C).
Figure 4. I.t. 1V270 treatment enhances antigen-presenting function of TAMs.

(A and B) Analysis of antigen uptake by TAMs in vivo. SCC7-bearing mice (n = 4–5/group) were given the combination treatment (Figure 1A). Antigen (OVA–Alexa Fluor 488) was i.t. injected with the last 1V270 injection. Twenty-four hours later (day 13 after tumor implantation), tumors (A) and draining lymph nodes (dLNs) (B) were harvested, and OVA–Alexa Fluor 488–positive cells in the gated CD45+ population were evaluated by flow cytometry. *P < 0.05 (two-tailed, Welch’s t test). (C) Combination therapy enhanced the expression of costimulatory molecules in the dLN in vivo. SCC7-bearing mice (n = 4–6/group) received the combination treatment as described in Figure 1A. dLN at 1V270 injected sites were harvested on day13. The dLN cells were pooled from each group, the expression of CD40 and CD80 in CD45+CD11b+F4/80+ macrophages was evaluated by flow cytometry, and the numbers of CD40+, CD80+ and PD-L1+ cells per an individual animal were calculated. (D and E) Activation of TAMs by 1V270 treatment ex vivo. CD11b+ cells were isolated from the untreated SCC7-tumor (day 14) using MACS MicroBeads. CD11b+ cells (1.2 × 10⁶/ml) were incubated with 1V270 (1 μM) or vehicle overnight, and the expression of CD40 and CD80 in the gated CD11b+F4/80+ population was assessed by flow cytometric analysis. (D) Representative flow cytometric histogram of CD40, and CD80, and (E) percentage of CD40+, CD80+, and CD206+ cell populations in the gated CD45+CD11b+F4/80+ macrophage population are shown. Data presented are means ± SEM of triplicates and representative of two independent experiments showing similar results. **P < 0.01, ***P < 0.001 (two-tailed, Welch’s t test).
TLR7 and TLR9 are absent in the SCC7 tumor cells (Supplemental Figure 5). Therefore, we hypothesized that 1V270 directly stimulated TAMs and influenced the TME. To verify that 1V270 directly acted on the TAMs, CD11b+ myeloid cells were isolated from tumors (day 14) and ex vivo stimulated with 1V270 or vehicle overnight. The expression of CD40 and CD80 was then analyzed by flow cytometry (Figure 4, D and E) and quantitative reverse transcription PCR (qRT-PCR) (Supplemental Figure 6, A and B). The percentages of CD40+ and CD80+ populations in CD11b+F4/80+ cells increased after in vitro exposure to 1V270 (P < 0.01 and P < 0.001, respectively, Figure 4, D and E). Expression of CD40, CD80, and CD86 were also upregulated after overnight treatment with 1V270 (Supplemental Figure 6B). In addition, ex vivo stimulation of TAMs with 1V270 upregulated M1-like macrophage related genes (Nos2, Ccl5, Ccl3, Tnf, Il-1β, Il-12a, and Il-12b; Supplemental Figure 6C) and reduced expression of M2-like macrophage–related genes (Cd206, Ym1, and Fizz; Supplemental Figure 6D). These data indicate that 1V270 directly acted on the TAMs and enhanced antigen presentation and macrophage polarization.
NK cells are partially involved in antitumor effect of the combination therapy.
NK lymphocytes are innate immune cells that are known to demonstrate antitumor effects (52, 53). Since some NK cells also express TLR7 and are activated by TLR7 agonists (54), we evaluated the involvement of NK cells in the antitumor efficacy of the combination therapy. NK cells were depleted by polyclonal anti–asialo-GM1 antibody in mice treated with the combination therapy or vehicle (Supplemental Figure 7). Depletion of NK cells trended to reverse the suppression effects by combination therapy, but the difference was not significant (P = 0.39), while NK cell depletion did not affect tumor growth in vehicle-treated mice. These data suggest that NK cells partially contributed to the suppressive effects of combination therapy.
Combination therapy increases activated CD8+ T cells in tumors and spleen.
The results above indicate that 1V270 therapy directly activates TAMs and enhances their antigen-presenting function. To study whether the activation of TAMs by 1V270 treatment induces recruitment of tumor-specific T cells to the tumor sites, CD8+ cytotoxic T cells in tumors and spleens were analyzed by flow cytometry. Activated CD8+ T cells were identified by intracellular IFNγ staining. 1V270 monotherapy or its combination with anti–PD-1 increased the number of total CD8+ and IFNγ+CD8+ T cells in tumors at both injected and uninjected sites (Figure 5, A and B, and Supplemental Figure 8). Increased CD8+ T cell infiltration was confirmed by IHC analysis (Figure 5C). In the spleens, the number of IFNγ+CD8+ T cells was significantly increased after combination therapy (Figure 5D). A comparison of tumor volumes at day 21 to the log of the number of infiltrating IFNγ+CD8+ cells yielded a strong negative correlation (P < 0.0001, r = –0.84, Figure 5E). A similar negative correlation with tumor volume was observed in the splenic IFNγ+CD8+ cells (P = 0.03, r = –0.42, Figure 5F). In the spleen, the correlation between the number of IFNγ+CD8+ cells and tumor volumes was attributable to differences between the treatment groups, whereas in the injected tumors — in addition to differences between the treatment groups — the correlation within each treatment group was significant (P < 0.0001, Figure 5E). To further evaluate tumor-specific CD8+ T cells induced by the combination therapy, we assayed antigen specificity of TILs in HPV-positive MEER models using HPV tetramers (Supplemental Figure 9). The number of HPV tetramer–positive CD8+ T cells was significantly increased by the combination therapy, indicating that the combination induced tumor-specific T cell immune responses.
Figure 5. Combination therapy with i.t. 1V270 and systemic anti–PD-1 antibody increases activated CD8+ population in TILs and spleens.

(A–F) 1V270 increased CD8+ population in TILs. C3H mice (n = 5–8/group) were implanted with SCC7 and were treated as described in Figure 1A. Tumors and spleens were harvested on day 21, and T cells in TILs or spleens were analyzed by flow cytometry. (A and B) Tumor-infiltrating CD8+ T cells were gated on CD45+CD3+CD8+ populations. Numbers of CD8+ T cells (A) and IFNγ+CD8+ cells (B) per tumor volume (mm3) were calculated and plotted. (C) Representative IHC images of the tumors (day 21) stained for CD8 (red) and DAPI (blue). Scale bars: 20 μm. (D) Number of IFNγ+CD8+ T cells in spleens. Bars indicate mean ± SEM. Each dot represents an individual animal, and bars indicate mean ± SEM in A, B, and D. *P < 0.05, **P < 0.01 (Kruskal-Wallis test with Dunn’s post hoc test), n = 5–8/group. (E) Tumor volumes at the injected sites were plotted against the log of the number of IFNγ+CD8+ T cells in the TME. Significant negative correlation was demonstrated by Spearman correlation test. Spearman r = –0.84, P < 0.0001, n = 26 mice. (F) The tumor volumes (day 21, injected side) were plotted the log of the number of IFNγ+CD8+ T cells in the spleen (Spearman r = –0.42, P = 0.03, n = 26 mice).
CD8+ T cells were indispensable for the abscopal effect with combination therapy.
To confirm that tumor-specific CD8+ T cells induced by combination therapy contributed to growth suppression of distant metastatic tumors, CD8+ cells were depleted by anti-CD8/Lyt2.1 mAb (Figure 6, A–D). Depletion of CD8+ cells reversed the suppressive effects of the combination therapy at both injected and uninjected sites (P < 0.01, Figure 6B). To further evaluate the role of CD8+ T cells in the metastatic model, CD8+ cells were depleted in mice receiving the combination therapy. The mice were subsequently implanted with SCC7 cells on day 29 (secondary-challenge tumor model) (Figure 6, C and D). Rechallenged tumor growth was suppressed by the combination therapy, and 3 of 10 mice rejected both primary and rechallenged tumors. The effect of combination therapy was diminished by anti-CD8 Ab treatment in comparison with mice treated with an isotype control antibody (P < 0.001, Figure 6D, left). These findings suggest that CD8+ T cells induced by combination therapy are capable of suppressing metastatic and recurrent tumor growth.
Figure 6. Absence of CD8+ cells abrogated antitumor effects of the combination therapy on primary, distant, and secondary-challenged tumors.

(A) Effect of CD8+ cell depletion on the primary tumor growth. Anti-CD8/Lyt2.1 mAb or mouse IgG2a were injected on days –1 and 14. SCC7-bearing mice (n = 6–10/group) were treated with the combination therapy. (B) Tumor volumes on day 18 were compared between vehicle and the combination therapy on injected primary and distant sites. **P < 0.01 (Kruskal-Wallis test with Dunn’s post hoc test). (C) Effects of CD8+ cell depletion on growth of the secondary challenged tumors. SCC7-bearing mice (n = 7–10/group) were treated with the combination therapy. Anti-CD8/Lyt2.1 mAb was i.p. injected on days 28 and 42. The secondary tumors were implanted on day 29. (D) Growth curves of the secondary challenged tumors (left) and Kaplan-Meier survival curves (right). Data represent mean ± SEM. ***P <0.001 (two-way repeated measures ANOVA with Bonferroni post hoc test).
TLR7 agonists and anti–PD-1 antibody increase CD8+ T cell clonality and common TCR clones.
Local and systemic clonal expansion of CD8+ T cells positively correlates with clinical outcomes and immune-related adverse effects after cancer immunotherapy (55–59). Since T cells recognize specific peptide antigens in the context of MHC molecules through the TCR, clonal expansion of particular T cell populations can be detected as increased numbers of mRNA encoding particular TCRα and TCRβ chains (60). To examine whether the combination therapy increased clonality of tumor-specific CD8+ T cells, TCRα repertoires from CD8+ T cells isolated from tumors and spleens were analyzed using next-generation RNA sequencing technology. Both 1V270 and anti–PD-1 monotherapy, as well as the combination, increased clonality indices (TCRα) of tumor-infiltrating CD8+ T cells in the injected tumors and spleen, respectively (Figure 7A). The clonality index of isolated CD8+ T cells (1-normalized Shannon index) showed that 1V270 and anti–PD-1 monotherapy increased clonality in the injected tumors (P < 0.05, and P < 0.05, respectively, Figure 7B) (61). In splenic CD8+ T cells, systemic treatment with anti–PD-1 significantly increased clonality, in comparison with vehicle-treated mice (Figure 7C). On the other hand, the TLR7 agonist alone had a minimal contribution to splenic clonal expansion of CD8+ T cell populations (Figure 7C). Anti–PD-1 monotherapy and combination therapy increased the frequencies of TCRα clones in the spleen that were shared in tumors (at both injected and uninjected sites). The TCRα expansion was associated with suppression of tumor growth (Figure 7, D and E). Collectively, i.t. treatment with TLR7 agonist contributed to clonal expansion of CD8+ T cells in the TME, while anti–PD-1 promoted clonal expansion both locally and systemically.
Figure 7. Systemic anti–PD-1 antibody or combination treatment increased TCR clonality of CD8+ T cells.

(A–D) SCC7-bearing mice (n = 4/group) were treated as described in Figure 1A. Tumors and spleens were harvested on day 21, and CD8+ T cells were isolated using MACS MicroBeads. RNA was isolated, and next-generation sequencing was performed. (A) Representative TCR repertoire clonalities of CD8+ T cells. The x and y axes show the combination of V and J genes (TRAV and TRAJ families), and the z axis shows their frequency of usage. (B and C) Clonality index (1-normalized Shannon index) in injected and distant uninjected tumors (B) and spleens (C). Higher values of the clonality index reflect TCR clonal expansions. Closed and open symbols indicate injected and uninjected tumors, respectively. *P < 0.05, **P < 0.01 (Kruskal-Wallis test with Dunn’s post hoc test). (D) Percentage of clones commonly identified in the injected, uninjected tumors, and spleen in total splenic reads of individual mice. (E) The tumor volumes on day 21 were plotted against the log of % common TCR clones. Significant negative correlation was assessed by a Spearman rank correlation test. Spearman r = –0.69, P < 0.0038, n = 16 mice.
Discussion
Recent developments in cancer immunotherapy constitute a breakthrough in the treatment of HNSCC (7). Checkpoint inhibitors — e.g., anti–PD-1 antibodies (pembrolizumab and nivolumab), anti–PD-L1 antibody (durvalumab), and anti–CTLA-4 antibody (tremelimumab) — are in active clinical trials and show promising efficacy (6–8). Although checkpoint inhibitors have clinical activities and improve survival, the benefit extends to only a minority of patients with metastatic and relapsed HNSCC (9, 62, 63). Thus, there are unmet medical needs that require the development of immunotherapeutic interventions to further enhance efficacy. Since checkpoint inhibitors target adaptive immune cells, we hypothesized that local treatment with TLR agonists, the innate immune activators, would improve antitumor efficacy by activating innate immune cells and recruiting tumor-specific T cells to the TME. We evaluated the antitumor effects of TLR7 or TLR9 agonists alone and in combination with PD-1 blockade in HPV-negative and HPV-positive HNSCC preclinical models. Our data demonstrate that i.t. delivery of TLR agonists primarily acted on TAMs and activated them to become effective APCs that subsequently led to generation of tumor-specific CD8+ T cells. The combination therapy of a TLR agonist with a checkpoint inhibitor suppressed tumor growth more effectively than either agent alone at both injected and uninjected sites (abscopal effects). The combination therapy showed an improved therapeutic efficacy in three separate syngeneic murine HNSCC models. In recent clinical trials, TLR agonists were administered both systemically and locally (64). Our previous report demonstrated that systemic administration of 20 nmol/animal 1V270 did not restrain melanoma B16 growth (Supplemental Figure 10A), whereas i.t. 1V270 (2.2 nmol/animal) suppressed B16 tumor growth on day 15 (36). Furthermore, i.t. administration of SD-101 generated adaptive antitumor immunity (30). Recent reports indicate a few safety concerns after the systemic administration of TLR agonists (42), including lymphopenia and flu-like symptoms (65). A repeated systemic administration of TLR agonists can also induce a state of immune unresponsiveness, known as TLR tolerance (Supplemental Figure 10B) (66). Thus, the i.t delivery route was chosen in this project.
Clinically, the sequence regimen of two anticancer therapeutics may be crucial for optimal activity. In our preliminary experiments, mice with CT26 tumors that received concomitant treatment with anti–PD-1 and SD-101 had incomplete tumor suppression (50% rejection, Supplemental Figure 11), whereas mice given anti–PD-1 at day 7 and SD-101 at day 19 after tumor implantation rejected 100% of tumors (30). This difference could be explained by the CD8+ T populations induced by SD-101 and anti–PD-1 (30). Anti–PD-1 therapy prior to SD-101 conditioned TME for correct T cell differentiation to a memory phenotype (30), prior to activation by TLR stimulated APCs. We therefore used the treatment sequence of anti–PD-1 prior to TLR agonist therapy.
Although TLR7 and TLR9 share similar characteristics, such as endosomal location and potent type I IFN–inducing properties, there are also differences in the kinetics of type I IFN release induced by agonists of the two receptors. The TLR9 agonist produces a more sustained and longer induction of IFN transcripts than the TLR7 agonist (67). Monotherapies administered i.t. with either the TLR7 agonist 1V270 or the TLR9 agonist SD-101 significantly reduced tumor growth in both injected and uninjected tumors in the HPV-negative HNSCC model (Figure 1). As expected, HPV-positive tumors responded to i.t. TLR treatment better than HPV-negative SCC7 tumors (Figures 1 and 2). The therapeutic efficacy of SD-101 was mirrored by increased levels of type I IFN–related chemokines in sera, while 1V270 targeting did not cause any systemic cytokine release (Figure 1G). Since both TLR7 and TLR9 commonly use the adaptor protein MyD88, we examined the contribution of MyD88 in tumor growth using the HPV-positive MEER model (Supplemental Figure 12). HPV-positive MEER tumors grew faster in Myd88–/–, Tlr7–/–, and Tlr9–/– mice compared with WT mice, suggesting that TLR7, TLR9, and their common adaptor protein MyD88 contributed to antitumor activity.
In the SCC7 model, 1V270 monotherapy increased the M1/M2 ratio in CD11b+F4/80+ TAMs as early as day 13 (Figure 3A). Classically activated M1-like macrophages are considered immunostimulatory and inhibit tumor growth, associated with the induction of high levels of proinflammatory cytokines and increased levels of oxygen and nitrogen radicals (68–70). M1 macrophages express high levels of MHC class I and –class II molecules, secrete complement factors that facilitate phagocytosis, present antigens to T cells, and shape an adaptive immune response. As opposed to M1-like macrophages, activated M2-like macrophages promote tumor initiation, progression, and metastasis (24–26). Our data indicate that a high M1/M2 ratio is associated with smaller tumor volumes in the SCC7 model (Figure 3C) (71). These findings are consistent with clinical reports in which improved patient survival is associated with increased M1/M2 ratios (24–27). In the SCC7 model, the increased M1/M2 ratios observed after 1V270 monotherapy, or combination therapy with anti–PD-1 on day 13, were largely attributable to a reduced M2 population. Expansion of the M1 population occurred at a later time point, on day 21. These results suggest that the kinetics of M1 and M2 expansion contributed differently to the M1/M2 ratios after i.t. TLR agonist treatment. Furthermore, the TLR7 agonist promoted antigen uptake and expression of costimulatory molecules in TAMs and suppressed CD206 expression ex vivo. These results indicate that the TLR7 agonist directly acted on TAMs and reprogrammed M2-like macrophages to the M1 phenotype. Upregulation of antigen-presenting function was reflected by the NanoString gene expression data (Table 1 and Supplemental Table 1) in which the genes related to antigen-presenting machinery were upregulated after i.t. treatment with 1V270.
In our study, numbers of CD8+ T cells in the TME negatively correlated with tumor volumes (Figure 5E). Depletion of CD8+ cells impaired the abscopal effect and prevented rejection of secondary-challenged tumors after combination therapy (Figure 6). Experiments using HPV tetramers showed that combination therapy recruited viral antigen specific–activated CD8+ T cells to the TME and dLNs. TCR sequence analyses showed that the clonality index of CD8+ T cells in TILs increased after i.t. treatment with 1V270 or anti–PD-1 antibody (Figure 7B). There was a similar trend at uninjected sites. These results indicate that these treatments caused local and systemic expansion of the tumor-reactive CD8+ T cell clones. Anti–PD-1 therapy also contributed to an increased frequency of common TCR clones in the spleens (Figure 7D). This result suggests that anti–PD-1 increased circulating antitumor CD8+ T cells, resulting in decreased tumor volumes at distant sites. The circulating tumor-specific CD8+ T cells were late-differentiated effector cells, while T cells present in the TME showed exhaustion profiles (72). Our data support the concept that cooperation involving two mechanisms of action by a TLR7 agonist and a checkpoint-blocker anti–PD-1 was required for optimal growth suppression of aggressive tumors.
The expression of TLR7 or TLR9 by malignant cells has been reported to promote tumor progression following treatment with TLR7 or TLR9 agonists (73–75). We investigated mRNA expression of TLRs among 967 human cancer cell lines in the Cancer Cell Line encyclopedia database (https://portals.broadinstitute.org/ccle) and found that only a few of the human cancer cell lines express TLR7 or TLR9. Though four (0.4%) epithelial cell lines (SKMEL31, KR97, OUMS23, HT1197) express TLR7 mRNA, none are derived from head and neck cancer. We confirmed that the SCC7 and MEER tumor cell lines do not express TLR7 or TLR9 by qRT-PCR (Supplemental Figure 5). Thus, the antitumor activity exerted by 1V270 or SD-101 has a direct effect on immune cells and not on the tumor itself.
In summary, our study showed that i.t administration of a TLR7 agonist directly acted on TAMs, promoted their antigen-presenting functions, and thereby increased the infiltration of activated CD8+ T cells in tumors at both local and distant sites. The checkpoint inhibitor, anti–PD-1, increased the frequency of common TCR clones in primary and distant tumors and spleens (Figure 8). The combination therapy with TLR agonist and anti–PD-1 was effective in both HPV-negative and HPV-positive HNSCC preclinical models and suppressed the growth of uninjected distal site tumors (abscopal effect). In the HPV-negative HNSCC model, three immunologic parameters associated with efficacy were identified: i) M1/M2 TAM ratio; ii) number of IFNγ+CD8+ T cells in tumors and spleens; and iii) frequency of common TCR clones in injected or uninjected tumors and spleen. The improved therapeutic efficacy of a novel combination therapy with TLR7 and TLR9 agonists and a checkpoint inhibitor warrants the initiation of clinical trials with this regimen.
Figure 8. TLR agonist effect with anti–PD-1 antibody in HNSCC.

I.t. TLR agonists treatment increases the M1/M2 ratio in the TME, promoting antigen-presenting functions of TAMs and tumor-specific T cell differentiation. Local administration of TLR agonists also increases recruitment of tumor-specific CD8+ T cells to the tumor and draining lymph nodes. The checkpoint inhibitor, anti–PD-1 antibody, increases the frequency of TCR clones commonly identified in injected and uninjected tumors and spleen in individual mice.
Methods
Animals, reagents, and cell lines.
WT female C3H/HeOuJ, WT C57BL/6, and WT Balb/c mice were obtained from The Jackson Laboratory. Myd88–/–, Tlr7–/–, and Tlr9–/– mice were gifted from Shizuo Akira (Osaka University, Osaka) and bred by UCSD Animal Care Program. TLR7 agonist phospholipid conjugate, 1V270, was synthesized in our laboratory (35). SD-101, the TLR9 agonist, was provided by Dynavax Technologies (30). Endotoxin levels of these drugs were determined by Endosafe (Charles River Laboratory) and were less than 10 EU/μmol. Rat anti–mouse PD-1 monoclonal antibody (clone RMP1-14) and rat IgG2a isotype control (clone 2A3) were purchased from BioXcell. HPV-negative SCC7 cells and HPV-positive MEER cells expressing HPV E6/7 antigens were gifted by John Lee (Sanford Research, Sioux Falls, South Dakota, USA) and tested for mouse pathogen contamination prior to being introduced to mice. SCC7 cells were cultured in RPMI 1640 medium (Thermo Fisher Scientific) supplemented with 10% FBS (Omega Scientific Inc.) and penicillin/streptomycin (Thermo Fisher Scientific) at 37°C with 5% CO2. MEER cells were cultured in E-Media, which consisted of 68% DMEM (Thermo Fisher Scientific), 23% Ham F12 (Thermo Fisher Scientific), 10% FBS and supplemented with 500 mg/l hydrocortisone (Sigma-Aldrich), 8.4mg/l cholera toxin (Sigma-Aldrich), 5 mg/l transferrin (Sigma-Aldrich), 5 mg/l insulin (Sigma-Aldrich), 1.36 mg/l tri-iodo-thyronine (Sigma-Aldrich), and 5 mg/l EGF (Thermo Fisher Scientific). MOC1 cells were provided by R. Uppaluri (Dana-Farber Cancer Institute, Boston, Massachusetts, USA) and cultured in IMDM/F12 (2:1) media (IMDM [GE Healthcare Life Sciences] and Ham F12) supplemented with 5% FBS, penicillin/streptomycin, 5 ng/ml of EGF, 400 ng/ml of hydrocortisone, and 5 mg/ml of insulin (45). CT26 cells were purchased from the American Type Culture Collection.
Syngeneic mouse models of HNSCC.
For the HPV-negative HNSCC model, 1 × 10⁵ SCC7 cells were s.c. inoculated in C3H/HeOuJ mice. Treatment with 1V270 administered i.t. was initiated on day 8 after inoculation, when the diameter of the tumors reached 2–4 mm. In the preliminary experiments, we compared the various dose and frequency of 1V270 monotherapy. Briefly, SCC7-implanted mice received daily treatment with a range of 8–100 μg/injection of 1V270 for 5 days (Supplemental Figure 1, A and B). Treatments with 35 and 100 μg/injection showed significant therapeutic efficacy (Supplemental Figure 1B). Daily administration suppressed tumor growth more significantly than the twice-a-week regimen (Supplemental Figure 1, C and D). Thus, daily treatment with 1V270 ([100 μg/injection] [93 nmol/injection]) was used throughout the studies. SD-101 (50 μg/injection) was administered on days 7, 11, 14, and 18 after inoculation as recommended by Dynavax (30). Murine anti–PD-1 mAb (250 μg/injection) was given by i.p. routes according to the previous report (30). Vehicle or isotype antibody were given as controls. For the HPV-positive HNSCC model, or MOC1, 2 × 10⁶ MEER or MOC1 cells were implanted s.c. in both flanks of C57BL/6 mice. Treatment with 1V270 or SD101 administered i.t. was given on one side of the flank only. For CT26 model, 8 × 10⁴ CT26 cells were implanted s.c. in both flanks of Balb/C mice. Detailed experimental protocols are shown in Figures 1, 2, and 6. Tumor length and width were recorded, and tumor volumes were calculated using the formula: volume (mm3) = ([width]2 × length)/2.
Analysis of tumor infiltrating immune cells and dLN cells.
SCC7-bearing mice were sacrificed on day 13 or day 21. Tumors were dissociated using a mouse tumor dissociation kit with the gentleMACS Octo Dissociator according to the manufacture’s protocol (Miltenyi Biotec). Splenocytes were dissociated in RPMI1640 supplemented with 2% FBS, 100 U/ml penicillin, and 100 μg/ml streptomycin. LNs were digested in HBSS supplemented with 20 μg/ml DNaseI (Worthington) and 0.6 mg/ml collagenese type I (Worthington) for 20 minutes at room temperature. Single-cell suspensions were labeled by incubation with cocktails of antibodies at 4°C for 30 minutes. Fixation/Permeabilization Solution kits (BD Biosciences) were used for intracellular IFNγ staining. The antibodies are described in Supplemental Table 2. Total cell number was counted by the ViaCount assay (Millipore, Sigma-Aldrich), and average cell viability was approximately 85%. Dead cells were excluded by propidium iodide staining. The M1/M2 ratio was calculated in the CD45+CD11b+F4/80+ macrophage population. Tumor-specific CD8+ T cells were identified by HPV E7–specific tetramer staining. Briefly, TILs and dLN cells were isolated from mice bearing HPV-positive MEER tumors and stained with HPV E7–specific tetramer (iTAg Tetramer/PE-H-2Db HPV 16 E7 [RAHYNIVTF], MBL International Corporation).
Antigen uptake study in vivo and CD11b+ cell isolation.
Alexa Fluor 488 OVA conjugates (50 μg; Thermo Fisher Scientific) was i.t. injected on days 12 and 20 in SCC7-bearing mice that received the combination therapy shown in Figure 1A. Tumors and dLN were harvested 24 hours after antigen injection (days 13 and 21 after tumor implantation). Alexa Fluor 488 OVA–positive cells were identified in the gated CD45+CD11b+F4/80+ population by flow cytometry.
SCC7 tumors were harvested on day 14, and single-cell suspensions were prepared. For ex vivo studies of TAMs, CD11b+ cells were isolated using CD11b MicroBeads (Miltenyi Biotec) according to the manufacturer’s instructions. CD11b+ cells were cultured overnight with 1 μM 1V270 in DMEM (Thermo Fisher Scientific) supplemented with 10% FBS and penicillin/streptomycin.
Immunohistochemical analysis.
Tumors were embedded in OCT compound (Sakura Finetek Inc.). Sections (5 μm) were fixed in cold acetone for 2 minutes and washed with PBS. Sections were incubated in blocking buffer (10% normal goat serum-PBS) (Cell Signaling Technology) for 1 hour. Antibodies were diluted in 2% normal goat serum-PBS. After 2 hours of incubation at room temperature with the primary antibodies, the sections were rinsed with PBS and incubated with the secondary antibodies for 1 hour. Antibody details are shown in Supplemental Table 3. Images were acquired using Axio Imager Zeiss microscope (Zeiss).
CD8+ cell and NK cell depletion in vivo.
Mouse anti-CD8/Lyt2.1 mAb (clone HB129/116-13.1) and corresponding isotype control (clone C1.18.4) were purchased from BioXcell. The SCC7-bearing mice were i.p. injected with 400 μg of anti-CD8/Lyt2.1 mAb or isotype control as described in Figure 6, A and C. Anti–asialo GM1 rabbit polyclonal antibody (50 μl, Wako) or rabbit IgG polyclonal antibody (Millipore) was injected on days –1, 1, 5, 9, 13, and 17. We confirmed depletion of CD8+ T cells and NK cells (>97%) using flow cytometry. In some experiments, SCC7-bearing mice treated with the combination therapy were secondarily challenged with 1 × 10⁵ SCC7 cells on day 29, and tumor growth was monitored.
qRT-PCR.
RNA was isolated from SCC7, MEER, and RAW264.7 murine macrophage cells using RNeasy Plus kit (QIAGEN) and was reverse-transcribed using iScript (Bio-Rad). qPCR analyses using Taqman Gene Expression Assay (Thermo Fisher Scientific) were performed by CFX-Connect Real-Time System (Bio-Rad) as described previously (76). Primers purchased from Thermo Fisher Scientific are described in Supplemental Table 4. The comparative ΔΔCt method was used to measure fold changes in expression of RNA transcript levels. ΔCt values were determined by subtracting the average of GAPDH or Rps20 Ct values from each test Ct value.
Gene expression assay using NanoString nCounter System.
Tumor-bearing C3H mice were treated with 1V270 (n = 5) daily from day 8–12, or with vehicle (n = 4) or no treatment (n = 3), and were sacrificed on day 13. Total RNA was extracted from the tumor tissue specimens as described above. The isolated RNA was then subjected to NanoString nCounter PanCancer Immuno Profiling Panel (NanoString Technologies) according to the manufacturer’s protocol. The expression values were normalized using positive controls to eliminate platform-related variation, negative controls to eliminate background effect, and housekeepers to remove variation due to sample input. After zero-expression genes were removed, a total of 693 genes were included in the group comparison. Linear models for microarray (Limma) were built to compare groups regarding log2 expression values. The Benjamini-Hochberg procedure was applied to control for FDR and used to adjust for P values. A gene was considered significantly changed if FDR < 0.05. If the fold change in expression for 1V270 vs. controls was greater than 1, it was upregulated. In addition, gene set enrichment analysis (GSEA) was performed to assess if 16 gene sets of interest were enriched with these significantly differentially expressed genes.
TCR repertoire analysis.
CD8+ T cells were isolated from single-cell suspensions of injected and uninjected tumors, or spleens using mouse CD8+ T cell isolation kit (Miltenyi Biotec). Total RNA was extracted from CD8+ T cells with RNeasy Mini Kit (Qiagen) according to the manufacturer’s instructions. Next-generation sequencing was performed with unbiased TCR repertoire analysis technology (Repertoire Genesis Inc.). Unbiased adaptor-ligation PCR was performed according to previous reports (60). In brief, total RNA was converted to cDNA with Superscript III reverse transcriptase (Thermo Fisher Scientific). Then, double-stranded cDNA (ds-cDNA) was synthesized and an adaptor was ligated to the 5′ end of the ds-cDNA and then cut with SphI restriction enzyme. PCR was performed with P20EA adaptor primer and TCRα-chain constant region–specific (mCA1) or TCRβ-chain constant region–specific (mCB1) primers. The second PCR was performed with P20EA and either mCA2 or mCB2 using the same PCR conditions. After Tag PCR amplification, index (barcode) sequences were added by amplification with Nextera XT index kit v2 setA (Illumina). Sequencing was done with the Illumina Miseq paired-end platform (2 × 300 bp). Data processing, assignment, and data aggregation were performed using repertoire analysis software. TCR sequences were assigned with a data set of reference sequences from the international ImMunoGeneTics information system (IMGT) database (http://www.imgt.org). Nucleotide sequences of complementarity-determining region 3 (CDR3) regions ranged from conserved Cysteine at position 104 (Cys104) of IMGT nomenclature to conserved phenylalanine at position 118 (Phe118) and the following Glycine (Gly119) was translated into amino acid sequences. The identical TRV, TRJ, and deduced amino acid sequence of CDR3 were defined as a unique sequence read (USR). The copy numbers of identical USRs were automatically counted by RG software. TCR diversity analysis was performed according to the method previously described (77, 78).
Statistics.
For continuous outcomes, means and SEM were calculated and plotted using Prism software (version 5.0, GraphPad Software Inc.). In dot plots, each dot represents a tumor, a spleen, or dLNs from an individual mouse, and the horizontal and vertical bars indicate mean and ± SEM. A two tailed Welch’s t test was used to compare two groups. Using tumor volumes collected over all time points, two-way repeated measures ANOVA was used to compare different groups, with pair-wise contrasts made at the final time point using a Bonferroni post hoc test. To compare cross-sectional outcomes among more than two groups, Kruskal-Wallis tests with Dunn’s post hoc test were applied. Correlations between tumor volumes and an immune biomarker (e.g. M1/M2 ratio) were analyzed using a Spearman rank correlation test, pooling data across the different treatment groups. Analysis of covariance (sometimes on the log scale) was used to test whether the correlation was mediated by differences among the treatment groups in both mean immune marker level and tumor volumes. P values lower than 0.05 were considered statistically significant. R (version 3.3.2, http://www.r-project.org) was used to perform gene expression analysis. Mice injected with 1V270 were compared with the control mice. NanoString technology was used to obtain gene expression values for the 750 genes included in their Mouse PanCancer Immune Profiling Panel with 16 functional pathways. The expression values were normalized using R-package NanoStringNorm. After zero-expression genes were removed, a total of 693 genes were included in the group comparison. Linear models for microarray (Limma) were built to compare groups regarding log2 expression values. The Benjamini-Hochberg procedure was applied to control for FDR and used to adjust for P values. A gene was considered significantly changed if FDR < 0.05. If the fold change in expression for 1V270 vs. control was greater than 1, it was considered upregulated. In addition, GSEA was performed to assess if 16 gene sets of interest were enriched with these significantly differentially expressed genes. Gene sets were claimed to be significantly enriched if FDR q value < 0.25.
Study approval.
This study was performed using established laboratory protocols including the tumor dissociation, processing, freezing, storing, and thawing of cells, as well as the staining procedure, data acquisition, and gating strategy. The studies involving animals were carried out in strict accordance with the recommendations in the Guide for the Care and Use of Laboratory Animals of the NIH (National Academies Press, 2011). The protocol was approved by the IACUC of UCSD (PHS Animal Welfare assurance number A3033-01). According to the criteria for immediate euthanasia, when a tumor becomes ulcerated or necrotic in murine s.c. tumor models, some experiments with aggressive SCC7 were terminated when the tumor reached between 400 and 800 mm3. Mice were sacrificed by CO2 inhalation, followed by cervical dislocation. All efforts were made to minimize animal suffering. The protocols in the experiments using T cells were prepared according to the Minimal Information About T cell Assays (MIATA) recommendations (www.miataproject.org).
Author contributions
FSK, T. Hayashi, and EEWC designed experiments and analyzed the data. FSK, SY, AA, SSZ, T. Hosoya, MMK, JAV, and T. Hayashi performed experiments. CG and RLC provided TLR9 agonist SD101 and contributed data interpretation. KSM and MP performed statistical analysis of the NanoString data. KK, TM, and RS performed TCR repertoire analyses. FSK, KSM, DAC, T. Hayashi, and EEWC wrote the manuscript. All authors contributed to discussions.
Supplementary Material
Acknowledgments
We thank John Lee, of Sanford Research, for supplying SCC7 and MEER cells, and we thank Xiaodan Song and Yuqi Qiu for technical and statistical help, respectively. We also thank Howard B. Cottam and Angela Robles for editing the manuscript. This work was supported by the Immunotherapy Foundation (principal investigator, EEWC) and CA132379.
Version 1. 09/21/2017
Electronic publication
Footnotes
Conflict of interest: DAC is a founder of Dynavax Technologies Corporation.
Reference information: JCI Insight. 2017;2(18):e93397. https://doi.org/10.1172/jci.insight.93397.
Contributor Information
Fumi Sato-Kaneko, Email: fukaneko@ucsd.edu.
Shiyin Yao, Email: syao@ucsd.edu.
Alast Ahmadi, Email: aahmadiiveli@ucsd.edu.
Shannon S. Zhang, Email: sszhang@email.arizona.edu.
Tadashi Hosoya, Email: tahosoya@ucsd.edu.
Megan M. Kaneda, Email: mkaneda@ucsd.edu.
Judith A. Varner, Email: jvarner@ucsd.edu.
Minya Pu, Email: mpu@ucsd.edu.
Cristiana Guiducci, Email: cguiducci@dynavax.com.
Robert L. Coffman, Email: rcoffman@dvax.com.
Kazutaka Kitaura, Email: kitaura@repertoire.co.jp.
Takaji Matsutani, Email: matsutani@repertoire.co.jp.
Ryuji Suzuki, Email: suzuki@repertoire.co.jp.
Tomoko Hayashi, Email: thayashi@ucsd.edu.
References
- 1.Leemans CR, Braakhuis BJ, Brakenhoff RH. The molecular biology of head and neck cancer. Nat Rev Cancer. 2011;11(1):9–22. doi: 10.1038/nrc2982. [DOI] [PubMed] [Google Scholar]
- 2.Siegel RL, Miller KD, Jemal A. Cancer statistics, 2016. CA Cancer J Clin. 2016;66(1):7–30. doi: 10.3322/caac.21332. [DOI] [PubMed] [Google Scholar]
- 3.D’Souza G, et al. Case-control study of human papillomavirus and oropharyngeal cancer. N Engl J Med. 2007;356(19):1944–1956. doi: 10.1056/NEJMoa065497. [DOI] [PubMed] [Google Scholar]
- 4.Fakhry C, et al. Improved survival of patients with human papillomavirus-positive head and neck squamous cell carcinoma in a prospective clinical trial. J Natl Cancer Inst. 2008;100(4):261–269. doi: 10.1093/jnci/djn011. [DOI] [PubMed] [Google Scholar]
- 5.Whang SN, Filippova M, Duerksen-Hughes P. Recent Progress in Therapeutic Treatments and Screening Strategies for the Prevention and Treatment of HPV-Associated Head and Neck Cancer. Viruses. 2015;7(9):5040–5065. doi: 10.3390/v7092860. [DOI] [PMC free article] [PubMed] [Google Scholar]
- 6.Blankenstein T, Coulie PG, Gilboa E, Jaffee EM. The determinants of tumour immunogenicity. Nat Rev Cancer. 2012;12(4):307–313. doi: 10.1038/nrc3246. [DOI] [PMC free article] [PubMed] [Google Scholar]
- 7.Schoenfeld JD. Immunity in head and neck cancer. Cancer Immunol Res. 2015;3(1):12–17. doi: 10.1158/2326-6066.CIR-14-0205. [DOI] [PubMed] [Google Scholar]
- 8.Szturz P, Vermorken JB. Immunotherapy in head and neck cancer: aiming at EXTREME precision. BMC Med. 2017;15(1):110. doi: 10.1186/s12916-017-0879-4. [DOI] [PMC free article] [PubMed] [Google Scholar]
- 9.Ferris RL, et al. Nivolumab for Recurrent Squamous-Cell Carcinoma of the Head and Neck. N Engl J Med. 2016;375(19):1856–1867. doi: 10.1056/NEJMoa1602252. [DOI] [PMC free article] [PubMed] [Google Scholar]
- 10.Echarri MJ, Lopez-Martin A, Hitt R. Targeted Therapy in Locally Advanced and Recurrent/Metastatic Head and Neck Squamous Cell Carcinoma (LA-R/M HNSCC) Cancers (Basel) 2016;8(3):E27. doi: 10.3390/cancers8030027. [DOI] [PMC free article] [PubMed] [Google Scholar]
- 11.Quail DF, Joyce JA. Microenvironmental regulation of tumor progression and metastasis. Nat Med. 2013;19(11):1423–1437. doi: 10.1038/nm.3394. [DOI] [PMC free article] [PubMed] [Google Scholar]
- 12.Sato E, et al. Intraepithelial CD8+ tumor-infiltrating lymphocytes and a high CD8+/regulatory T cell ratio are associated with favorable prognosis in ovarian cancer. Proc Natl Acad Sci USA. 2005;102(51):18538–18543. doi: 10.1073/pnas.0509182102. [DOI] [PMC free article] [PubMed] [Google Scholar]
- 13.Nakano O, et al. Proliferative activity of intratumoral CD8(+) T-lymphocytes as a prognostic factor in human renal cell carcinoma: clinicopathologic demonstration of antitumor immunity. Cancer Res. 2001;61(13):5132–5136. [PubMed] [Google Scholar]
- 14.Sharma P, et al. CD8 tumor-infiltrating lymphocytes are predictive of survival in muscle-invasive urothelial carcinoma. Proc Natl Acad Sci USA. 2007;104(10):3967–3972. doi: 10.1073/pnas.0611618104. [DOI] [PMC free article] [PubMed] [Google Scholar]
- 15.Ward MJ, et al. Tumour-infiltrating lymphocytes predict for outcome in HPV-positive oropharyngeal cancer. Br J Cancer. 2014;110(2):489–500. doi: 10.1038/bjc.2013.639. [DOI] [PMC free article] [PubMed] [Google Scholar]
- 16.Straten PT, Guldberg P, Seremet T, Reisfeld RA, Zeuthen J, Becker JC. Activation of preexisting T cell clones by targeted interleukin 2 therapy. Proc Natl Acad Sci USA. 1998;95(15):8785–8790. doi: 10.1073/pnas.95.15.8785. [DOI] [PMC free article] [PubMed] [Google Scholar]
- 17.Gajewski TF, Schreiber H, Fu YX. Innate and adaptive immune cells in the tumor microenvironment. Nat Immunol. 2013;14(10):1014–1022. doi: 10.1038/ni.2703. [DOI] [PMC free article] [PubMed] [Google Scholar]
- 18.Noy R, Pollard JW. Tumor-associated macrophages: from mechanisms to therapy. Immunity. 2014;41(1):49–61. doi: 10.1016/j.immuni.2014.06.010. [DOI] [PMC free article] [PubMed] [Google Scholar]
- 19.Shand FH, et al. Tracking of intertissue migration reveals the origins of tumor-infiltrating monocytes. Proc Natl Acad Sci USA. 2014;111(21):7771–7776. doi: 10.1073/pnas.1402914111. [DOI] [PMC free article] [PubMed] [Google Scholar]
- 20.Murray PJ, et al. Macrophage activation and polarization: nomenclature and experimental guidelines. Immunity. 2014;41(1):14–20. doi: 10.1016/j.immuni.2014.06.008. [DOI] [PMC free article] [PubMed] [Google Scholar]
- 21.Kaneda MM, et al. PI3Kγ is a molecular switch that controls immune suppression. Nature. 2016;539(7629):437–442. doi: 10.1038/nature19834. [DOI] [PMC free article] [PubMed] [Google Scholar]
- 22.Ruffell B, Coussens LM. Macrophages and therapeutic resistance in cancer. Cancer Cell. 2015;27(4):462–472. doi: 10.1016/j.ccell.2015.02.015. [DOI] [PMC free article] [PubMed] [Google Scholar]
- 23.Kaneda MM, et al. Macrophage PI3Kγ Drives Pancreatic Ductal Adenocarcinoma Progression. Cancer Discov. 2016;6(8):870–885. doi: 10.1158/2159-8290.CD-15-1346. [DOI] [PMC free article] [PubMed] [Google Scholar]
- 24.Ohri CM, Shikotra A, Green RH, Waller DA, Bradding P. Macrophages within NSCLC tumour islets are predominantly of a cytotoxic M1 phenotype associated with extended survival. Eur Respir J. 2009;33(1):118–126. doi: 10.1183/09031936.00065708. [DOI] [PubMed] [Google Scholar]
- 25.Zhang M, et al. A high M1/M2 ratio of tumor-associated macrophages is associated with extended survival in ovarian cancer patients. J Ovarian Res. 2014;7:19. doi: 10.1186/1757-2215-7-19. [DOI] [PMC free article] [PubMed] [Google Scholar]
- 26.Italiani P, Boraschi D. From Monocytes to M1/M2 Macrophages: Phenotypical vs. Functional Differentiation. Front Immunol. 2014;5:514. doi: 10.3389/fimmu.2014.00514. [DOI] [PMC free article] [PubMed] [Google Scholar]
- 27.Jackute J, Zemaitis M, Pranys D, Sitkauskiene B, Miliauskas S, Sakalauskas R. The prognostic influence of tumor infiltrating M1 and M2 phenotype macrophages in resected non-small cell lung cancer. Eur Respir J. 2016;48(suppl 60):OA1775 [Google Scholar]
- 28.van Duin D, Medzhitov R, Shaw AC. Triggering TLR signaling in vaccination. Trends Immunol. 2006;27(1):49–55. doi: 10.1016/j.it.2005.11.005. [DOI] [PubMed] [Google Scholar]
- 29.Lu H, et al. VTX-2337 is a novel TLR8 agonist that activates NK cells and augments ADCC. Clin Cancer Res. 2012;18(2):499–509. doi: 10.1158/1078-0432.CCR-11-1625. [DOI] [PubMed] [Google Scholar]
- 30.Wang S, et al. Intratumoral injection of a CpG oligonucleotide reverts resistance to PD-1 blockade by expanding multifunctional CD8+ T cells. Proc Natl Acad Sci USA. 2016;113(46):E7240–E7249. doi: 10.1073/pnas.1608555113. [DOI] [PMC free article] [PubMed] [Google Scholar]
- 31.Leung ACF, et al. Phase 1b/2, open label, multicenter, study of intratumoral SD-101 in combination with pembrolizumab in anti-PD1 naïve and experienced metastatic melanoma patients. J Clin Oncol. 2017;35(15_suppl):9550 [Google Scholar]
- 32.Prins RM, et al. The TLR-7 agonist, imiquimod, enhances dendritic cell survival and promotes tumor antigen-specific T cell priming: relation to central nervous system antitumor immunity. J Immunol. 2006;176(1):157–164. doi: 10.4049/jimmunol.176.1.157. [DOI] [PubMed] [Google Scholar]
- 33.Whitmore MM, et al. Synergistic activation of innate immunity by double-stranded RNA and CpG DNA promotes enhanced antitumor activity. Cancer Res. 2004;64(16):5850–5860. doi: 10.1158/0008-5472.CAN-04-0063. [DOI] [PubMed] [Google Scholar]
- 34.Trinchieri G, Sher A. Cooperation of Toll-like receptor signals in innate immune defence. Nat Rev Immunol. 2007;7(3):179–190. doi: 10.1038/nri2038. [DOI] [PubMed] [Google Scholar]
- 35.Chan M, et al. Synthesis and immunological characterization of toll-like receptor 7 agonistic conjugates. Bioconjug Chem. 2009;20(6):1194–1200. doi: 10.1021/bc900054q. [DOI] [PMC free article] [PubMed] [Google Scholar]
- 36.Hayashi T, et al. Additive melanoma suppression with intralesional phospholipid-conjugated TLR7 agonists and systemic IL-2. Melanoma Res. 2011;21(1):66–75. doi: 10.1097/CMR.0b013e328340ce6c. [DOI] [PMC free article] [PubMed] [Google Scholar]
- 37.Hemmi H, et al. Small anti-viral compounds activate immune cells via the TLR7 MyD88-dependent signaling pathway. Nat Immunol. 2002;3(2):196–200. doi: 10.1038/ni758. [DOI] [PubMed] [Google Scholar]
- 38.Wu CC, et al. Innate immune protection against infectious diseases by pulmonary administration of a phospholipid-conjugated TLR7 ligand. J Innate Immun. 2014;6(3):315–324. doi: 10.1159/000355217. [DOI] [PMC free article] [PubMed] [Google Scholar]
- 39.Nijnik A. Immunomodulatory approaches for prevention and treatment of infectious diseases. Curr Opin Microbiol. 2013;16(5):590–595. doi: 10.1016/j.mib.2013.06.011. [DOI] [PubMed] [Google Scholar]
- 40.Crittenden M, et al. Current clinical trials testing combinations of immunotherapy and radiation. Semin Radiat Oncol. 2015;25(1):54–64. doi: 10.1016/j.semradonc.2014.07.003. [DOI] [PMC free article] [PubMed] [Google Scholar]
- 41.Ribas A, et al. Phase 1b/2, open-label, multicenter, dose escalation and expansion trial of intratumoral SD 101 in combination with pembrolizumab in patients with metastatic melanoma. Ann Oncol. 2016;27(suppl_6):1067P [Google Scholar]
- 42.Engel AL, Holt GE, Lu H. The pharmacokinetics of Toll-like receptor agonists and the impact on the immune system. Expert Rev Clin Pharmacol. 2011;4(2):275–289. doi: 10.1586/ecp.11.5. [DOI] [PMC free article] [PubMed] [Google Scholar]
- 43.Lawrence MS, et al. Mutational heterogeneity in cancer and the search for new cancer-associated genes. Nature. 2013;499(7457):214–218. doi: 10.1038/nature12213. [DOI] [PMC free article] [PubMed] [Google Scholar]
- 44.Lechner MG, et al. Immunogenicity of murine solid tumor models as a defining feature of in vivo behavior and response to immunotherapy. J Immunother. 2013;36(9):477–489. doi: 10.1097/01.cji.0000436722.46675.4a. [DOI] [PMC free article] [PubMed] [Google Scholar]
- 45.Judd NP, et al. ERK1/2 regulation of CD44 modulates oral cancer aggressiveness. Cancer Res. 2012;72(1):365–374. doi: 10.1158/0008-5472.CAN-11-1831. [DOI] [PMC free article] [PubMed] [Google Scholar]
- 46.Davis RJ, et al. Anti-PD-L1 Efficacy Can Be Enhanced by Inhibition of Myeloid-Derived Suppressor Cells with a Selective Inhibitor of PI3Kδ/γ. Cancer Res. 2017;77(10):2607–2619. doi: 10.1158/0008-5472.CAN-16-2534. [DOI] [PMC free article] [PubMed] [Google Scholar]
- 47.Zitvogel L, Galluzzi L, Kepp O, Smyth MJ, Kroemer G. Type I interferons in anticancer immunity. Nat Rev Immunol. 2015;15(7):405–414. doi: 10.1038/nri3845. [DOI] [PubMed] [Google Scholar]
- 48.Sica A, Mantovani A. Macrophage plasticity and polarization: in vivo veritas. J Clin Invest. 2012;122(3):787–795. doi: 10.1172/JCI59643. [DOI] [PMC free article] [PubMed] [Google Scholar]
- 49.Murray PJ, Wynn TA. Protective and pathogenic functions of macrophage subsets. Nat Rev Immunol. 2011;11(11):723–737. doi: 10.1038/nri3073. [DOI] [PMC free article] [PubMed] [Google Scholar]
- 50.Jablonski KA, et al. Novel Markers to Delineate Murine M1 and M2 Macrophages. PLoS ONE. 2015;10(12):e0145342. doi: 10.1371/journal.pone.0145342. [DOI] [PMC free article] [PubMed] [Google Scholar]
- 51.Martinez FO, Gordon S. The M1 and M2 paradigm of macrophage activation: time for reassessment. F1000Prime Rep. 2014;6:13. doi: 10.12703/P6-13. [DOI] [PMC free article] [PubMed] [Google Scholar]
- 52.Fehniger TA, Cooper MA. Harnessing NK Cell Memory for Cancer Immunotherapy. Trends Immunol. 2016;37(12):877–888. doi: 10.1016/j.it.2016.09.005. [DOI] [PMC free article] [PubMed] [Google Scholar]
- 53.Zamai L, et al. NK cells and cancer. J Immunol. 2007;178(7):4011–4016. doi: 10.4049/jimmunol.178.7.4011. [DOI] [PubMed] [Google Scholar]
- 54.Hotz C, Bourquin C. Systemic cancer immunotherapy with Toll-like receptor 7 agonists: Timing is everything. Oncoimmunology. 2012;1(2):227–228. doi: 10.4161/onci.1.2.18169. [DOI] [PMC free article] [PubMed] [Google Scholar]
- 55.Tumeh PC, et al. PD-1 blockade induces responses by inhibiting adaptive immune resistance. Nature. 2014;515(7528):568–571. doi: 10.1038/nature13954. [DOI] [PMC free article] [PubMed] [Google Scholar]
- 56.Subudhi SK, et al. Clonal expansion of CD8 T cells in the systemic circulation precedes development of ipilimumab-induced toxicities. Proc Natl Acad Sci USA. 2016;113(42):11919–11924. doi: 10.1073/pnas.1611421113. [DOI] [PMC free article] [PubMed] [Google Scholar]
- 57.Postow MA, et al. Peripheral T cell receptor diversity is associated with clinical outcomes following ipilimumab treatment in metastatic melanoma. J Immunother Cancer. 2015;3:23. doi: 10.1186/s40425-015-0070-4. [DOI] [PMC free article] [PubMed] [Google Scholar]
- 58.Cha E, et al. Improved survival with T cell clonotype stability after anti-CTLA-4 treatment in cancer patients. Sci Transl Med. 2014;6(238):238ra70. doi: 10.1126/scitranslmed.3008211. [DOI] [PMC free article] [PubMed] [Google Scholar]
- 59.Tamura K, et al. Characterization of the T cell repertoire by deep T cell receptor sequencing in tissues and blood from patients with advanced colorectal cancer. Oncol Lett. 2016;11(6):3643–3649. doi: 10.3892/ol.2016.4465. [DOI] [PMC free article] [PubMed] [Google Scholar]
- 60.Yoshida R, et al. A new method for quantitative analysis of the mouse T-cell receptor V region repertoires: comparison of repertoires among strains. Immunogenetics. 2000;52(1-2):35–45. doi: 10.1007/s002510000248. [DOI] [PubMed] [Google Scholar]
- 61.Shannon CE. The mathematical theory of communication. 1963. MD Comput. 1997;14(4):306–317. [PubMed] [Google Scholar]
- 62.Alexander GS, et al. Immune biomarkers of treatment failure for a patient on a phase I clinical trial of pembrolizumab plus radiotherapy. J Hematol Oncol. 2016;9(1):96. doi: 10.1186/s13045-016-0328-4. [DOI] [PMC free article] [PubMed] [Google Scholar]
- 63.Chow LQ, et al. Antitumor Activity of Pembrolizumab in Biomarker-Unselected Patients With Recurrent and/or Metastatic Head and Neck Squamous Cell Carcinoma: Results From the Phase Ib KEYNOTE-012 Expansion Cohort. J Clin Oncol. 2016;35(32):3838–3845. doi: 10.1200/JCO.2016.68.1478. [DOI] [PMC free article] [PubMed] [Google Scholar]
- 64.Iribarren K, et al. Trial Watch: Immunostimulation with Toll-like receptor agonists in cancer therapy. Oncoimmunology. 2016;5(3):e1088631. doi: 10.1080/2162402X.2015.1088631. [DOI] [PMC free article] [PubMed] [Google Scholar]
- 65.Fidock MD, et al. The innate immune response, clinical outcomes, and ex vivo HCV antiviral efficacy of a TLR7 agonist (PF-4878691) Clin Pharmacol Ther. 2011;89(6):821–829. doi: 10.1038/clpt.2011.60. [DOI] [PubMed] [Google Scholar]
- 66.Bourquin C, et al. Systemic cancer therapy with a small molecule agonist of toll-like receptor 7 can be improved by circumventing TLR tolerance. Cancer Res. 2011;71(15):5123–5133. doi: 10.1158/0008-5472.CAN-10-3903. [DOI] [PubMed] [Google Scholar]
- 67.Marshall JD, Heeke DS, Gesner ML, Livingston B, Van Nest G. Negative regulation of TLR9-mediated IFN-alpha induction by a small-molecule, synthetic TLR7 ligand. J Leukoc Biol. 2007;82(3):497–508. doi: 10.1189/jlb.0906575. [DOI] [PubMed] [Google Scholar]
- 68.Fairweather D, Cihakova D. Alternatively activated macrophages in infection and autoimmunity. J Autoimmun. 2009;33(3-4):222–230. doi: 10.1016/j.jaut.2009.09.012. [DOI] [PMC free article] [PubMed] [Google Scholar]
- 69.Mantovani A, Sica A, Sozzani S, Allavena P, Vecchi A, Locati M. The chemokine system in diverse forms of macrophage activation and polarization. Trends Immunol. 2004;25(12):677–686. doi: 10.1016/j.it.2004.09.015. [DOI] [PubMed] [Google Scholar]
- 70.Sindrilaru A, et al. An unrestrained proinflammatory M1 macrophage population induced by iron impairs wound healing in humans and mice. J Clin Invest. 2011;121(3):985–997. doi: 10.1172/JCI44490. [DOI] [PMC free article] [PubMed] [Google Scholar]
- 71.Khurana D, et al. Characterization of a spontaneously arising murine squamous cell carcinoma (SCC VII) as a prerequisite for head and neck cancer immunotherapy. Head Neck. 2001;23(10):899–906. doi: 10.1002/hed.1130. [DOI] [PubMed] [Google Scholar]
- 72.Baitsch L, et al. Exhaustion of tumor-specific CD8+ T cells in metastases from melanoma patients. J Clin Invest. 2011;121(6):2350–2360. doi: 10.1172/JCI46102. [DOI] [PMC free article] [PubMed] [Google Scholar]
- 73.Min R, et al. Toll-like receptor-9 agonists increase cyclin D1 expression partly through activation of activator protein-1 in human oral squamous cell carcinoma cells. Cancer Sci. 2012;103(11):1938–1945. doi: 10.1111/j.1349-7006.2012.02394.x. [DOI] [PMC free article] [PubMed] [Google Scholar]
- 74.Kauppila JH, et al. Toll-like receptor 9 mediates invasion and predicts prognosis in squamous cell carcinoma of the mobile tongue. J Oral Pathol Med. 2015;44(8):571–577. doi: 10.1111/jop.12272. [DOI] [PubMed] [Google Scholar]
- 75.Kotrashetti VS, Nayak R, Bhat K, Hosmani J, Somannavar P. Immunohistochemical expression of TLR4 and TLR9 in various grades of oral epithelial dysplasia and squamous cell carcinoma, and their roles in tumor progression: a pilot study. Biotech Histochem. 2013;88(6):311–322. doi: 10.3109/10520295.2013.785592. [DOI] [PubMed] [Google Scholar]
- 76.Hayashi T, et al. Induction of Tolerogenic Dendritic Cells by a PEGylated TLR7 Ligand for Treatment of Type 1 Diabetes. PLoS ONE. 2015;10(6):e0129867. doi: 10.1371/journal.pone.0129867. [DOI] [PMC free article] [PubMed] [Google Scholar]
- 77.Ricotta C. Through the jungle of biological diversity. Acta Biotheor. 2005;53(1):29–38. doi: 10.1007/s10441-005-7001-6. [DOI] [PubMed] [Google Scholar]
- 78.Rempala GA, Seweryn M. Methods for diversity and overlap analysis in T-cell receptor populations. J Math Biol. 2013;67(6-7):1339–1368. doi: 10.1007/s00285-012-0589-7. [DOI] [PMC free article] [PubMed] [Google Scholar]
Associated Data
This section collects any data citations, data availability statements, or supplementary materials included in this article.