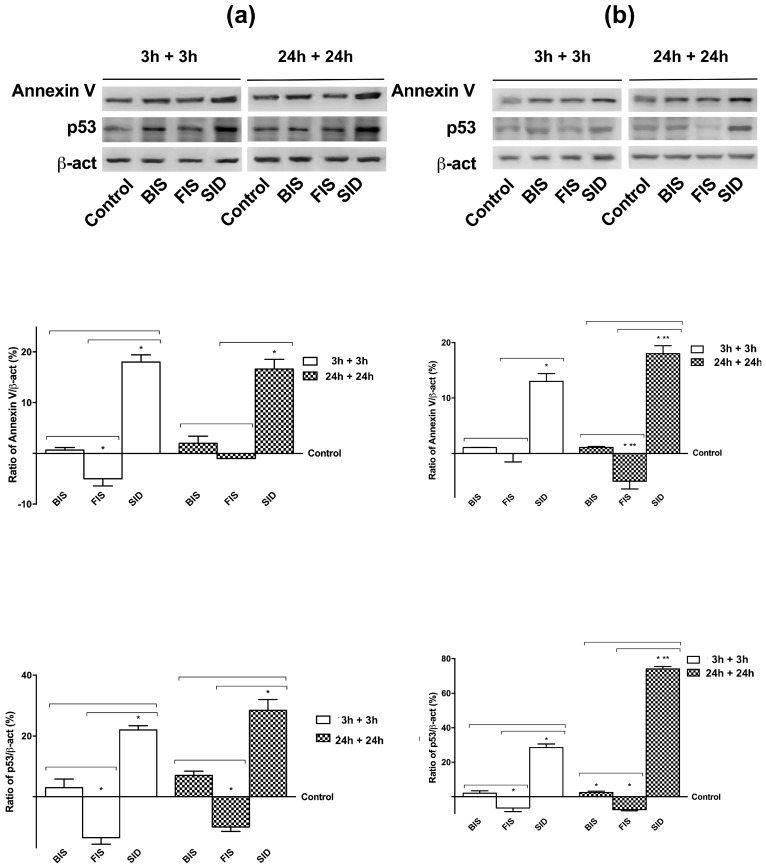
Figure 7.
Western blot and densitometric analysis of p53 and Annexin V on GTL-16 (a) and Caco-2 cells (b) maintained for equal time (3 h plus 3 h; 24 h plus 24 h) without iron treatments. Western blot (upper) and densitometric analysis (down) are reported. The results after normalization through β-act and control, are expressed as a means ± SD (% vs. control) of four independent experiments for each cell type. * p < 0.05 vs. control; ** p < 0.05 vs. correspondent column at different time; bars p < 0.05 among different treatments at the same time.

