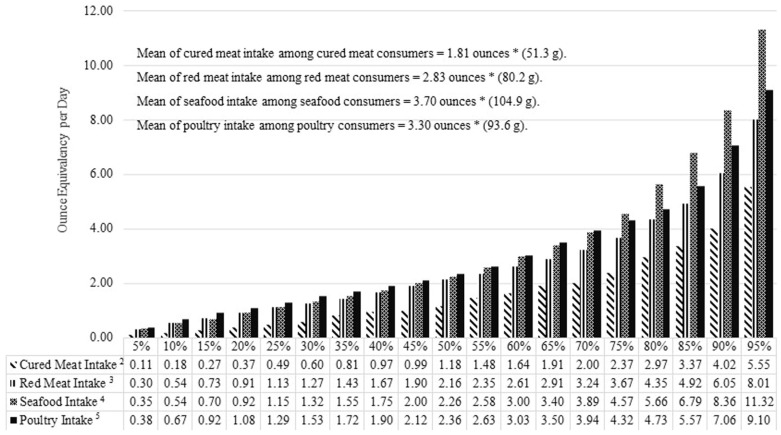
Figure 2.
Intake distribution of red meat, cured meat, seafood and poultry, among U.S. respondents from the National Health and Nutrition Examination Survey Food Pattern Equivalency Database (NHANES, FPED) 2013–2014 Datasets 1. 1 Adapted from United States Department of Agriculture, Agricultural Research Service, NHANES, WWEIA, FPED 2013–2014 available at [12]. 2 Intake of red meat from red meat consumers in this dataset. 3 Intake of processed meat from processed meat consumers in this dataset. 4 Intake of seafood from seafood consumers in this dataset. 5 Intake of poultry from poultry consumers in this dataset. * 1 ounce ≈ 28 g.

