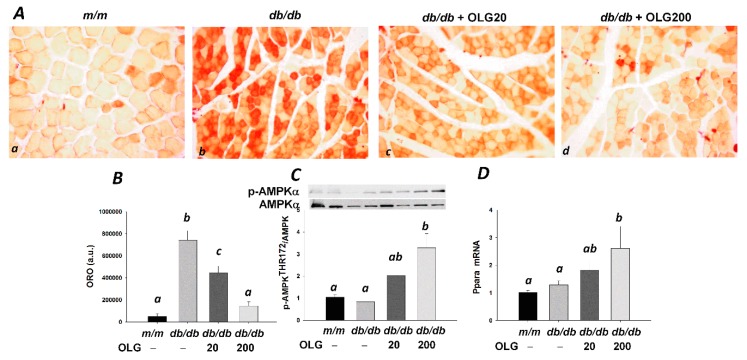
Figure 4.
Oil red O (ORO)-stained tibialis anterior muscle sections (Aa–d) in m/m and db/db mice with or without oligonol (OLG) supplementation (200×); (B) Quantification of neutral lipids stained with ORO solution in tibialis anterior muscle (n = 3/group); (C) Representative blots of AMPKα and phospho-AMPKα (Thr172) are shown (n = 5–6/group); (D) Ppara mRNA expression level is expressed as mean ratio to control after normalization with 18S mRNA levels (n = 5–6/group). Fold differences were calculated using the ΔΔCt method. Values presented are mean ± SEM. Significance (p < 0.05) among groups is denoted by different letters.

