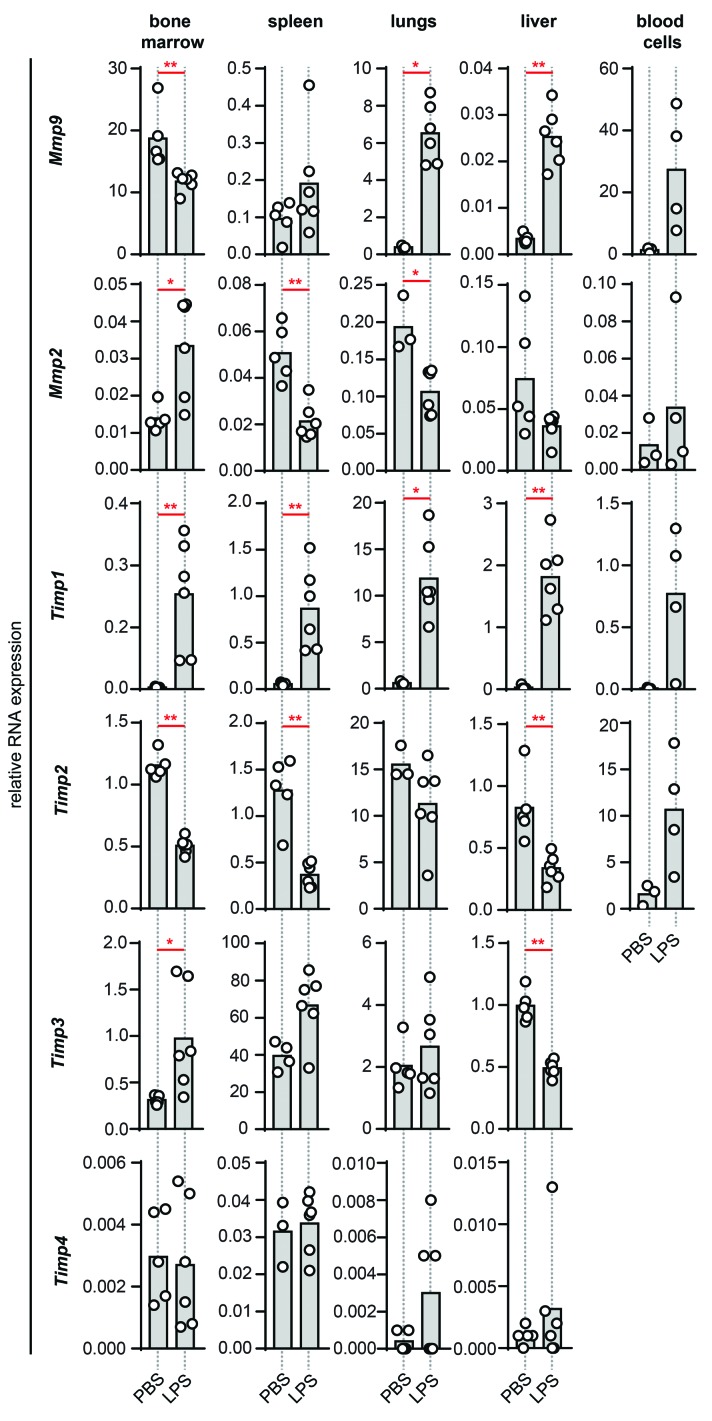
Figure 2.
The effects of endotoxemia on Mmp9, Mmp2, Timp1, Timp2, Timp3 and Timp4 RNA expression. Relative RNA expression in bone marrow, spleen, lungs, liver and blood cells of LPS-treated mice in comparison with the control group given PBS. Data were normalized for the housekeeping gene Tbp. Histograms represent group medians and individual data points from single animals are shown by dots. *P<0.05, **P<0.01, as determined by the Mann-Whitney test (n = 3–6).

