Immunoglobulin light chain (AL) amyloidosis is a progressive plasma cell dyscrasia which is characterized by the deposition of amyloid fibers derived from immunoglobulin light chain or their fragments systemically in many organs.1 The characteristics of amyloids relate to disease severity and sequelae, including the target organs where amyloids accumulate, such as the heart, kidney, liver, gut and peripheral nerves. Heart failure is usually the critical life-threatening condition; the median survival time may range from months to some years.1 We have recently characterized ten putative genetic risk loci (at a significance level of <10−5) for AL amyloidosis using a genome-wide association study (GWAS) approach on a total of 1229 German, UK and Italian patients.2 In the study herein we carried out a systematic GWAS-based association study on clinical data, including the affected organs and the isotype of serum immunoglobulins (Ig). We hypothesized that clinical profiles may be able to define distinct molecular subtypes.
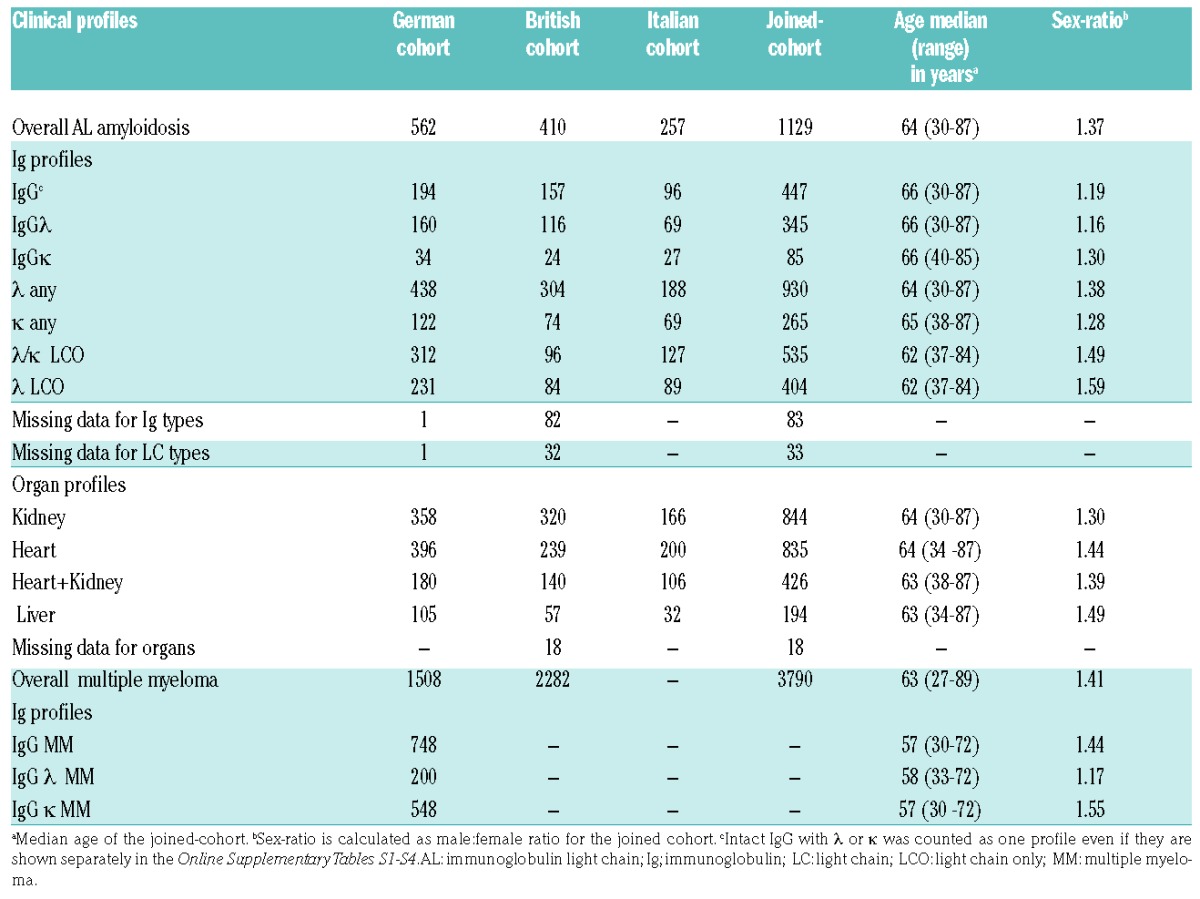
AL amyloidosis and multiple myeloma (MM) patient populations are described in Table 1; more details can be found in the study by da Silva Filho and colleagues.2 A total of nine clinical profiles were selected based on patient numbers, amyloid organ involvement (heart, kidney, heart + kidney and liver, irrespective of whether other organs were involved) and Ig profiles (intact IgG with λ or κ, λ any, κ any, λ/κ light chain only (LCO), and λ LCO). Baseline assessments and procedures included physical examination, amyloid organ involvement and standard laboratory values in addition to serum monoclonal (M)-protein, free light chains, N-terminal pro b-type natriuretic peptide (NT-proBNP) and cardiac troponin T (cTNT)/ high-sensitive (hs)TNT analyses. Organ involvement was uniformly assessed according to the consensus criteria agreed on by the three centers involved.3 The collection of patient samples and associated clinical information was approved by the relevant ethical review boards in accordance with the tenets of the Declaration of Helsinki.
Table 1.
Number of AL amyloidosis and multiple myeloma patients according to clinical profiles.

Analysis of the GWAS data was performed using imputed data as described.2 Single-nucleotide polymorphisms (SNPs) possessing a minor allele frequency (MAF) of <1% were excluded. Associations based on imputed SNPs alone were not considered. The association test between SNPs and AL amyloidosis was performed in SNPTEST v2.5. The three data sets were combined in meta-analysis and heterogeneity was assessed by the I2 statistic (interpreted as low <0.25, moderate 0.50 and high >0.75). For genome-wide significance, a limit of P<5×10⁻⁸ was used. Details of the bioinformatic analyses can be found in the study conducted by da Silva Filho et al.2 and in the Online Supplementary Material. Z-scores were calculated for SNPs as log odds ratio (OR) divided by standard error.4 Long-range promoter contacts were probed by high-resolution capture Hi-C in GM12878 cells.5
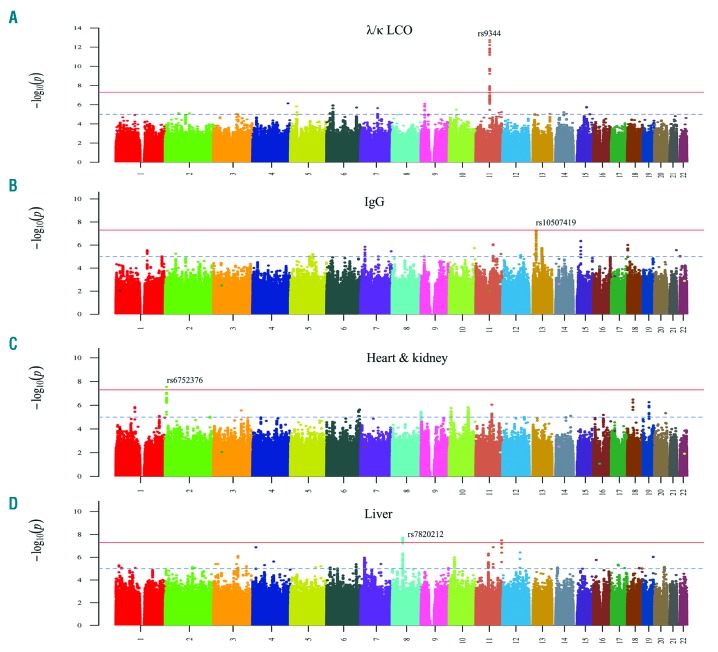
We selected nine clinical profiles for a specific analysis of GWAS data (Table 1). We carried out a systematic association analysis of each of the clinical profiles against controls in each of the three cohorts. Manhattan plots are shown for joint analysis in four clinical profiles with genome-wide significant associations (Figure 1).
Figure 1.
Manhattan plots of association analysis for AL amyloidosis clinical profiles with genome-wide significant results. (A) λ/κ LCO profile; (B) IgG profile; C) heart + kidney profile; D) liver profile. The x-axis shows the chromosomal position and the y-axis is the significance (−log10 P; 2-tailed) of association derived by logistic regression. The red line shows the genome-wide significance level (5×10⁻⁸) and the blue line shows suggestive significance level (1×10⁻⁵). The significant/top SNPs are labeled. In the liver profile a genome-wide significant association, based on imputed SNPs, was noted in chromosome 11 but it had a MAF of 1%; thus few individuals had the variant allele and the association was considered no further. Ig; immunoglobulin; LCO: light chain only.
Among Ig profiles, the λ/κ LCO and the λ LCO profiles showed a strong association with SNP rs9344 (Figure 1A, Online Supplementary Table S1). The OR for rs9344 in the λ/κ LCO profile was 1.62 (P=1.99×10⁻¹²), and in the λ LCO profile the OR was 1.70 (P=1.29×10⁻¹¹). The weakest association was noted for the IgG profile (OR=1.20, P=9.69×10⁻³), with non-overlapping 95% confidence intervals (CIs) to the LCO profiles. For the IgG profile, rs10507419 reached genome-wide significance with an OR of 1.49 and P-value of 5.63×10⁻⁸ (Figure 1B). The two isotypes, IgG λ and IgG κ, showed similar ORs (1.57 and 1.51, respectively), while IgG λ reached the genome-wide significance of 2.90×10⁻⁸ (Online Supplementary Table S2). The ORs of profiles λ/κ LCO (0.90), λ LCO (0.91), liver (0.98) and κ any (1.00) differed significantly (non-overlapping 95% CIs) from the IgG profile. Genome-wide significant association was found for SNP rs6752376 in the heart + kidney profile (OR 1.54, P=2.88×10⁻⁸) (Figure 1C, Online Supplementary Table S3). The liver profile rs7820212 reached genome-wide significance even with a small patient number (n=194) (OR 1.86, P=1.86×10⁻⁸) (Figure 1D, Online Supplementary Table S4).
Z-scores are plotted for the four SNPs in the nine clinical profiles (including overall AL amyloidosis and MM) in the Online Supplementary Figure S1, which is based on the data expressed in the Online Supplementary Tables S1–S4. Online Supplementary Figure S1 illustrates the high scores of the lead SNPs, and exemplifies the dichotomy for rs9344 and rs10507419 in the LCO and IgG profiles.
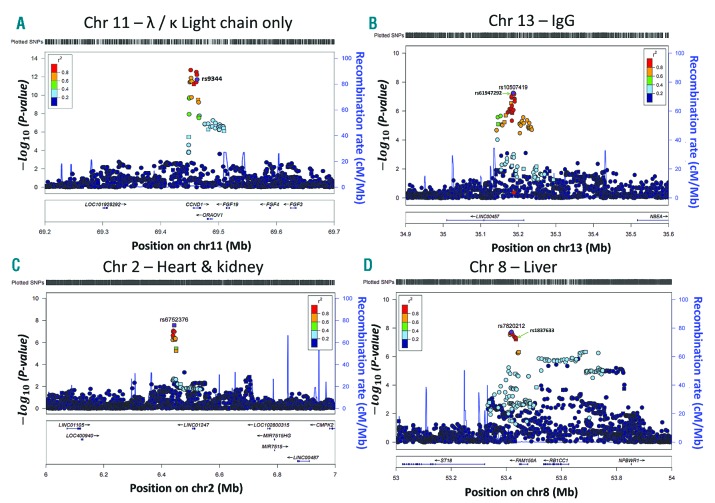
Regional plots of association are shown in Figure 2 for the genome-wide significant SNPs in four clinical profiles. For the λ/κ LCO profile, rs9344 on chromosome 11q13.3 maps to a splice site in the cyclin D1 gene, as demonstrated previously (Figure 2A).2 For the IgG profile, SNP rs10507419 on chromosome 13q13.2 maps within the LINC00457 gene of unknown function and resides 330 kb 5′ of NBEA (Figure 2B). Promoter capture Hi-C data is lacking for rs10507419, however, data are available for the linked SNPs rs9529347 and rs619472921 (r2=1.00), showing interaction within the NBEA gene promoter (Online Supplementary Figure S2). The yellow line links the SNPs with the promoter, P=10−10.
Figure 2.
Regional association plots showing the significant/top SNPs in the four AL amyloidosis clinical profiles. (A) λ/κ LCO profile; (B) IgG profile; C) heart + kidney profile; D) liver profile. The x-axis shows the chromosomal position as Mb and the mapped genes annotated from the University of California, Santa Cruz (UCSC) genome browser. Genomic locations are given in the National Center for Biotechnology Information (NCBI) Build 37/UCSC hg19 coordinates. The y-axis shows the significance (−log10 P; 2-tailed) on the left and recombination rates (light blue lines) on the right. The reference SNP is labeled and colored purple, the rest of the SNPs are colored based on their r2 to the reference SNP, on a shown scale, based on pairwise r2 values from HapMap CEU. Square-shaped SNP symbols represent genotyped SNPs and circle-shaped SNPs represent imputed ones. In B) and D) second SNPs are also marked (rs61947292 and rs1837633, respectively) as these are among the targets of the Hi-C experiments shown in the Online Supplementary Figures S2 and S3. Chr: chromosome. Ig: immunoglobulin.
The heart + kidney profile risk SNP rs6752376 on chromosome 2p25.2 is located between two RNA genes, 63 kb from LINC01247 and 9.9 kb 3′ of ACO17053.1 (data not shown). Liver profile SNP rs7820212 on chromosome 8q11.23 maps 28kb 3′ of FAM150A. Promoter capture Hi-C data are lacking for rs7820212, but data are available for the linked SNP rs1837633 and three other SNPs (r2=0.97–0.99) shown in the Online Supplementary Figure S3. These SNPs interact with the RB1CC1 gene promoter (yellow line, P=10−11).
The recent GWAS on these three AL amyloidosis cohorts reported four SNPs reaching (or almost reaching) a genome-wide significance.2 With the exception of the most significant SNP, rs9344, none of the other three SNPs were specifically associated with the defined nine clinical profiles. Interestingly, three completely new profile-specific genetic loci were identified with homogeneous results from the three cohorts. Independent associations of rs9344 with the two LCO profiles and of rs10507419 with the two IgG profiles showed internal consistency.
The preferential association of rs9344 with LCO profiles could possibly be explained by the known association of this SNP with translocation (11;14), the high prevalence (58% of all cases) of this translocation in AL amyloidosis and the resulting disturbance of IgH production in AL amyloidosis and MM.2,6 However, no light chain excess has been reported in either t(11;14) AL amyloidosis or in t(11;14) MM.7 Curiously, while the LCO profiles were strongly associated with rs9344, the weakest association was noted for the IgG profile. Conversely, rs10507419 was strongly associated with the IgG profiles while weakly opposite associations were found with this SNP and the LCO profiles. This dichotomy was further supported by non-overlapping CIs for five SNPs among the ten promising candidates identified for AL amyloidosis overall in the previous study (data shown in the Online Supplementary Table S1).2 rs10507419 maps close to the NBEA locus (13q13.3) which harbors a fragile site causing deletion of the telomeric end of chromosome 13q in patients with MM, monoclonal gammopathy of undetermined significance (MGUS) and AL-amyloidosis.8 In promoter capture Hi-C data we found that the rs10507419 locus shows long-range association with the NBEA locus. Liver profile SNP rs7820212 on chromosome 8q11.23 maps close to FAM150A, which encodes a ligand for receptor tyrosine kinases, leukocyte tyrosine kinase (LTK) and anaplastic lymphoma kinase (ALK). These belong to the insulin receptor superfamily, and their aberrant activation has been described in many cancers, such as non-small lung cancer and neuroblastoma in which ALK mutations are common.9 Fusion genes of ALK are often found in lymphomas with resulting downstream activation of the Ras/Raf/MEK/ERK pathway.10 rs7820212 is adjacent to the RB1CC1 gene; Hi-C data supported the fact that the rs7820212 locus interacts with the RB1CC1 promoter.11 RB1CC1 has tumor suppressor properties in enhancing RB1 gene expression in cancer cells and promoting senescence.12 The SNP changes the binding motif for CEBPB, which is an important transcription factor regulating the expression of genes involved in immune and inflammatory responses.13
Limitations of the present work include the lack of demonstrated functional data. However, some of the in silico annotations gave promising functional clues, and any functional genetics will be greatly facilitated by the present kind of solid groundwork in patients.
In conclusion, four SNPs reached genome-wide significant associations in clinical profile-specific AL amyloidosis. The associations were different (with the exception of rs9344) and generally stronger than those found for AL amyloidosis in general, even though the sample size in each profile was smaller than those for AL amyloidosis in general.2 This may indicate that these particular profiles are better able to define AL amyloidosis into molecular subtypes which are more amenable to genetic analysis and, possibly, therapeutic interventions. Particularly striking were the distinct non-overlapping genetic associations for the LCO and IgG isotypes. The pathophysiologic basis of progression of MGUS into either MM or AL amyloidosis has remained enigmatic, but the emerging understanding of the genetic architecture of the three plasma cell dyscrasias may start to provide answers to the puzzle.14,15
Supplementary Material
Acknowledgments
This study made use of genotyping data on the 1958 Birth Cohort generated by the Wellcome Trust Sanger Institute
Footnotes
Funding: the German Cancer Aid, the Harald Huppert Foundation, The German Federal Ministry of Education and Research (eMed, Cliommics 01ZX1309B), the Multiple Myeloma Research Foundation, the Heinz Nixdorf Foundation (Germany), the Ministerium für Innovation, Wissenschaft und Forschung des Landes Nordrhein-Westfalen and the Faculty of Medicine University Duisburg-
Information on authorship, contributions, and financial & other disclosures was provided by the authors and is available with the online version of this article at www.haematologica.org.
References
- 1.Merlini G, Seldin DC, Gertz MA. Amyloidosis: pathogenesis and new therapeutic options. J Clin Oncol. 2011;29(14):1924–1933. [DOI] [PMC free article] [PubMed] [Google Scholar]
- 2.da Silva Filho MI, Försti A, Weinhold N, et al. Genome-wide association study of immunoglobulin light chain amyloidosis in three patient cohorts: comparison to myeloma. Leukemia. 2017 Jan;:13. doi: 10.1038/leu.2016.387. Epub ahead of print. [DOI] [PubMed] [Google Scholar]
- 3.Gertz MA, Comenzo R, Falk RH, et al. Definition of organ involvement and treatment response in immunoglobulin light chain amyloidosis (AL): a consensus opinion from the 10th International Symposium on Amyloid and Amyloidosis, Tours, France, 18–22 April 2004. Am J Hematol. 2005;79(4):319–328. [DOI] [PubMed] [Google Scholar]
- 4.Li YR, Li J, Zhao SD, et al. Meta-analysis of shared genetic architecture across ten pediatric autoimmune diseases. Nat Med. 2015;21(9):1018–1027. [DOI] [PMC free article] [PubMed] [Google Scholar]
- 5.Mifsud B, Tavares-Cadete F, Young AN, et al. Mapping long-range promoter contacts in human cells with high-resolution capture Hi-C. Nat Genet. 2015;47(6):598–606. [DOI] [PubMed] [Google Scholar]
- 6.Kumar S, Zhang L, Dispenzieri A, et al. Relationship between elevated immunoglobulin free light chain and the presence of IgH translocations in multiple myeloma. Leukemia. 2010;24(8):1498–1505. [DOI] [PMC free article] [PubMed] [Google Scholar]
- 7.Bochtler T, Hegenbart U, Cremer FW, et al. Evaluation of the cytogenetic aberration pattern in amyloid light chain amyloidosis as compared with monoclonal gammopathy of undetermined significance reveals common pathways of karyotypic instability. Blood. 2008;111(9):4700–4705. [DOI] [PubMed] [Google Scholar]
- 8.Bochtler T, Hegenbart U, Kunz C, et al. Prognostic impact of cytogenetic aberrations in AL amyloidosis patients after high-dose melphalan: a long-term follow-up study. Blood. 2016;128(4):594–602. [DOI] [PubMed] [Google Scholar]
- 9.Guan J, Umapathy G, Yamazaki Y, et al. FAM150A and FAM150B are activating ligands for anaplastic lymphoma kinase. Elife. 2015;4:e09811. [DOI] [PMC free article] [PubMed] [Google Scholar]
- 10.Roskoski R., Jr Anaplastic lymphoma kinase (ALK): structure, oncogenic activation, and pharmacological inhibition. Pharmacological Res. 2013;68(1):68–94. [DOI] [PubMed] [Google Scholar]
- 11.Lebovitz CB, Robertson AG, Goya R, et al. Cross-cancer profiling of molecular alterations within the human autophagy interaction network. Autophagy. 2015;11(9):1668–1687. [DOI] [PMC free article] [PubMed] [Google Scholar]
- 12.Suraneni MV, Moore JR, Zhang D, et al. Tumor-suppressive functions of 15-Lipoxygenase-2 and RB1CC1 in prostate cancer. Cell Cycle. 2014;13(11):1798–1810. [DOI] [PMC free article] [PubMed] [Google Scholar]
- 13.Tucci M, Stucci S, Savonarola A, et al. Immature dendritic cells in multiple myeloma are prone to osteoclast-like differentiation through interleukin-17A stimulation. Br J Haematol. 2013;161(6):821–831. [DOI] [PubMed] [Google Scholar]
- 14.Mitchell JS, Li N, Weinhold N, et al. Genome-wide association study identifies multiple susceptibility loci for multiple myeloma. Nature Commun. 2016;7:12050. [DOI] [PMC free article] [PubMed] [Google Scholar]
- 15.Thomsen H, Campo C, Weinhold N, et al. Genome-wide association study on monoclonal gammopathy of unknown significance (MGUS). Eur J Haematol. 2017;99(1):70–79. [DOI] [PubMed] [Google Scholar]
Associated Data
This section collects any data citations, data availability statements, or supplementary materials included in this article.


