

Abstract
Background
Studies evaluating the impact of the neighborhood food environment on obesity have summarized the density or proximity of individual food outlets. Though informative, there is a need to consider the role of the entire food environment; however, few measures of whole system attributes have been developed. New variables measuring the food environment were derived and used to study the association with body mass index (BMI).
Methods
Individual data on BMI and socio-demographic characteristics was collected from 48,482 respondents of the 2002–2006 community health survey in New York City and linked to residential zip code level characteristics. The food environment of each zip code was described in terms of the diversity of outlets (number of types of outlets present in a zip code), the density of outlets (outlets per Km2) and the proportion of outlets classified as BMI-unhealthy (e.g. fast food, bodegas).
Results
Results of the cross-sectional, multi-level analyses revealed an inverse association between BMI and food outlet density (−0.32 BMI units across the inter-quartile range (IQR), 95% CI −0.45, −0.20), a positive association between BMI and the proportion of BMI-unhealthy food outlets (0.26 BMI units per IQR, 95% CI 0.09, 0.43) and no association with outlet diversity. The association between BMI and the proportion of BMI-unhealthy food outlets was stronger in lower (< median for % poverty) poverty zip codes than in high poverty zip codes.
Conclusions
These results support a more nuanced assessment of the impact of the food environment and its association with obesity.
Keywords: neighborhood, BMI, obesity, food, walkability
INTRODUCTION
Despite some evidence to suggest a slight decline in obesity prevalence among certain age groups, obesity continues to be a serious public health concern [1, 2]. To date, many prevention efforts have focused on increasing physical activity and improving access to healthy food [3–7]. The latter attempt remains a challenge as researchers and policy-makers emphasize the need to understand how the neighborhood food environment influences a person’s access to and consumption of healthy food.
Most efforts to evaluate the neighborhood food environment and its association with obesity have summarized the density or proximity of individual types of stores, such as supermarkets, convenience stores, grocery stores, and fast food restaurants. Evidence suggests an inverse association of obesity and the presence of supermarkets [8–11]. In contrast, a positive association of obesity with convenience stores or smaller grocery stores was observed [8, 9, 12–14]. There is less evidence of an association between proximity to fast food establishments and the risk of obesity and type of diet [12, 14–18].
The inconsistency of findings in the association between access to retail food establishments and obesity may result from methodological differences between studies, particularly from differences in food environment measures. Restricting analyses to a single type of food outlets prevents assessment of the broader food environment and all of the available choices to residents. An individual’s decision to frequent a supermarket or convenience store may be determined by not only personal choice but by the availability (density) and diversity of all food stores in the neighborhood. Rundle, et al. conducted initial work in this area by categorizing food establishments into healthy, unhealthy, and intermediate with respect to body mass index (BMI) and observed an inverse association between BMI and the density of BMI-healthy outlets [19]. They did not consider the potential diversity of healthy (or unhealthy) food stores that consumers face when making decisions to purchase food in their neighborhood. Recently, studies conducted in Australia used a similar healthy and unhealthy food store classification scheme to predict fruit and vegetable and fast food purchasing and observed evidence suggesting a greater proportion of health food options in a neighborhood influence healthy and unhealthy food purchasing. [20, 21]. Given evidence that choice influences consumer behavior, studying both the diversity and density of options will inform research on the food environment’s influence on obesity [22, 23].
The purpose of this study was to evaluate the association between individuals’ BMI and the food environments of their neighborhoods. We used previously developed food environment measures that reflect the expected health benefits of food outlets (BMI-healthy, -unhealthy and –intermediate), and new measures were developed to reflect the density of retail outlets and the diversity of available retail food outlets. Because previous work found that neighborhood poverty modifies the association between built environment characteristics and obesity risk, the analyses were stratified by neighborhood poverty status [24].
METHODS
Data
The data for these analyses come from the NYC Community Health Survey (CHS), a random-digit dial telephone survey conducted annually by the NYC Department of Health and Mental Hygiene (DOHMH) [25]. This cross-sectional survey samples non-institutionalized adults aged 18 years and older to monitor a range of health topics. For this analysis, self-reported zip codes among CHS participants from five consecutive years of data (2002–2006) were linked with geospatial data describing the socio-demographic and built environment features of the zip codes. Self-reported height and weight were recorded each year of the survey and converted to BMI. A description of the sampling design used for the CHS has been reported elsewhere [26].
Outcome
The outcome of interest is BMI which is a commonly used measure by the CDC to classify adult weight. BMI was calculated by weight in pounds divided by height in inches squared multiplied by a factor of 703 (to convert pound/in2 to kg/m2). With few guidelines established that provide specific criteria for valid, biologically plausible BMI values, a two-step process, based on a previous analysis of anthropometric data by the DOHMH using observed plausible ranges of gender-specific height and weight and BMI from the 1999–2006 National Health and Nutrition Examination Survey, was used to eliminate implausible values from analysis [27, 28]. The ranges used were as follows: male height: 51.3–80.5 inches, male weight: 85.6–480.9 pounds; female height: 51.8–73.5 inches, female weight: 74.1–570.9 pounds. First, prior to BMI calculation, heights and weights were compared to the pre-determined ranges; subjects with values outside the ranges were eliminated from analysis. Next, subjects with a calculated BMI outside of the valid range were eliminated from analysis (male: 14.9–65.0; female: 13.4–76.1).
Food Environment
As in previous work, the zip code-level food environment measures were derived using the Dun and Bradstreet commercial vendor list for 2005 [19, 29, 30]. These data include detailed information on business name, geocoded location and standard industrial classifications (SIC). Food outlets were categorized into 15 different types of retail food business primarily through the identification of SIC codes and annual sales data for grocery stores: supermarkets, fruit and vegetable markets, natural food stores, local fast food restaurants, national fast food restaurants, pizza restaurants, convenience stores, bodegas, bakeries, candy and nut stores, meat markets, non-fast food restaurants, grocery stores, fish markets, and specialty food stores as described previously [19]. These 15 types of outlets were then classified a priori as BMI-healthy (supermarkets, fruit and vegetable markets, natural food stores), BMI-unhealthy (local and national fast food restaurants, pizza restaurants, convenience stores, bodegas, bakeries, candy and nut stores, meat markets) and BMI-intermediate (non-fast food restaurants, grocery stores, fish markets, and specialty food stores) based on available evidence linking their association to energy intake and the quality of food sold [19, 31, 32].
To describe the retail food ecology in each zip code a series of additional food environment measures were also derived. The density of food outlets, measured as the number of food outlets in each zip code divided by the zip code total land area (km2), was calculated. The relative concentration of each of the three retail food outlet groups described was calculated as the proportion of retail food outlets that were BMI-healthy, BMI-unhealthy, and BMI-intermediate food outlets. The diversity of the retail food environment in each zip code was also described using a scale that indicated how many of the 15 different types of food outlets were represented in the zip code by the presence of at least one outlet from that type. The hypothetical range of the diversity measure is zero, indicating the zip code does not have at least one of the 15 different types of food outlets, up to 15, indicating that the zip code has at least one retail outlet from each of the 15 types described above. For example, a zip code with 2 bodegas and 1 meat market but void of the other 13 types of food outlets would score a two on the diversity scale (1 for having at least one bodega and one for having at least one meat market and 0 for the remaining 13 food outlets).
Built Environment
Additional zip code-specific measures were derived from the 2000 US Census, including the proportion of the population whose ratio of income to poverty level is 100% below the federal poverty line, and the proportion of the population who are African American [33]. These Census variables were included in the model to control for potential confounding by zip code-level socio-demographic characteristics operating above and beyond individual level socio-demographic characteristics [34, 35]. The walkability index was derived from data measuring multiple built environment characteristics hypothesized to promote walking including density of residential units, density of intersections, land use mix, retail floor space and density of subway stations. A more detailed account walkability including sources of data to derive the index can be found elsewhere [36].
Statistical Analysis
Demographic characteristics for the entire sample and stratified by median zip code poverty status were tabulated using percentages for discrete variables except for BMI, a continuous variable, for which mean and standard deviation were used. Pearson correlation coefficients were used to estimate the correlation among food environment variables. To predict BMI, a linear mixed effects model which included a random effect for zip code was used to account for clustering of BMI within each zip code. All models were adjusted for individual demographic characteristics: gender, age, race, ethnicity, education, income to poverty ratio, nativity, marital status, self-reported health, and employment. Zip code variables included in the mode were the proportion of residents living in poverty, the proportion of residents that were African American, and walkability. To improve comparability, all zip code variables including the food environment variables were re-scaled by subtracting the median of that variable from each value and then dividing by the interquartile range (IQR) of that variable. As a result each beta coefficient reflect the association with BMI for the difference in the 75th percentile to the 25th percentile of that variable’s range. To assess the impact of zip code poverty status on the association between the food environment and BMI, the study sample was stratified by median zip code poverty status. Each model accounted for zip code level sampling weights. Coefficients and 95% confidence intervals are presented. In describing zip code level effects, the term neighborhood is used as a proxy. Analyses were performed using HLM version 6.08 (Scientific Software International, Skokie, IL) and Stata version 12 (Stata Corporation, College Station, TX) in 2011.
RESULTS
A total of 48,482 subjects completed the CHS survey from 2002–2006. Of these, 44,578 (92%) subjects had height and weight data available to estimate BMI. Of these, less than 0.01% had an implausible height or weight as determined by the guidelines (N=269). The remaining 7.99% percent had missing height and weight data. After imposing criteria on the calculation of BMI, an additional 27 subjects had a biologically implausible BMI, thus leaving 44,282 subjects available for analysis. Table 1 presents descriptive data for the entire study population and stratified by poverty status.
Table 1.
Demographic characteristics of the study population for the entire sample and stratified by poverty statusa
| Variable | Study Sample (N=44,282) | Low Poverty (N=19,160) | High Poverty (N=25,122) |
|---|---|---|---|
| BMIb | Mean = 26.6, SD = 5.54 | Mean = 26.0, SD = 5.15 | Mean = 27.1, SD = 5.8 |
| Gender | |||
| Male | 41.55% | 44.3% | 39.5% |
| Female | 58.45% | 55.7% | 60.5% |
| Agec | |||
| 18–24 Years | 8.5% | 6.7% | 10.0% |
| 25–44 Years | 40.2% | 37.9% | 41.9% |
| 45–64 Years | 32.5% | 34.2% | 31.2% |
| 65+ Years | 18.8% | 21.3% | 16.9% |
| Race / Ethnicityc | |||
| Non-Hispanic white | 40.8% | 59.7% | 26.4% |
| Non-Hispanic black | 24.9% | 15.9% | 31.8% |
| Non-Hispanic asian | 6.9% | 8.0% | 6.0% |
| Hispanic | 24.7% | 13.9% | 32.9% |
| Other | 2.8% | 2.6% | 2.9% |
| Education | |||
| Less than High School | 16.0% | 8.9% | 21.5% |
| High School Graduate | 25.2% | 22.0% | 27.6% |
| Some College | 22.3% | 22.6% | 22.0% |
| College Graduate | 36.5% | 46.5% | 28.9% |
| Income to Poverty Ratio | |||
| < 100% | 18.0% | 9.9% | 24.1% |
| 100–199% | 19.8% | 14.8% | 23.6% |
| 200–399% | 23.8% | 22.8% | 24.6% |
| 400–599% | 17.0% | 20.7% | 14.2% |
| > 600% | 21.4% | 31.8% | 13.5% |
| Nativity | |||
| U.S.-Born | 64.3% | 68.7% | 61.0% |
| Foreign-Born | 35.7% | 31.3% | 39.0% |
| Marital Status | |||
| Married | 37.2% | 42.7% | 33.0% |
| Not Married | 62.8% | 57.3% | 67.0% |
| Self-Reported Health | |||
| Excellent or Very Good | 45.6% | 47.6% | 40.4% |
| Good, Fair, or Poor | 54.4% | 52.4% | 59.6% |
| Employment | |||
| Employed | 59.4% | 62.2% | 57.2% |
| Not Employed | 40.6% | 37.8% | 42.8% |
Low poverty Zip codes are defined as Zip codes below the median percent (17.1%) of the population that is below poverty in New York City.
Data available for 44,282 subjects.
Subject to rounding error
Of the 38,028 food outlets categorized, 4.6% were labeled BMI-healthy, 43.4% were labeled BMI-unhealthy and 52% were classified as BMI-intermediate. A nearly perfect negative linear association existed between the proportion of BMI-intermediate and BMI-unhealthy food outlets across all neighborhoods (ρ = −0.97) (Table 2). The positive correlation between food outlet density and the proportion of BMI-intermediate food outlets indicates that neighborhoods with greater food outlet density have a greater proportion of BMI-intermediate food outlets. In addition, there was an inverse correlation between food outlet density and the proportion of BMI-unhealthy foods (ρ = −0.51) (Table 2 and Figure 1). Examples of neighborhoods illustrating the inverse correlation between food outlet density and the proportion of BMI-unhealthy foods can be found in the Staten Island borough (Figure 1). The BMI-intermediate and BMI-healthy variable was selected a priori to be removed from further analysis as the paper sought to determine the effects of the proportion of BMI-unhealthy food outlets on BMI.
Table 2.
Correlations of Zip code level food diversity measures, proportion of healthy, unhealthy, and intermediate food outlets and density of food outlets.
| Median, IQRa | Food Diversity | Proportion BMI-Healthy Food Outlets | Proportion BMI-Unhealthy Food Outlets | Proportion BMI-Intermediate Food Outlets | Store Density | |
|---|---|---|---|---|---|---|
| Food Diversity | 14, 2 | 1 | ||||
| Proportion of BMI-Healthy Food Outlets | 0.04, 0.02 | −0.003 | 1 | |||
| Proportion of BMI-Unhealthy Food Outlets | 0.47, 0.13 | 0.05 | −0.04 | 1 | ||
| Proportion of BM-Intermediate Food Outlets | 0.48, 0.12 | −0.05 | −0.18 | −0.97 | 1 | |
| Store Density | 57.9, 80 | 0.32 | −0.20 | −0.51 | 0.54 | 1 |
IQR is the interquartile range
Figure 1. Distribution of food environment measures across New York City Zip codes.

A) The distribution of the proportion of BMI-unhealthy food outlets across New York City zip codes. Increasing color intensity illustrates zip codes with a higher proportion of BMI-unhealthy food outlets. BMI-unhealthy food outlets include: fast food restaurants, pizza restaurants, convenience stores, bodegas, bakeries, candy and nut stores, and meat markets. B) The distribution of food outlet density across New York City zip codes. Increasing color intensity illustrates zip codes with greater density. The food outlet density variable was calculated by summing the stores for each zip code divided by the total land area (km2) for that zip code.
The independent association of BMI and each zip code characteristic was evaluated prior to inclusion in the final models. In bivariate analyses, each zip code variable was statistically significantly associated with BMI and thus included in the final models (data not shown). In multilevel analyses of the associations between BMI and the food environment measures, both food outlet density (negatively) and the proportion of BMI-unhealthy food outlets (positively) were significantly associated with BMI after controlling for individual and neighborhood characteristics (Table 3). A strong and statistically significant positive association was observed between the proportion of BMI-unhealthy food outlets and BMI for the sample living in the low poverty neighborhoods. A similar association was not observed in the high poverty neighborhoods. Increasing food outlet density was statistically significantly associated with a lower BMI independent of neighborhood poverty status (Table 3 and Figure 2).
Table 3.
Association between Body Mass Index and Zip code level characteristics of the food environmenta for the study sample and stratified by poverty statusb (Estimate (95% CI)).
| Neighborhood Characteristic d | Total Study Sample (N=37,584)c | Low Povertyb (N=16,351)c | High Povertyb (N=21,233)c |
|---|---|---|---|
| Proportion Poverty | 0.270 (0.084, 0.457)** | 0.060 (−0.576, 0.697) | 0.371 (0.058, 0.685)* |
| Proportion African American | 0.115 (−0.002, 0.233) | 0.261 (0.092, 0.431)** | 0.031 (−0.135, 0.197) |
| Neighborhood Walkability Index | 0.029 (−0.113, 0.171) | 0.007 (−0.190, 0.204) | 0.006 (−0.224, 0.237) |
| Food Diversity | −0.071 (−0.172, 0.030) | −0.079 (−0.226, 0.068) | −0.054 (−0.203, 0.094) |
| Proportion of BMI-unhealthy Food Outlets | 0.261 (0.093, 0.429)** | 0.507 (0.284, 0.731)*** | −0.024 (−0.288, 0.239) |
| Store Density | −0.324 (−0.446, −0.202)*** | −0.273 (−0.444, −0.102)** | −0.305 (−0.496, −0.113)** |
All models adjust for gender, age, race/ethnicity, income to poverty ratio, nativity, marital status, self-reported health, and employment and the beta coefficients presented in the table are mutually adjusted for the other variables listed in the table.
Low poverty Zip codes are defined as Zip codes below the median percent of the population that is below poverty in New York City (Median=17.1%).
Number of individual level-1 units available for analysis after accounting for missing data from individual level covariates.
Beta coefficient estimated for a difference equivalent to a 1 IQR change
p<0.05,
p<0.01,
P<0.001
Figure 2. Adjusted association between body mass index and food environment measures.
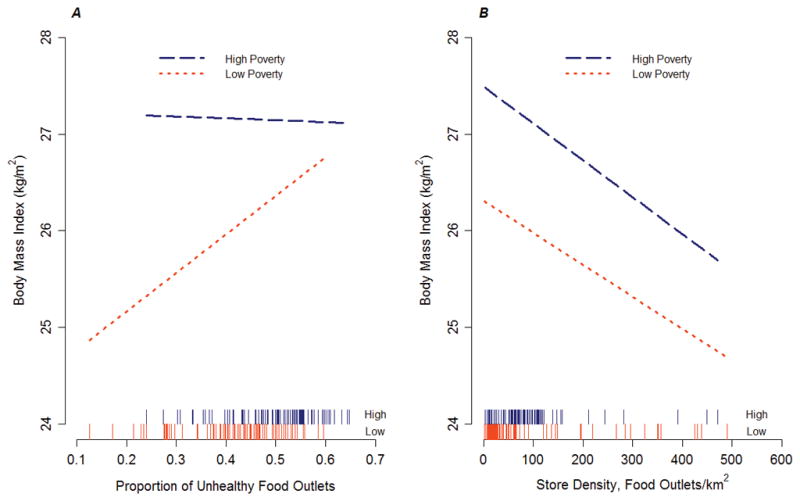
The model in each panel adjusted for individual characteristics and the percentage of neighborhood residents who were African American, the percentage who were below the federal poverty line, neighborhood walkability, the proportion of commercially-zoned land use, diversity of food outlets, and the density of food outlets (A) or the proportion of BMI-unhealthy food outlets (B). The starting and ending points of each line represents observed values of the independent variable. Each line on the x-axis represents a zip code-specific value for the predictor variable (proportion of BMI-unhealthy food outlets and food outlet density). A) Adjusted association between body mass index and the proportion of BMI-unhealthy food outlets stratified by the median percentage of area residents whose income is below the federal poverty line. B) Adjusted association between body mass index and the density of food outlets stratified by the median percentage of area residents whose income is below the federal poverty line.
The rug plots in figure 2 illustrate the distribution of predictor variables stratified by low and high poverty. Each line on the x-axis of figure 2 represents a zip code-specific value for the predictor variable. As shown in figure 2A, fast food density is concentrated in high poverty neighborhoods consistent with previous research[37].
DISCUSSION
The results from this study demonstrate the value of measuring the association of BMI with multiple measures of the food environment specifically the importance of including all types of food stores in addition to presence and accessibility. These results indicate that the proportion of food outlets classified as BMI-unhealthy in a zip code was associated with a higher BMI in low poverty neighborhoods. In addition, BMI was negatively associated with the density of food outlets, a finding that was seen in both higher and lower income zip codes.
Studies of associations between unhealthy food options such as fast food establishments and either obesity risk or diet quality have provided inconclusive results despite considerable attention [3, 10, 14, 17]. The results presented here support a more nuanced interpretation. In this study, the proportion of retail food outlets that were classified as BMI-unhealthy in high poverty neighborhoods was not associated with higher BMI. However, there is a gradient within the high poverty neighborhoods. Increasing neighborhood poverty within the high poverty group results in a higher BMI suggesting that living in very high poverty neighborhoods outweighs any effect of the number of BMI-unhealthy food outlets available. This is in contrast to the significant positive association observed among low poverty neighborhoods which is consistent with reports illustrating positive associations of BMI and individual food outlets such labeled as fast food, convenience store, or grocery store and a higher BMI value in areas with increasing availability of BMI-unhealthy outlets [8, 9, 16, 32]. Previous research has demonstrated similar attenuated associations observed in economically disadvantaged communities which may be partly explained by the presence of multiple problems in these neighborhoods, residential self-selection bias and the possibility of a saturation effect of the BMI-unhealthy food outlet category [38, 39].
Independent of neighborhood income, increasing food outlet density was associated with lower BMI. Zick et el. reported similar findings suggesting both high and low income neighborhoods with multiple food options had a lower risk of obesity [40]. As an explanation for this finding, Zick et al., proposed that the presence of multiple food options correspond to a higher concentration of walkable destinations and that such neighborhoods had more food options expected to be BMI-intermediate [40, 41]. Many of the food outlet types in the BMI-intermediate category consist of non-fast food restaurants such as ethnic restaurants and there is some evidence from studies of adolescents to suggest that use of non-fast food restaurants predicts increased vegetable intake [42]. Furthermore, increasing competition among food establishments in high food outlet density areas may lower prices for healthy food options within all food outlet groups which may lead to affordable prices and potentially greater consumption of healthy foods. Or consumers, when presented with a variety, might anchor decisions differently based on weighing available options [20–23].
A previous study by Black et al. evaluated both protective and potentially harmful neighborhood elements on obesity within NYC [11]. The authors observed higher risk of obesity in neighborhoods with fewer supermarkets and fitness facilities and with lower neighborhood income. Interestingly, a neighborhood amenities score consisting of availability of supermarkets, restaurants, fast food outlets, beverage and snack stores, fitness facilities, and commercial land use showed a significant negative association with obesity. Though our results did not include physical fitness as a covariate in the analysis, they support the possibility that neighborhood investment and characteristics of the aggregated food ecology drive risk of obesity.
Two previous analyses using the same food outlet classifications in NYC did not observe associations between BMI or obesity and access to BMI-unhealthy food outlets [19, 31]. In contrast to this report which did not observe an independent association of BMI and BMI-healthy outlets, both studies did observe significant inverse associations between BMI or obesity and higher density of BMI-healthy stores. The differences in findings between these prior studies and the present work might result from differences in the level of aggregation used in the analyses. One of the prior studies had access to exact address data for the study subject’s and measured the food environment within ½ mile of the residence [19], while the other used census tract of residence [31]. In contrast, the current work used the residential zip code, which is a substantially larger area. The modifiable areal unit problem (MAUP), the observation of different associations across different spatial units of aggregation, is an issue in comparing results across studies that used different spatial scales of analysis [43, 44]. These studies suggest that as the geographic unit increases a threshold may be reached by which BMI-unhealthy food establishments have a greater influence on food choice.
This study has several limitations. First, the cross-sectional design limits our ability to make causal inferences about these relationships. Moreover, it is difficult to discern the impact of self-selection bias. Neighborhoods with a higher food outlet density may attract individuals with a healthful lifestyle and a lower BMI. Alternatively, investment may occur in areas where businesses believe healthier individuals live. Without knowledge of the temporal changes in retail investment and BMI patterns, it’s not possible to correct this bias here. However, residential choice in NYC is constrained by economic resources and the adjustments for individual- and zip code-level socioeconomic status represent, in part, an effort to adjust for selection. In addition, misclassification of food outlets into the BMI-healthy, BMI-unhealthy and BMI-intermediate categories could bias the results. In addition, the broad classifications given to each store type may not accurately reflect the internal heterogeneity of food options. For example, bodegas, classified as BMI-unhealthy, may provide both healthy and unhealthy options; and as a result, bias the coefficients. Similarly, supermarkets, classified as BMI-healthy, are also sources of energy-dense, nutrient poor food options and the purchase of such foods would result in misclassification of the exposure and also bias the coefficients towards the null [45]. Future research should consider heterogeneity of food choices within stores in addition to classification schemes. Also, these data only consider the home neighborhood food environment of each resident completing the CHS survey. Residents may consume meals and snacks near their workplace or traveling throughout the city and this phenomena among adolescents and the local food environment around schools has been reported [46]. Failure to take account of the food environment away from home introduces measurement error.
In summary, consideration of multiple food environment measures provides a new approach to evaluating the effects of the retail food environment on BMI. While this analysis focused on New York City which has a dense and diverse network of restaurants, urban environments with comparable low income neighborhoods and store penetration may observe similar associations with BMI. In developing new properties, urban designed should consider including significant retail space to increase the density of healthier food options.
WHAT IS ALREADY KNOWN ON THIS SUBJECT
Numerous studies have reported on the association between body mass index or obesity and food stores such as supermarkets, convenience stores, and fast food restaurants.
Inconsistent findings across studies may be a result of methodological differences in the food environmental measures used.
WHAT THIS STUDY ADDS
This study develops new measures to describe the food environment and tests the association with body mass index among adults in an urban environment.
The proportion of unhealthy food stores is positively associated with body mass index.
Increasing density of food stores lowers body mass index in both high income and low income neighborhoods.
Researchers and policy makers should be mindful of the collective food environment when trying to understand obesity risk among different populations.
Acknowledgments
FUNDING
This work was supported by grants from the National Institutes of Health (Grant numbers 5R01DK079885-02 and P60-MD0005-03).
Footnotes
James Stark, Kathryn Neckerman, Gina Lovasi, Kevin Konty, James Quinn, Peter Arno, Deborah Viola, Tiffany Harris, Christopher Weiss, and Michael Bader do not declare any competing interests.
Andrew Rundle has received consulting fees from EHE International, a company that provides physical exams and wellness programs to corporations.
COMPETING INTERESTS
Andrew Rundle has received consulting fees from EHE International, a company that provides physical exams and wellness programs to corporations. There are no other competing interests to declare.
References
- 1.Pan L, Blanck HM, Sherry B, et al. Trends in the prevalence of extreme obesity among US preschool-aged children living in low-income families, 1998–2010. JAMA. 308:2563–5. doi: 10.1001/jama.2012.108099. [DOI] [PMC free article] [PubMed] [Google Scholar]
- 2.Center for Disease Control and Prevention. Obesity in K-8 Students - New York City, 2006–07 to 2010–11 School Years. Morbidity and Mortality Weekly Report. 2011;60:1673–8. [PubMed] [Google Scholar]
- 3.U.S. Department of Health and Human Services. The Surgeon General’s Vision for a Healthy and Fit Nation. Vol. 2010. Rockville, MD: U.S. Department of Health and Human Services, Office of the Surgeon General; Jan, 2010. [PubMed] [Google Scholar]
- 4.Centers for Disease Control and Prevention. Recommended community strategies and measurements to prevent obesity in the United States. MMWR. 2009:58. [PubMed] [Google Scholar]
- 5.White House Task Force on Childhood Obesity Report to the President. Solving the problem of childhood obesity within a generation. 2010. [DOI] [PubMed] [Google Scholar]
- 6.New York City Government. Food Retail Expansion to Support Healty (FRESH) 2010. [Google Scholar]
- 7.New York City Department of Health and Mental Hygiene. Healthy Bodegas Initiative. 2010. [Google Scholar]
- 8.Morland KB, Evenson KR. Obesity prevalence and the local food environment. Health & Place. 2009;15:491–5. doi: 10.1016/j.healthplace.2008.09.004. [DOI] [PMC free article] [PubMed] [Google Scholar]
- 9.Morland K, Diez Roux AV, Wing S. Supermarkets, other food stores, and obesity: The Atherosclerosis Risk in Communities Study. American Journal of Preventive Medicine. 2006;30:333–9. doi: 10.1016/j.amepre.2005.11.003. [DOI] [PubMed] [Google Scholar]
- 10.Powell LM, Auld MC, Chaloupka FJ, et al. Associations Between Access to Food Stores and Adolescent Body Mass Index. American Journal of Preventive Medicine. 2007;33:S301–S7. doi: 10.1016/j.amepre.2007.07.007. [DOI] [PubMed] [Google Scholar]
- 11.Black JL, Macinko J, Dixon LB, et al. Neighborhoods and obesity in New York City. Health Place. 2010;16:489–99. doi: 10.1016/j.healthplace.2009.12.007. [DOI] [PubMed] [Google Scholar]
- 12.He M, Tucker P, Irwin JD, et al. Obesogenic neighbourhoods: the impact of neighbourhood restaurants and convenience stores on adolescents’ food consumption behaviours. Public Health Nutr. 2012:1–9. doi: 10.1017/S1368980012000584. [DOI] [PMC free article] [PubMed] [Google Scholar]
- 13.Laska MN, Hearst MO, Forsyth A, et al. Neighbourhood food environments: are they associated with adolescent dietary intake, food purchases and weight status? Public Health Nutr. 2010;13:1757–63. doi: 10.1017/S1368980010001564. [DOI] [PMC free article] [PubMed] [Google Scholar]
- 14.Lee H. The role of local food availability in explaining obesity risk among young school-aged children. Social Science & Medicine. 2012;74:1193–203. doi: 10.1016/j.socscimed.2011.12.036. [DOI] [PubMed] [Google Scholar]
- 15.Fleischhacker SE, Evenson KR, Rodriguez DA, et al. A systematic review of fast food access studies. Obesity Reviews. 2011;12:e460–e71. doi: 10.1111/j.1467-789X.2010.00715.x. [DOI] [PubMed] [Google Scholar]
- 16.Mehta NK, Chang VW. Weight Status and Restaurant Availability: A Multilevel Analysis. American Journal of Preventive Medicine. 2008;34:127–33. doi: 10.1016/j.amepre.2007.09.031. [DOI] [PMC free article] [PubMed] [Google Scholar]
- 17.An R, Sturm R. School and Residential Neighborhood Food Environment and Diet Among California Youth. American journal of preventive medicine. 2012;42:129–35. doi: 10.1016/j.amepre.2011.10.012. [DOI] [PMC free article] [PubMed] [Google Scholar]
- 18.Lopez RP. Neighborhood Risk Factors for Obesity. Obesity. 2007;15:2111–9. doi: 10.1038/oby.2007.251. [DOI] [PubMed] [Google Scholar]
- 19.Rundle A, Neckerman KM, Freeman L, et al. Neighborhood food environment and walkability predict obesity in New York City. Environ Health Perspect. 2009;117:442–7. doi: 10.1289/ehp.11590. [DOI] [PMC free article] [PubMed] [Google Scholar]
- 20.Mason KE, Bentley RJ, Kavanagh AM. Fruit and vegetable purchasing and the relative density of healthy and unhealthy food stores: evidence from an Australian multilevel study. J Epidemiol Community Health. 67:231–6. doi: 10.1136/jech-2012-201535. [DOI] [PubMed] [Google Scholar]
- 21.Thornton LE, Kavanagh AM. Association between fast food purchasing and the local food environment. Nutrition and Diabetes. 2012;2:e53. doi: 10.1038/nutd.2012.27. [DOI] [PMC free article] [PubMed] [Google Scholar]
- 22.Kahn B, Wansink B. The Influence of Assortment Structure on Perceived Variety and Consumption Quantities. Journal of Consumer Research. 2004;30:519–33. [Google Scholar]
- 23.Hoch S, Bradlow E, Wansink B. The Variety of an Assortment. Marketing Science. 1999;18:527–46. [Google Scholar]
- 24.Lovasi GS, Neckerman KM, Quinn JW, et al. Effect of individual or neighborhood disadvantage on the association between neighborhood walkability and body mass index. American Journal of Public Health. 2009;99:279–84. doi: 10.2105/AJPH.2008.138230. [DOI] [PMC free article] [PubMed] [Google Scholar]
- 25.New York City Department of Health and Mental Hygiene. Community Health Survey: Methodology. 2009. [Google Scholar]
- 26.Freeman L, Neckerman K, Schwarz-Soicher O, et al. Neighborhood Walkability and Active Travel (Walking and Cycling) in New York City. Journal of Urban Health. doi: 10.1007/s11524-012-9758-7. In press. [DOI] [PMC free article] [PubMed] [Google Scholar]
- 27.de Onis M, Habicht JP. Anthropometric reference data for international use: recommendations from a World Health Organization Expert Committee. Am J Clin Nutr. 1996;64:650–8. doi: 10.1093/ajcn/64.4.650. [DOI] [PubMed] [Google Scholar]
- 28.Physical status: the use and interpretation of anthropometry. Report of a WHO Expert Committee. World Health Organization Techincal Report Series. 1995;854:1–452. [PubMed] [Google Scholar]
- 29.Neckerman KM, Bader MDM, Richards CA, et al. Disparities in the Food Environments of New York City Public Schools. American Journal of Preventive Medicine. 2010;39:195–202. doi: 10.1016/j.amepre.2010.05.004. [DOI] [PubMed] [Google Scholar]
- 30.Park Y, Quinn J, Florez K, et al. Hispanic immigrant women’s perspective on healthy foods and the New York City retail food environment: A mixed-method study. Soc Sci Med. 73:13–21. doi: 10.1016/j.socscimed.2011.04.012. [DOI] [PMC free article] [PubMed] [Google Scholar]
- 31.Janevic T, Borrell LN, Savitz DA, et al. Neighbourhood food environment and gestational diabetes in New York City. Paediatric Pernatal Epidemiology. 2010;24:249–54. doi: 10.1111/j.1365-3016.2010.01107.x. [DOI] [PMC free article] [PubMed] [Google Scholar]
- 32.Jennings A, Welch A, Jones AP, et al. Local Food Outlets, Weight Status, and Dietary Intake: Associations in Children Aged 9–10 Years. American Journal of Preventive Medicine. 2011;40:405–10. doi: 10.1016/j.amepre.2010.12.014. [DOI] [PMC free article] [PubMed] [Google Scholar]
- 33.U.S. Census Bureau. Census Summary File 3. 2000. [Google Scholar]
- 34.Rundle A, Field S, Park Y, et al. Personal and neighborhood socioeconomic status and indices of neighborhood walkability predict body mass index in New York City. Social Science and Medicine. 2008;67:1951–8. doi: 10.1016/j.socscimed.2008.09.036. [DOI] [PMC free article] [PubMed] [Google Scholar]
- 35.Krieger N, Williams DR, Moss NE. Measuring social class in US public health research: concepts, methodologies, and guidelines. Annu Rev Public Health. 1997;18:341–78. doi: 10.1146/annurev.publhealth.18.1.341. [DOI] [PubMed] [Google Scholar]
- 36.Neckerman KM, Lovasi GS, Davies S, et al. Disparities in urban neighborhood conditions: evidence from GIS measures and field observation in New York City. J Public Health Policy. 2009;30(Suppl 1):S264–85. doi: 10.1057/jphp.2008.47. [DOI] [PubMed] [Google Scholar]
- 37.Larson NI, Story MT, Nelson MC. Neighborhood Environments: Disparities in Access to Healthy Foods in the U.S. American Journal of Preventive Medicine. 2009;36:74–81. doi: 10.1016/j.amepre.2008.09.025. [DOI] [PubMed] [Google Scholar]
- 38.Lovasi GS, Neckerman KM, Quinn JW, et al. Effect of individual or neighborhood disadvantage on the association between neighborhood walkability and body mass index. Am J Public Health. 2009;99:279–84. doi: 10.2105/AJPH.2008.138230. [DOI] [PMC free article] [PubMed] [Google Scholar]
- 39.Lovasi GS, Schwartz-Soicher O, Neckerman KM, et al. Aesthetic Amenities and Safety Hazards Associated with Walking and Bicycling for Transportation in New York City. Ann Behav Med. doi: 10.1007/s12160-012-9416-z. [DOI] [PMC free article] [PubMed] [Google Scholar]
- 40.Zick CD, Smith KR, Fan JX, et al. Running to the Store? The relationship between neighborhood environments and the risk of obesity. Social Science & Medicine. 2009;69:1493–500. doi: 10.1016/j.socscimed.2009.08.032. [DOI] [PMC free article] [PubMed] [Google Scholar]
- 41.Bader M, Richards C, Neckerman K, et al. Population Association of America 2011. Washington, DC: 2011. School Environment and Obesity among Urban Adolescents. [Google Scholar]
- 42.Befort C, Kaur H, Nollen N, et al. Fruit, vegetable, and fat intake among non-Hispanic black and non-Hispanic white adolescents: Associations with home availability and food consumption settings. Journal of the American Dietetic Association. 2006;106:367–73. doi: 10.1016/j.jada.2005.12.001. [DOI] [PubMed] [Google Scholar]
- 43.Flowerdew R, Manley DJ, Sabel CE. Neighbourhood effects on health: Does it matter where you draw the boundaries? Social Science & Medicine. 2008;66:1241–55. doi: 10.1016/j.socscimed.2007.11.042. [DOI] [PubMed] [Google Scholar]
- 44.Jelinski D, Wu J. The modifiable areal unit problem and implications for landscape ecology. Landscape Ecology. 1996;11:129–40. [Google Scholar]
- 45.Thornton LE, Cameron AJ, McNaughton SA, et al. The availability of snack food displays that may trigger impulse purchases in Melbourne supermarkets. BMC Public Health. 12:194. doi: 10.1186/1471-2458-12-194. [DOI] [PMC free article] [PubMed] [Google Scholar]
- 46.Smith D, Cummins S, Clark C, et al. Does the local food environment around schools affect diet? Longitudinal associations in adolescents attending secondary schools in East London. BMC Public Health. 13:70. doi: 10.1186/1471-2458-13-70. [DOI] [PMC free article] [PubMed] [Google Scholar]