

Abstract
INTRODUCTION
Misfolded Tau and amyloid-β (Aβ) proteins progressively accumulate in the brain, causing decreased and increased neuronal function and neurodegeneration. This study sought to investigate whether the wide spectrum of functional reorganization in aging brains of cognitively normal individuals relates to specific pathological patterns of Tau and Aβ deposits.
METHODS
We used functional connectivity neuroimaging and in vivo Tau and Aβ positron emission tomography (PET) scans to study cortical spatial relationships between imaging modalities.
RESULTS
We found that a negative association between Tau and functional connectivity combined with a positive association between Aβ and functional connectivity is the most frequent cortical pattern among elderly subjects. Moreover, we found specific brain areas that interrelate hypo- and hyper-connectivity regions.
DISCUSSION
Our findings have critical implications to understanding how the two main elements of AD-related pathology affect the aging brain and how they cause alterations in large-scale neuronal circuits.
Keywords: Aging, Alzheimer’s disease, PET, Tau, Amyloid, Brain Functional Network
1. Introduction
Even decades before the appearance of any cognitive manifestations, Alzheimer’s disease (AD)-related neuropathology may have accumulated in the brain in the form of the intracellular neurofibrillary tangles (NFT) of Tau proteins [1–3] and extracellular insoluble amyloid-β (Aβ) [2,4,5]. In AD, Tau and Aβ deposits are not randomly distributed; rather they have characteristic spatial patterns [1,3] that seem to follow large-scale brain systems or connectivity networks [6–11]. The study of brain networks targeted by AD pathology is important, if the spatial distribution and potential spreading across brain pathways of AD is to be understood. A central question that remains unsolved is: How do Tau and Aβ deposits affect the functionality of large-scale brain systems? It has been conjectured that Aβ may affect cortical functional connections in various ways, depending on the stage of the disease and the targeted circuit. Previous studies have shown that both hyper- and hypo-activity/connectivity phenomena may dwell in preclinical and clinical AD brains [12–14]. This study sought to develop a more comprehensive framework of the AD-related pathology in which the relationships between Tau, Aβ, and functional connectivity changes in cognitively normal elderly individuals are examined. Specifically, this study evaluated the spatial distribution in the brain of a recently developed positron emission tomography (PET) Tau tracer known as 18F-T807 or 18F-AV-1451 or flortaucipir (Avid Radiopharmaceuticals Inc)[15–19] and sought to identify its relationship with Aβ deposition and functional connectivity changes to gain insight into the regional and distributed systems affected in the preclinical stages of AD.
First, we hypothesized that Tau and Aβ deposits are closely related to the integrity of functional connectivity networks. We postulated that Tau and Aβ deposits might affect different aspects of the functional network of the brain, reflecting their in vivo spatial preferences and early spreading signatures and producing some of the neurodegenerative features seen in the post-mortem brain tissue deposits of the aging brain. Second, we sought to describe the ties between pathological deposits and functional changes to shed light on the underlying network mechanisms of the disease. Thus, in-vivo Tau and Aβ PET imaging, functional connectivity magnetic resonance imaging (MRI), and graph theory techniques were used to characterize the spatial associations of AD-related pathology and functional changes in the brains of elderly individuals.
2. Material and Methods
2.1 Participants
Thirty-nine cognitively normal elderly participants (EPs) (mean age (SD): 73.27 (5.62); male/female: 24/15; mean education in years (SD): 16.25 (2.58); mean MMSE (SD): 29.1 (1.13); mean CDR: 0; 11 amyloid positive subjects (FLR-DVR≥1.2)) participated in the study (see Supplementary Material for recruitment and inclusion criteria details). An additional, 39 cognitively normal young participants (YPs) (mean age (SD): 20.87 (3.29); male/female: 19/20; mean education in years (SD): 15.87 (3.29), EPs vs. YPs educational level: p-value=0.4) were included as resting-state MRI-related comparisons.
2.2 Imaging Acquisition Procedures
The EPs underwent two PET imaging acquisitions: (1) a 18F-T807 tracer that binds Tau neurofibrillary tangles [16]; and (2) a 11C-labeled Pittsburgh Compound-B, N-methyl 11C-2-(4-methylaminophenyl)-6-hydroxybenzothiazole (11C-PIB) tracer that binds to fibrillar Aβ plaques [20] (see Supplementary Material for additional details on PET imaging acquisition and preprocessing). Data were acquired at Massachusetts General Hospital on a Siemens/CTI ECAT PET HR scanner. The average time elapsed between the two PET scan sessions was 152 days (SD, 94), between fcMRI and 11C-PIB was 180 days (SD, 89), and between fcMRI and 18F-T807 was 197 days (SD, 98). The voxel-level frequency maps of Tau and Aβ deposits equal or above a binary threshold of 1.2 SUVR and 1.2 DVR in our sample is displayed in Supplementary Figure 1.
2.3 Functional Connectivity Acquisition Procedures
The functional MRI image acquisition was performed on a 3 Tesla Tim Trio system (Siemens, Erlangen, Germany) using a 12-channel phased-array head coil with a functional gradient-echo echo-planar pulse sequence sensitive to BOLD contrast (see Supplementary Material for additional details on fcMRI acquisition and preprocessing). An optimized functional connectivity magnetic resonance imaging (fcMRI) protocol [21], extending the approach developed by Biswal et al. 1995 [22], was used in the preprocessing steps (DPABI/DPARSF toolbox).
2.4 Association Matrices and Functional Connectivity Maps
Before the statistical analyses, the following steps were undertaken in relation to each individual fcMRI (see Supplementary Figure 2). First, the Pearson R correlation coefficient with z-fisher transformation between each voxel pair in the whole brain was computed. A time course of low-frequency BOLD fluctuations and a whole brain mask of 6,756 voxels (n) were used to obtain a final n × n association matrix for each individual. Next, three alternative procedures were performed to obtain weighted degree connectivity maps based on the selection criteria of the functional connections in the association matrices (see Supplementary Figure 3). The three procedures comprised: (1) the inclusion of all positive and negative functional connections; (2) the inclusion of positive functional connections above zero; and (3) the inclusion of positive functional connections after false discovery Rate (FDR) correction [23](at q level of < 0.05). Weighted degree connectivity (or weighted degree centrality) refers to the total strength that a given node (i.e., voxel) has in relation to the other nodes in the graph. By conventional definitions, degree centrality maps reveal “network hubs” in fcMRI data [6,24].
A data-driven, voxel-level whole-brain analysis called Local and Distant Connectivity Analysis [24] was then conducted to study and compute functional connectivity maps at the local and distributed (i.e., distant) levels in each EP and YP individual in the sample. The computation of connectivity hubs/degree maps in each individual provides the advantage of distinguishing aging changes occurring in both focal and long-distance connections. Local and distant degree connectivity maps were computed at continuous physical distances or Euclidean distances (ranking from 18 to 48 mm neighborhoods; Supplementary Figure 4), although a segregation threshold of local and distant connections at a 12 mm neighborhood was employed in the main analysis [24]. Thus, association matrices were used to sum the fisher-transformed correlation values (i.e., the weighted degree) that a given voxel in the brain had to its immediate neighborhood (i.e., all surrounding voxels within 12 mm of distance; local connectivity maps) or outside that neighborhood (i.e., all voxels outside 12 mm of distance; distant connectivity maps)(formula of the Local and Distant Connectivity Analysis is described in the Supplementary Material).
2.5 Statistical Analysis and Spatial Relationships
A statistical parametric approach was used to compare local and distant weighted degree connectivity maps between the EP and the YP groups (two sample t-tests, Matlab v8.0, The Mathworks Inc., Natick, MA). A combined t-score map was obtained from two statistical comparisons: EP < YP (i.e., the hypo-connectivity condition) and EP > YP (i.e., the hyper-connectivity condition). In relation to group effects, a FDR at a q level of < 0.05 was used to correct multiple comparisons. Corrected areas are shown in the cortical maps as black borders. To visualize the spatial relationships between the maps, the volumetric data was transformed into four vectors: two corresponding to the population average Tau and Aβ maps, and two corresponding to the population average local and distant t-score contrast maps. We performed a least squares fit to explain voxel-level local or distant t-score values as a linear function of Tau and Aβ values. A similar strategy was also employed to characterize the spatial relationships at the individual level. Instead of using average and t-score maps, a least squares fit was computed for the connectivity maps of each EP in the sample as a linear model of individual Tau, Aβ maps. We regressed out grey matter values from each of the analyzed maps as a previous step to compute the relationships between Tau, Aβ, and weighted degree connectivity. Finally, we plot the individual-level coefficients of the linear model fits that can be interpreted as partial correlations between the corresponding variables. This approach allowed the individual relationships to be converted into a scatterplot in which the dots represented the participants in the sample and contained each individual’s main relationship between Tau, Aβ, and weighted degree connectivity. The linear regression of the combined spatial patterns of Tau- and Aβ-weighted degree connectivity in Figure 2 was additionally controlled by the individual lag between imaging modalities.
Figure 2. Spatial Associations between Tau, Amyloid-β and Functional Connectivity Maps in Elderly Individuals.
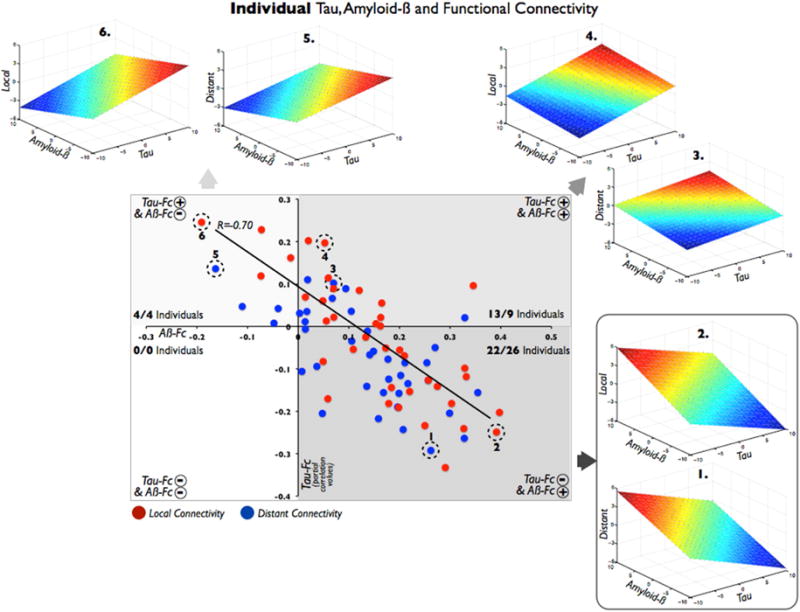
The scatterplot summarizes the main relationships between cortical maps at each elderly individual. A dot represents the relationship between Tau and Aβ vs. functional connectivity maps (local=red dots; distant=blue dots) in a single subject. Based on these spatial associations, there are four profiles of cortical relationships depending on the plane-fit coefficients: (1) right-bottom quadrant shows the combination of a negative association between Tau and weighted degree connectivity, plus a positive association between Aβ and weighted degree connectivity (22 local and 25 distant); (2) right-top quadrant shows the combined pattern in which both Tau and Aβ are positively related to weighted degree connectivity (13 local and 10 distant); (3) left-top quadrant shows the combination of a positive Tau vs. weighted degree connectivity and negative Aβ vs. weighted degree connectivity (4 local and 4 distant); (4) left-bottom quadrant represents a negative association of both Tau and Aβ with weighted degree connectivity (0 local and 0 distant). For illustration purposes, two exemplary individuals are displayed per quadrant (1 to 6 plane-fit figures and dashed circles in the main scatterplot). Axes represent partial correlation values.
2.6 Linkage Analysis between Hypo- and Hyper-Connectivity
A whole-brain graph theory approach and individual-level association matrices of functional connectivity (selection criteria (1)) were used to identify areas of the brain that may integrate the hypo- and hyper-connectivity phenomena in EP. It was thought that if the decrease and increase connectivity in EP represented two related and dependent phenomena, there would be areas in the brain in which hypo- and hyper-connections converge. It was assumed that these areas of linkage (or linkage-connectivity, Linkage-C) might be bridges that display hypo- and hyper-connectivity towards both the hypo-connectivity (Hypo-C) and hyper-connectivity (Hyper-C) areas. Accordingly, a decrease in strength in functional connections on the Hypo-C should be related to an increase in strength in functional connections on the Hyper-C. Thus, the relationship between the strength of functional connections and weighted degree of linkage areas must have a negative sign. Consequently, a data-driven whole-brain search for negative correlations occurring between the strength of functional connections and the weighted degree using the entire sample of EP was conducted (formula of Linkage Analysis, mask employed in Figure 3-C, and cortical visualization procedures are detailed in the Supplementary Material).
Figure 3. Hypo-Connected, Hyper-Connected and Linkage Regions Are Related with Different Profiles of AD-Related Pathology.
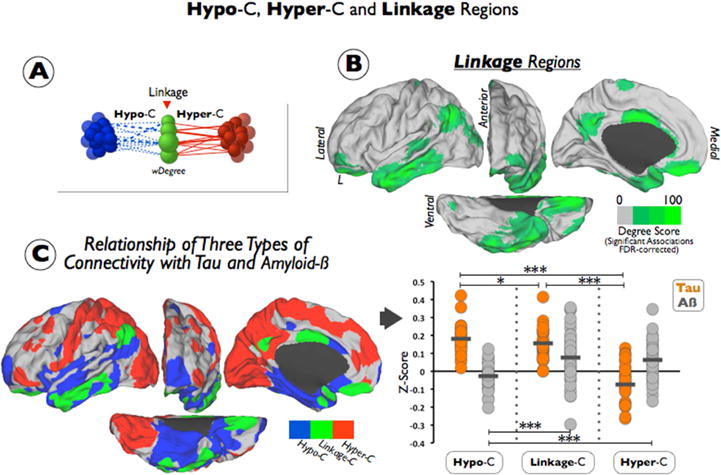
(A) shows a diagram summarizing the main elements of our Linkage Analysis. Linkage areas are characterized based on the number of occurrence of negative correlations between its functional connectivity strengths and changes in weighted degree (represented as difference sizes in green nodes; Hypo-connected nodes=blue nodes; Hypo-connectivity=blue dashed lines; Hyper-connected regions=red; Hyper-connectivity=red lines). (B) shows the linkage areas in green resulting from the FDR-corrected Linkage Analysis. Color scale represents the degree of Linkage-C from 0 to 100. (C) left figure displays the spatial cortical distribution of the three types of connectivity described in the EP sample (Hypo-connected regions=blue; Hyper-connected regions=red; Linkage regions=green). Right figure shows the individual Tau (orange dots) and individual Aβ (grey dots) z-score intensities in each mask of the three types of connectivity (Hypo-C, Hyper-C and Linkage-C). Short horizontal lines represent means of the sample and stars show statistical significance of Tau or Aβ between Hypo-C Hyper-C and Linkage-C (t-test; *<0.05, ***<0.001). To avoid redundancy only left hemispheres are displayed in the figure.
3. Results
3.1 Tau and Amyloid-β are Distinctively related to Cortical Connectivity Alterations
The average Tau deposits map of the sample show that Tau has a spatial affinity with the temporal lobe, particularly the inferior and lateral temporal cortex, and several regions in the ventral and ventro-lateral areas of the frontal lobe (see Figure 1-A). Average Aβ deposits were predominantly located in the frontal and parietal lobes, especially in anterior and lateral frontal areas and the precuneus and inferior lateral parietal cortex (see Figure 1-A). The temporal lobe was less affected by Aβ deposits; however, there was some uptake in its lateral cortex.
Figure 1. Tau and Amyloid-β-Relates Distinctively with Functional Connectivity Reorganizations in the Elderly Brain.
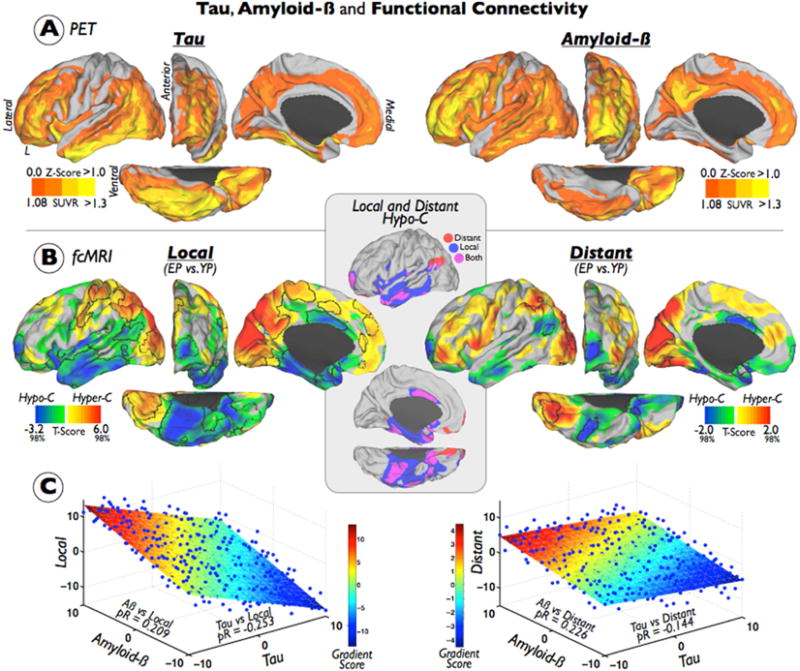
(A) shows the average maps of Tau and Aβ deposits in the EP sample. Color bars represent a z-score color scale from 0 to 1 and to aid visualization both maps are shown in its positive range. (B) displays the t-score maps from the EP vs. YP statistical contrast of the local (left) and distant (right) weighted degree connectivity maps. Individual maps of weighted degree connectivity were based on FDR corrected functional connections and 12mm neighborhood threshold. EP<YP findings are illustrated in a blue-green color and a Caret 2%–98% scale (hypo-connected regions; Hypo-C) and EP>YP findings are illustrated in a red-yellow color and a Caret 2%–98% scale (hyper-connected regions; Hyper-C). Black borders delimitate the FDR multiple comparison corrected findings. Inset shows the overlap of local and distant Hypo-C maps based on the uncorrected t-score maps (blue=local; red=distant; purple=both). (C) displays the plane-fitted relationship of average Tau, average Aβ and t-score maps in the EP sample. Color scale represents the gradient score of the 3D plane. To avoid redundancy only left hemispheres are displayed in the figure. pR=partial correlations.
Next, this study examined whether in vivo Tau and Aβ deposits are related to functional alterations in the human cortex. The EP and YP samples were compared to evaluate changes in the functional connections at both local and distributed connectivity levels. Figure 1-B sets out the findings of the FDR multiple comparisons corrected (using a weighted degree approach), the voxel level statistics, and the local/distant segregation at the 12 mm neighborhood results. Supplementary Figures 3 and 4 show other alternative statistical and neighborhood thresholds. The EP showed a decreased local connectivity in almost the entire temporal cortex (more intense in inferior and lateral areas), and in several other areas such as the anterior and orbital areas of the frontal lobe, the middle cingulate cortex, and the lateral inferior parietal lobe (i.e., the hypo-connected regions (Hypo-C) in Figure 1-B, FDR-corrected outlined in black). There was overlap between a loss of distant and local connections; however, distant connectivity changes appear to extend posteriorly toward the inferior parietal lobe (see the inset and Hypo-C overlap map in Figure 1-B). Conversely, increased local and distant connectivity was found in modal cortical areas such as the occipital and somatomotor cortices and the association areas of the parietal lobe (see the hyper-connected regions (Hyper-C) in Figure 1-B). Overall, we found much greater extent of FDR-corrected significant findings for local than distant connectivity.
Finally, the cortical spatial relationship between Tau, Aβ, and functional connectivity changes in EPs were studied (see Figure 1-C). The distribution of Tau cortical deposits was negatively associated with the Hypo-C/Hyper-C t-score. Thus, high Tau cortical intensity was related to high Hypo-C (i.e., decreased functional connectivity (EP < YP)) (see Figure 1-C). The distribution of Aβ cortical deposits was characterized as being positively associated with the Hypo-C/Hyper-C t-score. High Aβ cortical intensity was related to high Hyper-C (i.e., increased functional connectivity (EP < YP)) (see Figure 1-C). These relationships were more noticeable in local connectivity maps than distant connectivity maps.
3.2 Individual Association Patterns of Tau, Amyloid-β and Functional Connectivity Maps
To gain insights into any individual differences within the sample, the spatial relationship of Tau, Aβ, and functional connectivity maps were described for each of the EPs. Individuals were classified as having one of four profiles, depending on the spatial associations of the cortical maps (see Figure 2 in which the dots in the scatterplot represent individual participants and two individuals per quadrant are displayed as full 3D plane-fit figures for illustration purposes). Although individual spatial associations were not especially strong (from partial correlations of 0.25 to −0.33), we found consistent patterns in the study sample. A combination of a negative association between Tau and weighted degree connectivity, plus a positive association between Aβ and weighted degree connectivity was found to be the most frequent pattern among EPs (see the right-bottom quadrant of Figure 2 and examples 1 and 2). Thus, the majority of EPs profiles were congruent with the general relationship described in the previous section. Additionally, a number of other spatial patterns were found; for example, a significant number of EPs displayed a combined pattern in which both Tau and Aβ were positively related to weighted degree connectivity (see the right-top quadrant of Figure 2 and examples 3 and 4). Less numerous was the combination of positive Tau versus weighted degree connectivity and negative Aβ versus weighted degree connectivity associations (see the left-top quadrant of Figure 2 and examples 5 and 6). Importantly, none of the EPs displayed Tau and Aβ in which both were negatively related to weighted degree connectivity (see the left-bottom quadrant of Figure 2). Finally, we found a strong negative relationship between the combined spatial patterns of Tau- and Aβ-weighted degree connectivity (R=−0.70). Of note, local and distant segregations produced analogous results in this analysis.
3.3 Linkage between Hypo-Connectivity, Hyper-Connectivity, and AD-Related Pathology
A graph theory approach was used to determine whether the findings of Hypo-C and Hyper-C in EPs were interdependent at the connectivity level (see Figure 3-A), that is, whether there are cerebral regions in which hypo- and hyper-connections converge. We found areas in the lateral parietal, precuneus/posterior cingulate cortex, the lateral temporal and the middle cingulate, and the orbitofrontal cortex linking the Hypo-C and Hyper-C (see Figure 3-B). When these findings were overlapped with the previous results from Figure 1-B, areas involved in the linkage (see the green areas in Figure 3-C) were observed to be either embedded, neighboring or in between Hypo-C (blue areas in Figure 3-C) and Hyper-C (red areas in Figure 3-C). Finally, the Tau and Aβ deposits were studied in the three types of connectivity changes in the EPs: Hypo-C, Hyper-C, and Linkage-C. Hypo-C was characterized by high Tau and low Aβ deposits. Hyper-C was characterized by low Tau and high Aβ deposits. While Linkage-C showed a hybrid pattern of high Tau and high Aβ deposits (see Figure 3-C).
4. Discussion
Previous studies have asserted that hyper-connectivity is a frequent phenomenon in both clinical and preclinical states of the AD [14]. At present, it is still unknown how this phenomenon arises in large-scale neuronal circuits of the human brain with other neurodegenerative processes such as the more expected hypo-connectivity. A potential underlying mechanism could be related to specific patterns of accumulation of Tau and Aβ proteins. With the advent of novel PET Tau tracers and existing PET Aβ and fcMRI techniques, the intimate relationship of these functional changes and the pathological alterations occurring in clinical and preclinical AD can now be studied. Thus, this study examined whether spatial patterns of Tau, Aβ, and degree connectivity maps form a coherent scenario for understanding both the hypo- and the hyper-functionality phenomenon in the elderly brain.
4.1 Hypo-Connectivity-Tau and Hyper-Connectivity-Amyloid-β Relationships
A significant finding of our research showed that Tau pathology in EPs was associated with areas displaying a significant decrease in functional connectivity (compared to YP controls). This finding is congruent with previous studies describing that CSF p-Tau levels are negatively correlated with functional connectivity in the medial temporal lobe, such as the entorhinal cortex [25]. Moreover, Aβ pathology distribution was related to areas in which there was a significant increase of functional connectivity. A range of patterns was found to arise at the individual level; however, the vast majority of the participants showed that Tau and Aβ had an inverse relationship with functional connectivity hubs (i.e., Tau tended to be located in areas of hypo-connectivity and Aβ tended to be located in areas of hyper-connectivity).
Previously, it has been postulated that macro-pathological findings and micro-neuronal mechanisms may be related via the neuronal excitatory-toxicity hypothesis. This hypothesis states that neural damage can result from the over-activation of N-methyl-D-aspartic acid receptors by glutamate at the synaptic level [26,27]. For example, AD research has found that an increase of amyloid peptides in the extracellular space depends on synaptic activity [28]. Thus, it is plausible that an excess of activity in interconnected neurons (with high basal metabolism or sustained activity) may create a excitatory environment leading to progressive neurodegenerative cascade and activity-dependent neurodegeneration. Findings that areas of preferential location of Aβ deposits are highly connected and interconnected [29] with higher basal metabolism [30] and higher levels of aerobic glycolysis [31] have led to the synaptic excitatory-toxicity hypothesis being generalized to the large-scale brain level [6]. However, several issues arise in relation to this generalization [32]. For example, if high basal metabolism confers pathology risks, why are early regions of neurodegeneration such as medial temporal lobes not among the most hyper-metabolic or hyper-connected areas? The medial temporal and, more specifically, the hippocampus, are critical regions of neurodegeneration, but neither are hubs of high functional connectivity nor high hyper-metabolism, or aerobic glycolysis. Thus, it is likely that other mechanisms associated with the temporal lobe have a role in the overall neurodegeneration pattern. In light of this study’s results, the association between Tau pathology and hypo-connectivity in the temporal lobe indicates an alternative interpretation that complements the excitatory-toxicity hypothesis. This study showed that, in addition to a hyper-connectivity-Aβ relationship (likely related to the Aβ-driven excitatory-toxicity), there is a hypo-connectivity-Tau relationship and possibly a Tau-driven non-necessarily excitatory-toxicity mediated that may be considered as distinctive phenomenon.
4.2 Are Paradoxical Functional Connectivity Changes in the Elderly Brain Related?
The above findings indicate a fundamental relationship between AD-related pathology and functional impact in the brain tissue; however, the question of whether hypo- and hyper-functionality/connectivity (and their associated pathological profiles) are interdependent phenomena on a large-scale level remains opaque. In an attempt to answer this question, the local and distant functional connectivity changes of the EPs were analyzed to identify potential areas of transition between hypo- and hyper-connected hubs. The results indicated that both local and distant functional connectivity patterns provide similar information in relation to the functional-pathology relationship. However, several interesting findings were also uncovered.
First, local hypo-connectivity is more strongly related than distant to Tau and Aβ spatial patterns and was particularly noticeable between the temporal lobe and the Tau deposits. Second, distant hypo-connectivity in the inferior lateral parietal lobe was more prominent than local hypo-connectivity. Previously, studies have suggested that both Tau and Aβ aberrant protein deposits follow large-scale networks and anatomical regions that are interconnected and, consequently, several hypotheses about the progression of the AD through linked neurons have been proposed [8,11,33–35]. For instance, it has been recently propose that differential vulnerability of networks and its neural connection types provide candidate substrates for the tissue propagation of proteinopathies, such as AD [35]. If this ‘molecular nexopathies’ hypothesis is correct, then, any brain changes during the preclinical stages should reflect early structural and functional fingerprints that relate to the molecular spreading character of AD [35]. Thus, a predominant local connectivity disruption in the temporal lobe with the combination of a distant connectivity disruption in the inferior parietal cortex (known to be a relay station between the temporal and parietal association areas [36]) may indicate an advance of the AD-related neurodegeneration to other areas of the cortex. As proteinopathies seems to fit specific neural circuits [35], local insults linked to a clustered Tau proteinopathy may produce local disconnectivity that subsequently unchain and spread to distant axonal connections, potentially linked to Aβ proteinopathy, in distributed cerebral regions. However, it is important to remark that a reverse spreading pattern in which distant disconnectivity occurs in the parietal association cortices without severely affecting parietal local structures might be also possible.
These findings provided only indirect evidence of the potential long-range expansion of decreased functional connectivity in the elderly brain. The question of whether hypo-and hyper-functional changes are related remains to be elucidated. Therefore, we conducted a post-hoc graph theory approach to determine the relationship between hypo- and hyper-connectivity reorganizations in the elderly brain. The results showed that areas in the so-called default mode network (DMN) and the anterior temporal, middle cingulate and orbitofrontal cortex, appeared to act as mediators between hypo- and hyper-connected hubs. Specifically, these areas displayed a hybrid pattern of Tau and Aβ deposits. There are regions in the brain that appear to be in the middle of both functional extreme profiles, and, congruently, previous reports have shown, for instance, reduced and increased functional connectivity in DMN regions associated to abnormal levels of CSF p-Tau and CSF Aβ [37]. Consequently, it is arguable that the hypo- and hyper-functional changes (and their respective partners of Tau and Aβ accumulation) may be integrated in a common and strongly interdependent process.
Conclusions
Presently, the actual deleterious effect that the AD-related functional reorganization has on the brain neuronal systems is not known. It is postulated that local hypo-connectivity changes may create adaptive responses in other parts of the brain in the form of hyper-connectivity changes. In this study, it was observed that Tau pathology was related to a loss of functional connections (either in the hypo-connected core or DMN linkage areas). Conversely, Aβ-pathology was related to a potential adaptive increase of functional connections (likely with abnormal excitotoxic consequences) either in the hyper-connected core or the DMN linkage areas. Although the cross-sectional design of our study does not allow determining whether pathology precedes connectivity changes or the reverse, the different components of the functional reorganization and their pathological correlates provided evidence that the AD scenario of connectivity changes is likely the result of a systemic interdependent process.
Supplementary Material
Research in Context.
Systematic review: The authors reviewed the scientific literature describing the association between AD-related pathology and impaired neuronal function using PubMed and conferences data. The relevant bibliography regarding brain connectivity and pathological changes in preclinical stages of AD is properly cited.
Interpretation: Our findings led to a comprehensive understanding of how the two hallmarks of AD pathology, Tau and Aβ, impact large-scale neuronal circuits in the elderly human brain.
Future directions: The spatial cortical analysis of hypo- and hyper-functional systems associated to Tau and Aβ accumulation opens new venues toward the study of neuronal plastic changes in the aging brains of cognitively normal individuals. It provides a new framework to generate hypothesis about (a) early AD risk detection, (b) identification of cortical targets for future treatments such as brain connectivity modulation, or (c) enhance treatment monitoring.
Highlights.
Tau deposits dwell in areas of functional hypo-connectivity in the aging brain.
While Aβ deposits tend to overlap with mixed and hyper-connected brain regions.
Hypo- and hyper-connectivity are two interdependent phenomena in the DMN.
Tau and Aβ play characteristic roles in the neuronal breakdown during aging.
Acknowledgments
We thank the investigators and staff of the Massachusetts Alzheimer’s Disease Research Center (ADRC), the individual research participants, and their families and caregivers. We would also like to thank the PET Core Laboratory of the MGH, the Harvard Center for Brain Science Neuroimaging Core and the Athinoula A. Martinos Center for imaging support. This research was supported by grants from the National Institutes of Health (NIH) (K23EB019023 to J.S.; P50-AG00513421 to K.A.J. and R.A.S.; P01-AG036694 to K.A.J, R01-AG046396 to K.AJ.; and K25-EB013649 to M.R.S); Massachusetts ADRC; and Alzheimer’s Association (IIRG-06-32444 to R.A.S. and K.A.J.; ZEN-10-174210 to KAJ). J.S., M.S., Q.L. and G.E report no disclosures. Reisa Sperling reports consulting honorarium from Abbvie, Biogen, Genentech, Bracket, Roche, Sanofi, Lundbeck, Otsuka, and Merck; and clinical research funding from Eli Lilly and Janssen. Keith A. Johnson reports consulting honorarium from Lundbeck, Piramal Healthcare, Siemens, and Novartis.
Footnotes
Publisher's Disclaimer: This is a PDF file of an unedited manuscript that has been accepted for publication. As a service to our customers we are providing this early version of the manuscript. The manuscript will undergo copyediting, typesetting, and review of the resulting proof before it is published in its final citable form. Please note that during the production process errors may be discovered which could affect the content, and all legal disclaimers that apply to the journal pertain.
References
- 1.Arnold SE, Hyman BT, Flory J, Damasio AR, Van Hoesen GW. The topographical and neuroanatomical distribution of neurofibrillary tangles and neuritic plaques in the cerebral cortex of patients with Alzheimer’s disease. Cereb Cortex. 1991;1:103–16. doi: 10.1093/cercor/1.1.103. [DOI] [PubMed] [Google Scholar]
- 2.Braak H, Braak E. Neuropathological stageing of Alzheimer-related changes. Acta Neuropathol. 1991;82:239–59. doi: 10.1007/BF00308809. [DOI] [PubMed] [Google Scholar]
- 3.Braak H, Braak E. Demonstration of amyloid deposits and neurofibrillary changes in whole brain sections. Brain Pathol. 1991;1:213–6. doi: 10.1111/j.1750-3639.1991.tb00661.x. [DOI] [PubMed] [Google Scholar]
- 4.Walsh DM, Selkoe DJ. Oligomers on the brain: the emerging role of soluble protein aggregates in neurodegeneration. Protein Pept Lett. 2004;11:213–28. doi: 10.2174/0929866043407174. [DOI] [PubMed] [Google Scholar]
- 5.Klunk WE, Engler H, Nordberg A, Wang Y, Blomqvist G, Holt DP, et al. Imaging brain amyloid in Alzheimer’s disease with Pittsburgh Compound-B. Ann Neurol. 2004;55:306–19. doi: 10.1002/ana.20009. [DOI] [PubMed] [Google Scholar]
- 6.Buckner RL, Sepulcre J, Talukdar T, Krienen FM, Liu H, Hedden T, et al. Cortical hubs revealed by intrinsic functional connectivity: mapping, assessment of stability, and relation to Alzheimer’s disease. J Neurosci. 2009;29:1860–73. doi: 10.1523/JNEUROSCI.5062-08.2009. [DOI] [PMC free article] [PubMed] [Google Scholar]
- 7.Greicius M. Resting-state functional connectivity in neuropsychiatric disorders. Curr Opin Neurol. 2008;21:424–30. doi: 10.1097/WCO.0b013e328306f2c5. doi:10.1097/WCO.0b013e328306f2c5 [doi]00019052-200808000-00007 [pii] [DOI] [PubMed] [Google Scholar]
- 8.Seeley WW, Crawford RK, Zhou J, Miller BL, Greicius MD. Neurodegenerative diseases target large-scale human brain networks. Neuron. 2009;62:42–52. doi: 10.1016/j.neuron.2009.03.024. doi:S0896-6273(09)00249-9 [pii]10.1016/j.neuron.2009.03.024 [doi] [DOI] [PMC free article] [PubMed] [Google Scholar]
- 9.Walker LC, Diamond MI, Duff KE, Hyman BT. Mechanisms of Protein Seeding in Neurodegenerative Diseases. Arch Neurol. 2012:1–7. doi: 10.1001/jamaneurol.2013.1453. [DOI] [PMC free article] [PubMed] [Google Scholar]
- 10.Wu JW, Hussaini SA, Bastille IM, Rodriguez GA, Mrejeru A, Riles K, et al. Neuronal activity enhances tau propagation and tau pathology in vivo. - PubMed -NCBI. Nat Neurosci. 2016:1085–92. doi: 10.1038/nn.4328. https://www.ncbi.nlm.nih.gov/pubmed/?term=Neuronal+activity+enhances+tau+propagation+and+tau+pathology+in+vivo. [DOI] [PMC free article] [PubMed]
- 11.Zhou J, Gennatas ED, Kramer JH, Miller BL, Seeley WW. Predicting regional neurodegeneration from the healthy brain functional connectome. Neuron. 2012;73:1216–27. doi: 10.1016/j.neuron.2012.03.004. [DOI] [PMC free article] [PubMed] [Google Scholar]
- 12.Jones DT, Knopman DS, Gunter JL, Graff-Radford J, Vemuri P, Boeve BF, et al. Cascading network failure across the Alzheimer’s disease spectrum. Brain. 2016;139:547–62. doi: 10.1093/brain/awv338. [DOI] [PMC free article] [PubMed] [Google Scholar]
- 13.Huijbers W, Mormino EC, Schultz AP, Wigman S, Ward AM, Larvie M, et al. Amyloid-β deposition in mild cognitive impairment is associated with increased hippocampal activity, atrophy and clinical progression. Brain. 2015;138:1023–35. doi: 10.1093/brain/awv007. [DOI] [PMC free article] [PubMed] [Google Scholar]
- 14.Sheline YI, Raichle ME. Resting state functional connectivity in preclinical Alzheimer’s disease. Biol Psychiatry. 2013;74:340–7. doi: 10.1016/j.biopsych.2012.11.028. [DOI] [PMC free article] [PubMed] [Google Scholar]
- 15.Sepulcre J, Schultz A, Sabuncu M, Gomez-Isla T, Chhatwal J, Becker A, et al. In vivo Tau, Amyloid and Grey Matter Profiles in the Aging Brain. J Neurosci. 2016 doi: 10.1523/JNEUROSCI.0639-16.2016. In press. [DOI] [PMC free article] [PubMed] [Google Scholar]
- 16.Chien D, Bahri S, Szardenings A, Walsh J, Mu F, Su M, et al. Early clinical PET imaging results with the novel PHF-tau radioligand [F-18]-T807. J Alzheimers Dis. 2013;34:457–68. doi: 10.3233/JAD-122059. [DOI] [PubMed] [Google Scholar]
- 17.Johnson KA, Schultz A, Betensky RA, Becker JA, Sepulcre J, Rentz D, et al. Tau positron emission tomographic imaging in aging and early Alzheimer disease. Ann Neurol. 2016;79:110–9. doi: 10.1002/ana.24546. [DOI] [PMC free article] [PubMed] [Google Scholar]
- 18.Marquie M, Normandin MD, Vanderburg CR, Costantino I, Bien EA, Rycyna LG, et al. Validating novel tau PET tracer [F-18]-AV-1451 (T807) on postmortem brain tissue. Ann Neurol. 2015 doi: 10.1002/ana.24517. [DOI] [PMC free article] [PubMed] [Google Scholar]
- 19.Schöll M, Lockhart SN, Schonhaut DR, O’Neil JP, Janabi M, Ossenkoppele R, et al. PET Imaging of Tau Deposition in the Aging Human Brain. Neuron. 2016;89:971–82. doi: 10.1016/j.neuron.2016.01.028. [DOI] [PMC free article] [PubMed] [Google Scholar]
- 20.Mathis CA, Bacskai BJ, Kajdasz ST, McLellan ME, Frosch MP, Hyman BT, et al. A lipophilic thioflavin-T derivative for positron emission tomography (PET) imaging of amyloid in brain. Bioorg Med Chem Lett. 2002;12:295–8. doi: 10.1016/s0960-894x(01)00734-x. [DOI] [PubMed] [Google Scholar]
- 21.Van Dijk KR, Hedden T, Venkataraman A, Evans KC, Lazar SW, Buckner RL. Intrinsic Functional Connectivity As a Tool For Human Connectomics: Theory, Properties, and Optimization. J Neurophysiol. 2010;103:297–321. doi: 10.1152/jn.00783.2009. [DOI] [PMC free article] [PubMed] [Google Scholar]
- 22.Biswal B, Yetkin FZ, Haughton VM, Hyde JS. Functional connectivity in the motor cortex of resting human brain using echo-planar MRI. Magn Reson Med. 1995;34:537–41. doi: 10.1002/mrm.1910340409. [DOI] [PubMed] [Google Scholar]
- 23.Benjamini Y, Hochberg Y. Controlling the False Discovery Rate: A Practical and Powerful Approach to Multiple Testing. J R Stat Soc. 1995;57:289–300. [Google Scholar]
- 24.Sepulcre J, Liu H, Talukdar T, Martincorena I, Yeo BT, Buckner RL. The organization of local and distant functional connectivity in the human brain. PLoS Comput Biol. 2010;6:e1000808. doi: 10.1371/journal.pcbi.1000808. [DOI] [PMC free article] [PubMed] [Google Scholar]
- 25.Malpas CB, Saling MM, Velakoulis D, Desmond P, O’Brien TJ. Differential Functional Connectivity Correlates of Cerebrospinal Fluid Biomarkers in Dementia of the Alzheimer’s Type. Neurodegener Dis. 2015;16:147–51. doi: 10.1159/000438924. [DOI] [PubMed] [Google Scholar]
- 26.Gouras GK, Relkin NR, Sweeney D, Munoz DG, Mackenzie IR, Gandy S. Increased apolipoprotein E epsilon 4 in epilepsy with senile plaques. Ann Neurol. 1997;41:402–4. doi: 10.1002/ana.410410317. [DOI] [PubMed] [Google Scholar]
- 27.Palop JJ, Mucke L. Amyloid-beta-induced neuronal dysfunction in Alzheimer’s disease: from synapses toward neural networks. Nat Neurosci. 2010;13:812–8. doi: 10.1038/nn.2583. [DOI] [PMC free article] [PubMed] [Google Scholar]
- 28.Bero AW, Yan P, Roh JH, Cirrito JR, Stewart FR, Raichle ME, et al. Neuronal activity regulates the regional vulnerability to amyloid-β deposition. Nat Neurosci. 2011;14:750–6. doi: 10.1038/nn.2801. [DOI] [PMC free article] [PubMed] [Google Scholar]
- 29.Buckner RL, Sepulcre J, Talukdar T, Krienen FM, Liu H, Hedden T, et al. Cortical hubs revealed by intrinsic functional connectivity: mapping, assessment of stability, and relation to Alzheimer’s disease. J Neurosci. 2009;29:1860–73. doi: 10.1523/JNEUROSCI.5062-08.2009. [DOI] [PMC free article] [PubMed] [Google Scholar]
- 30.Minoshima S, Giordani B, Berent S, Frey KA, Foster NL, Kuhl DE. Metabolic reduction in the posterior cingulate cortex in very early Alzheimer’s disease. Ann Neurol. 1997;42:85–94. doi: 10.1002/ana.410420114. [DOI] [PubMed] [Google Scholar]
- 31.Vlassenko AG, Vaishnavi SN, Couture L, Sacco D, Shannon BJ, Mach RH, et al. Spatial correlation between brain aerobic glycolysis and amyloid-β (Aβ) deposition. Proc Natl Acad Sci. 2010;107:17763–7. doi: 10.1073/pnas.1010461107. [DOI] [PMC free article] [PubMed] [Google Scholar]
- 32.Royall DRA. Tangled Web (eLetters) J Neurosci. 2010 [Google Scholar]
- 33.Raj A, Kuceyeski A, Weiner M. A network diffusion model of disease progression in dementia. Neuron. 2012;73:1204–15. doi: 10.1016/j.neuron.2011.12.040. [DOI] [PMC free article] [PubMed] [Google Scholar]
- 34.Sepulcre J, Sabuncu M, Becker A, Sperling R, Johnson K. In vivo characterization of the early states of the amyloid-beta network. Brain. 2013;136:2239–52. doi: 10.1093/brain/awt146. [DOI] [PMC free article] [PubMed] [Google Scholar]
- 35.Warren JD, Rohrer JD, Schott JM, Fox NC, Hardy J, Rossor MN. Molecular nexopathies: a new paradigm of neurodegenerative disease. Trends Neurosci. 2013;36:561–9. doi: 10.1016/j.tins.2013.06.007. [DOI] [PMC free article] [PubMed] [Google Scholar]
- 36.Kahn I, Andrews-Hanna JR, Vincent JL, Snyder AZ, Buckner RL. Distinct cortical anatomy linked to subregions of the medial temporal lobe revealed by intrinsic functional connectivity. J Neurophysiol. 2008;100:129–39. doi: 10.1152/jn.00077.2008. [DOI] [PMC free article] [PubMed] [Google Scholar]
- 37.Canuet L, Pusil S, Lopez ME, Bajo R, Pineda-Pardo JA, Cuesta P, et al. Network Disruption and Cerebrospinal Fluid Amyloid-Beta and Phospho-Tau Levels in Mild Cognitive Impairment. J Neurosci. 2015;35:10325–30. doi: 10.1523/JNEUROSCI.0704-15.2015. [DOI] [PMC free article] [PubMed] [Google Scholar]
Associated Data
This section collects any data citations, data availability statements, or supplementary materials included in this article.