

Abstract
DCLK1 expression is critically required for maintaining growth of human colon cancer cells (hCCCs). Human colorectal tumors (CRCs) and hCCCs express a novel short isoform of DCLK1 (DCLK1-S) (isoform2) from β-promoter of hDCLK1-gene, while normal-colons express long-isoform (DCLK1-L) (isoform1) from 5′(α)-promoter, suggesting that DCLK1-S, and not DCLK1-L, marks cancer stem cells (CSCs). Even though DCLK1-S differs from DCLK1-L by only six amino-acids, we succeeded in generating a mono-specific DCLK1-S-Antibody (PS41014), which does not cross-react with DCLK1-L, and specifically detects CSCs. Sub-cellular localization of S/L isoforms was examined by immune-electron-microscopy (IEM). Surprisingly, besides plasma membrane and cytosolic fractions, S/L also localized to nuclear/mitochondrial fractions, with pronounced localization of S-isoform in the nuclei and mitochondria. Sporadic CRCs develop from adenomas. Screening colonoscopy is used for detection/resection of growths, and morphological/pathological criteria are used for risk assessment and recommendations for follow-up colonoscopy. But, these features are not precise and majority of the patients will never develop cancer. We hypothesized that antibody-based assay(s), which identify CSCs, will significantly improve prognostic value of morphological/pathological criteria. We conducted a pilot retrospective study with PS41014-Ab, by staining archived Adenoma specimens from patients who developed (High-risk) or did not develop (Low-risk) adenocarcinomas within 10–15 years. PS41014-Ab stained Adenomas from initial and follow-up colonoscopies of high-risk patients, at significantly higher levels (3–5 fold) than Adenomas from low-risk patients, suggesting that PS41014-Ab could be used as an additional tool for assessing CRC risk. CRC patients, with high DCLK1-S expressing tumors (by qRT-PCR), were reported to have worse overall survival than low-expressers. We now report that DCLK1-S specific Ab may help to identify high-risk patients at the time of index/screening colonoscopy.
Keywords: Cancer stem cells, prognostic biomarker, sub-cellular localization, anti-DCLK1-S antibody
Colorectal cancers (CRCs) are one of the leading causes of death due to cancers (1). More than 100,000 people die every year due to CRC in United States alone (1). All CRCs develop from pre-malignant adenomatous (Ads) polyps in the colon (2). Adults, aged ≥50 yrs, with no genetic pre-disposition, develop sporadic hyperplastic (Hps) and adenomatous growths; by age 60, 30–40% of patients have colonic Ads. However, only ~5% of these patients will develop malignant growths in their lifetime (2–4). As a preventive measure, screening colonoscopy is recommended for all adults over the age of 50 (5). Follow-up colonoscopies are recommended at intervals of every 2–10 years, based on risk assessment. Currently, patients positive for colonic polyps are assigned either high- or low-risk, based on number (≥3/<3) and size (≥1 cm/<1 cm) of polyps, and presence/absence of high-grade dysplasia. Follow-up intervals of ~5–10 years are recommended for patients positive for only Hps with no evidence of dysplasia (4–6). However, <10% high-risk patients will eventually develop CRCs, while ~10–20% of low-risk patients develop malignant adenocarcinomas (AdCAs), including advanced Ads (A-Ads) of clinical concern (6–8). Thus, there is a critical need for developing molecular biomarkers, besides currently used morphological/pathological qualifiers, to better identify patients at risk of developing AdCAs. An accurate identification can potentially reduce high rates of false positive/negative recommendations, and reduce overall burden of repeated colonoscopies for majority of the patients who will never develop CRCs (9,10). Since transformation of normal-stem-cells (NSCs) to cancer-stem-cells (CSCs) can increase the risk of forming malignant growths (discussed in 11, 12), we hypothesized that presence of CSCs in resected polyps may predict poor outcomes for patients, irrespective of morphological or pathological features of the polyps.
Several CSC markers have been identified, including CD44, CD133, Lgr5 and DCLK1, which are reported to play a functional role in maintaining growth and/or metastatic spread of cancer cells (described in 12). DCLK1 was recently identified as a colon cancer specific marker, and plays a critical role in colon/pancreatic carcinogenesis in mice (13,14). DCLK1 is also critically required for maintaining proliferative potential of human colon cancer cells (hCCCs) (15). DCLK1 expression is up-regulated in response to growth factors, resulting in hyperproliferation of colonic crypts in mice (11). We recently reported that subsets of DCLK1+CSCs are resistant to inhibitory effects of chemoprevention/chemotherapeutic agents; down-regulation of DCLK1 was required for eliminating CSCs in response to chemopreventive/chemotherapeutic agents (15). However, isogenic clones of human embryonic epithelial cells, either poorly tumorigenic or highly metastatic, expressed identical set of stem-cell-markers, including DCLK1 (16). Thus, it has remained a challenge to specifically target CSCs, while sparing normal cells, to avoid toxicity. Our recent findings (12), as described below, will likely allow identification of CSCs in colonic tumors, at the time of screening colonoscopy itself, and help to improve the accuracy of follow-up colonoscopy recommendations.
The 5′ promoter of human (h)DCLK1-gene is epigenetically silenced in hCRCs (12,17–20). Hypermethylation of 5′ promoter was reported to be an early event during adenoma-carcinoma sequence of colon-carcinogenesis in humans (12). As a result, the long transcripts/isoforms of hDCLK1 are not expressed in hCRCs (12). Even though the 5′ promoter of hDCLK1 gene is epigenetically silenced (12), high levels of DCLK1 protein are present in hCRCs (discussed in 12). In order to address the discrepancy between the reported presence of DCLK1 protein in hCRCs, but epigenetic silencing of 5′ promoter in hCRCs, possible use of an alternate promoter for expressing alternate isoforms of DCLK1 was investigated. Human colon cancer cells (hCCCs) and CRCs were discovered to express short transcripts of DCLK1 (DCLK1-S) (isoform 2 in the NCBI data base) from an alternate β-promoter in IntronV of the gene, while normal colons mainly expressed the long isoform of DCLK1 (DCLK1-L) (isoform 1 in the NCBI data base) from 5′α-promoter (12), as recently reviewed (20). Thus our findings in the past few years, suggested that DCLK1-S may represent a CSC specific marker in humans, while DCLK1-L mainly marks normal human cells. Pathophysiological relevance of DCLK1-S expression by hCRCs was examined in a cohort of 92 CRC patients; high-expressers had significantly worse overall survival and disease free interval compared to low-expressers (12). Importantly, DCLK1-S expression was found to represent an independent diagnostic/prognostic marker for CRC patients (12). These findings led us to develop a mono-specific antibody (Ab) against the unique CSC specific marker, DCLK1-S.
Several antibodies have been developed against the C-terminal end of DCLK1 proteins, which is common to both the short and long isoforms (described in 12). Investigators in the field have used commercially available antibodies against the common C-terminal end of DCLK1 to identify presence of DCLK1 in normal and/or cancer cells (11–16,21–29). Antibodies against DCLK1-L, generated against epitopes within the double-cortin (DCX) domains of DCLK1-L, at the N-terminal end of the protein, have also become available, and specifically identify the L isoform, since short isoforms, including isoform 2, lack DCX domains (described in 12). Even though isoforms 1 and 2 have been described in neuronal cells, possible differential effects of the isoforms, remains unknown. Specific antibodies against the short isoform are not available. Since human epithelial cancers (colon/pancreatic) mainly express the S-isoform (12,30), representing a CSC-specific biomarker, we generated a mono-specific antibody against the unique amino acids at the N-terminal end of the short isoform. In previous years, the short isoform present in the neuronal cells was believed to represent a proteolytic fragment of the L-isoform due to enzymatic processing by calpain enzyme (31). While it remains possible that L-isoform derived fragments are also present in epithelial cells, our studies strongly suggest that short fragments of DCLK1 in human colon/pancreatic cancer cells, are the product of a unique S-transcript, transcriptionally derived from the β-promoter of hDCLK1-gene (12). The S-transcript is >98% homologous with the 3′ end of the L transcript (12), but has unique nt sequences at the 5′ end, resulting in the presence of six unique amino acids at the N-terminal end of DCLK1-S protein. We took advantage of the unique moieties, and generated a mono-specific antibody against the S-isoform of DCLK1, as reported in here. The specificity/sensitivity of the antibody was confirmed in the current studies. Since the S-isoform lacks DCX domains, we hypothesized that the intracellular localization of the two isoforms maybe different. Electron microscopy (EM) was used to identify possible differential localization of the isoforms in isogenic clones of colon cancer cells, expressing either the L or S isoforms. Our studies demonstrate that the isoforms are not only present at the plasma membranes and in the cytosol of cancer cells, but are also present in the nuclei and mitochondria of the cells.
In order to determine if DCLK1-S can potentially serve as a biomarker at the time of screening colonoscopy, as proof of principle we conducted a pilot retrospective study with anti-DCLK1-S antibody (Ab), generated by our laboratory. Our findings suggest that DCLK1-S can be used as a biomarker, at the time of index/screening colonoscopy, for identifying high- vs low-risk patients, more accurately, than the currently used morphological/pathological criteria. The discovery of DCLK1-S as a specific marker of CSCs in human colonic tumors (12) provides an opportunity for identifying the small subset of high-risk patients who will likely develop malignant growths within a shorter time span, and who may benefit from aggressive management to prevent onset of the CRC disease.
MATERIALS AND METHODS
Reagents used
Antibodies (Abs) used in these studies included: anti-DCLK1 (generated against the common C-terminal end of the molecule, which is common to all the isoforms) (Abcam, Ab31704); anti-DCLK1-L antibody (generated against an epitope within the double-cortin domains and specific for the long isoform) (Abcam, Ab106635); anti-β-actin (total) (Sigma, St. Louis, MO); rabbit polyclonal antibody conjugated to Horseradish peroxidase (GE healthcare UK); goat anti-rabbit immunogold (15nM) antibody (Electron Microscopy Sciences, Hatfield, PA). Reagents used in these studies included ABC staining kit for immunohistochemistry (Vector Laboratories, Burlington, CA) and TSA Plus Biotin Kit (PerkinElmer, Waltham, MA). Transfection reagent, FuGENE6 was bought from Roche (Branford, CT). All reagent grade chemicals were purchased from Sigma (St. Louis, MO).
Generation of mono-specific, polyclonal antibody, against DCLK1-S isoform
The DCLK1-S isoform shares >98% amino acid homology with the C-terminal domains of the DCLK1-L isoform. However, DCLK1-S differs from DCLK1-L at the N-terminal end by 6 unique amino acids (Supplementary Fig 1). These unique amino acids were used as an antigen. To increase immunogenicity of the synthetic six amino-acid peptide, eight copies of the peptide were displayed on a lysine branched scaffold using multiple antigen peptide octavalent (MAP-8). The peptide and MAP-8 complex was purified and dissolved in 50% DMSO followed by mixing with complete Freund’s adjuvant for immunizing the rabbits. After five booster immunizations, antisera was collected after 16 weeks of initiating immunizations. The antisera were purified using immunoaffinity column generated by coupling the antigen to sepharose beads to yield monospecific polyclonal antibody to DCLK1-S. The sensitivity and specificity of the antibody (PS41014), thus generated, was examined as described under Results.
Cell culture
HCT116 and HEK293 cell lines were obtained from ATCC (Manassas, VA), and have been maintained in the laboratory for several years. All other colon cancer cell lines were purchased from ATCC within the past two years and confirmed by ATCC. All cell lines were monitored regularly for absence of mycoplasma. HCT116 and HEK293 cell lines were confirmed to represent human epithelial cell lines with the help of Biosynthesis Company (Lewisville, TX). HEKC and HEKmGAS stable clones were generated to overexpress either control (HEKC) or triple mutant human gastrin gene to overexpress full-length progastrin peptide (HEKmGAS), as previously described (16). All cell lines were cultured in DMEMF12 medium (Invitrogen, Grand Island, NY), supplemented with 10% FCS containing 1% penicillin/streptomycin in a humid atmosphere at 37°C with 5% CO2. The stable clones of HEK293 (HEKC; HEKmGAS) and COLO205 cells (described below), were cultured in the same medium, supplemented with 100μg/mL Geneticin (Invitrogen, Grand Island, NY) under similar conditions.
Generation of COLO205 clones, stably over-expressing full length GFP-DCLK1-L/S
Eukaryotic expression plasmids expressing N-terminally GFP tagged full length coding sequences of either DCLK1-L or DCLK1-S were purchased (GeneCopoeia, Rockville, MD). COLO205 clones stably expressing full length DCLK1-L (205-L) or DCLK1-S (205-S) were generated as previously described (16). Vector Transfected clones (205-C) expressing only GFP served as controls. GFP and DCLK1 expression by the clones was confirmed by western blot analysis.
Procurement of human patient samples
Human tissues samples were collected as per our approved IRB protocols (UTMB-IRB #03-237, UTMB-IRB #91-310), as previously described (12). Normal colonic mucosa samples were collected from consented patients at the time of endoscopy, only if patients were free of adenomas (Ads) or adenocarcinomas (AdCas), but positive for small Hp growths. Tumor samples were obtained as discarded specimens from primary adenocarcinomas or metastatic colonic growths with the help of Tissue Core Facility at the Cancer Center in the University of Alabama. All samples were snap frozen in liquid nitrogen and stored at −80°C till further processing. Colonic adenoma (Ad) samples, fixed in formalin and embedded in paraffin (FFPE blocks) were also obtained as archived specimens from the Department of Pathology at UTMB. The histopathologic features (e.g., Hps, Ads, AdCAs) in each of the specimen blocks was confirmed by evaluation of H&E sections by Dr Stevenson, a board certified pathologist.
Western Immunoblot (WB) analysis
Cells growing as mono-layer cultures at 60–70% confluency, were harvested and processed for preparing cellular lysates as previously described (11,12,16). Frozen tissue patient samples, obtained as described above, were homogenized and processed for preparation of tissue lysates in RIPA buffer as described previously (12). Samples containing 30–50 μg of proteins were subjected to electrophoresis and transferred to PVDF-membranes. Blots were cut into horizontal strips containing target or loading-control proteins (β-actin), and processed for WB. Antigen antibody complexes were detected with a chemiluminescence-reagent kit (Thermoscientific, IL or GE Healthcare, UK). Membrane-strips containing either target or loading control proteins were simultaneously exposed for equal time to autoradiographic films. Western blots presented were cropped to exclude bands beyond the range of the molecular markers, at the running and loading ends. Processing of films was applied equally across the entire image. Touch-up tools were not used to manipulate data.
Immunostaining
For IHC staining of patient tissue samples, slides containing tissue sections were deparaffinized and hydrated using xylene and ethanol. Slides were unmasked for antigen by boiling in sodium citrate buffer, pH 6.0. Sections were washed and 5% goat serum was used to block non-specific binding. The commercially purchased antibodies, that were either specific for DCLK1-L isoform or common to all the isoforms, were used at the dilution suggested by the manufacturer. PS41014-Ab, generated by our laboratory, was used at variable dilutions (1:50-1:1000) and 1:200 dilution was determined to be optimal for IHC staining (data not shown). Thus the PS41014-Ab was used at 1:200 dilution for the IHC studies, presented in here, and slides were incubated with the primary Ab at 4°C overnight. Incubated sections were washed and incubated at room temperature (RT) for 2h with HRP conjugated anti-rabbit-IgG at 1:200 dilution. Sections were further incubated for 30min at RT, using biotinylated secondary anti-rabbit or anti-mouse antibodies (1:200), followed by washing with PBS and incubated with DAB (ABC kit, Vector lab). Sections were stained with hematoxylin (H) and then mounted. Images from the tissue sections were captured by a Nikon microscope (TS100) equipped with camera at 10×, 20× and 40× magnifications, after mounting the sections with coverslips, as previously described (32,33). The % area or % epithelial cells, specifically stained with the antibodies, was determined as described in the legends of the figures.
Immuno-electron microscopy (IEM)
The methods used for EM microscopy are similar to methods we have previously used in our publications (34,35). Briefly, cells growing as mono-layer cultures at 60–70% confluency were harvested and fixed in 2.5% formaldehyde and 0.1% glutaraldehyde in 0.05 M cacodylate buffer pH 7.2 containing 0.01% trinitrophenol and 0.03% CaCl2 for 2 hr at RT. Cells were washed in 0.1 M cacodylate buffer cells and then scraped and pelleted. Pelleted cells were stained en bloc with 2% aqueous uranyl acetate, dehydrated in 50% and 75% ethanol and embedded in LR White resin medium grade (Electron Microscopy Sciences, Hatfield, PA). Ultrathin sections were cut on Leica EM UC7 ultramicrotome (Leica Biosystems, Buffalo Grover, IL) and collected onto Formvar-carbon coated nickel grids (Electron Microscopy Sciences). The grids were incubated in blocking buffer (0.1% BSA and 0.01 M glycine in 0.05 M tris-buffered saline [TBS]), followed by primary antibody (anti-GFP or PS41014-Ab) in 1% BSA in 0.05 M TBS (diluting buffer) for 1 hr at RT and then overnight at 4 °C. Grids were washed and incubated with secondary antibody (goat anti-rabbit IgG) conjugated to 15 nm colloidal gold particles at a dilution of 1:20, for 1 hr at room temperature. Grids were washed in TBST buffer and water and fixed in 2% aqueous glutaraldehyde. Grids were then washed and stained with uranyl acetate and lead citrate and examined in a Philips (FEI) 201 or Philips (FEI) CM-100 transmission electron microscope (Hillsboro, OR) at 60 kV.
Design of the pilot retrospective study
To assess the predictive value of DCLK1-S staining in resected patient polyps at the time of baseline colonoscopy, we designed a pilot retrospective study. Archived FFPE samples were obtained from Department of Pathology at UTMB. We have an approved IRB Protocol (91–310) for discarded specimens of colonic growths (Hps, Ads, and AdCAs). Two data bases were available to us for selecting FFPE blocks that can be potentially assigned to either the low-risk group or the high-risk group. The two data bases were arbitrarily termed the polyp data base and the CRC data base.
The polyp data base, lists the colonoscopy reports of all patients who received colonoscopies since 1992. Using the polyp data base from 2000–2001 alone, we identified >400 patients who returned for follow-up colonoscopies for ≥10 years. A digitized data base of polyp samples, collected since 1992, was available to us. The UH numbers of the identified patients were used to print PDI (previous diagnostic inquiry) reports, which contains pathology reports from all colonoscopies conducted at UTMB. Majority of the patients remained free of any significant growths, but at least 20–30% were positive for adenomas at index and follow-up colonoscopies, but remained free of A-Ads/CRCs during this period. We selected 6 patients from this group, as representative of low-risk group, since none of them developed A-Ads or AdCAs during the follow-up period. The CRC data base was used for identifying patient samples for the high-risk arm of the retrospective study; CRC data base lists all patients who had surgical removal of CRCs at UTMB. We screened the 2014–2015 data base of CRC patients, and identified several patients who had prior history of colonoscopies at UTMB, dating back to >8–12 years. Many of these patients’ were positive for only benign growths at the time of index/follow-up colonoscopies, and were selected as examples of high-risk patients. Patient FFPE blocks were obtained, irrespective of ethnicity, age and gender. The ethnic mix of patients reflects the population of Galveston County in Texas. The number, size (when available) and pathology of all polyps that were collected at each colonoscopy/surgery for the low- and high-risk arms of the study, was tabulated and is presented in Supplementary Tables.
On average, slides with consecutive tissue sections were prepared from ~3–7 FFPE blocks from each patient (to include at least 2 Ad specimens, ea, from initial and follow-up colonoscopies). At least one slide/polyp was stained with H&E to confirm morphology/pathology as described in the reports. The remaining slides were processed for IHC by our published procedures (32,33). Sections were stained with DCLK1-S-Ab (PS41014) in duplicate. The image J method, with conversion of positive staining to red scale was used for quantifying the relative staining of the specimens, in terms of % area stained. The % epithelial cells stained was also analyzed. The highest stained polyp from an index and follow-up colonoscopy was used for purposes of comparison.
Statistical Analysis
Data are presented as mean±SEM of values obtained from indicated number of patient samples or experiments. To test for significant differences between means, nonparametric Mann Whitney test was employed using STAT view 4.1 (Abacus Concepts, Inc, Berkley, CA). P values < .05 were considered significant.
Results
Specificity and Sensitivity of anti-DCLK1-S antibody (PS41014) for detecting short isoform (isoform2) of hDCLK1
As described under Methods, we generated a mono-specific polyclonal antibody (Ab) (PS41014) against a multimer of the unique N-terminal peptide sequence of DCLK1-S. Isogenic clones of HEK293 cells which either expressed only the L isoform (HEKC, HEK293) or both the L/S isoforms (HEKmGAS) (12) were used. A representative colon cancer cell line, HCT116, which only expresses the S isoform, due to epigenetic silencing of the 5′ promoter (12), was also used. In order to validate the specificity of the PS41014-Ab, commercially available antibodies that either detect all isoforms of DCLK1 (Ab-31704), or detect only the L-isoform (Ab106635) were used. Data with all three antibodies is shown in Figures 1a–c. As expected, the long specific Ab detected the presence of L-isoform (~80kDa) by Western Blot (WB) analysis of the lysate samples prepared from HEKC and HEK293 cells (Fig 1a). Since human colon cancer cell lines (hCCCs), including HCT116, do not express the L-isoform, the long specific Ab did not detect the S-isoform in HCT116 cells, further validating our previous findings demonstrating presence of only the S-isoform in the majority of hCCCs (12). The L-specific Ab, however, did detect a smaller band in HEKmGAS cells, which may represent a fragment of the C-terminal end of L-isoform, since the long specific Ab was generated against an epitope within the C-terminal double-cortin domains of L-isoform. The same cellular samples were next probed with the common Ab, which detects both the L/S isoforms, as shown in Figure 1b. The common antibody confirmed presence of L-isoform in the two normal cell lines, S-isoform in HCT116 cells, and both S/L isoforms in HEKmGAS cells, as expected (Fig 1b). The common antibody, like the long specific Ab, detected other bands of proteins in these cell lines, which either represent degraded fragments of L-isoform or cross-reactivity with other unknown proteins. The short specific Ab generated by us, detected only one band of S-isoform with the expected molecular mass (47KDa), and did not detect any protein bands in normal epithelial cell lines (HEK293, HEKC) (Fig 1c), validating the specificity of PS41014-Ab. For results presented in Figures 1a–c, equivalent concentration of the three antibodies was used (~5ng/ml) for detecting DCLK1 isoforms in 50μg of the total cellular lysates. Thus, PS41014-Ab represents the only antibody generated, which specifically detects S-isoform of DCLK1 (isoform 2), without cross-reacting with L-isoforms of DCLK1, to the best of our knowledge.
Figure 1. Specificity of PS41014-Ab for detecting DCLK1-S.
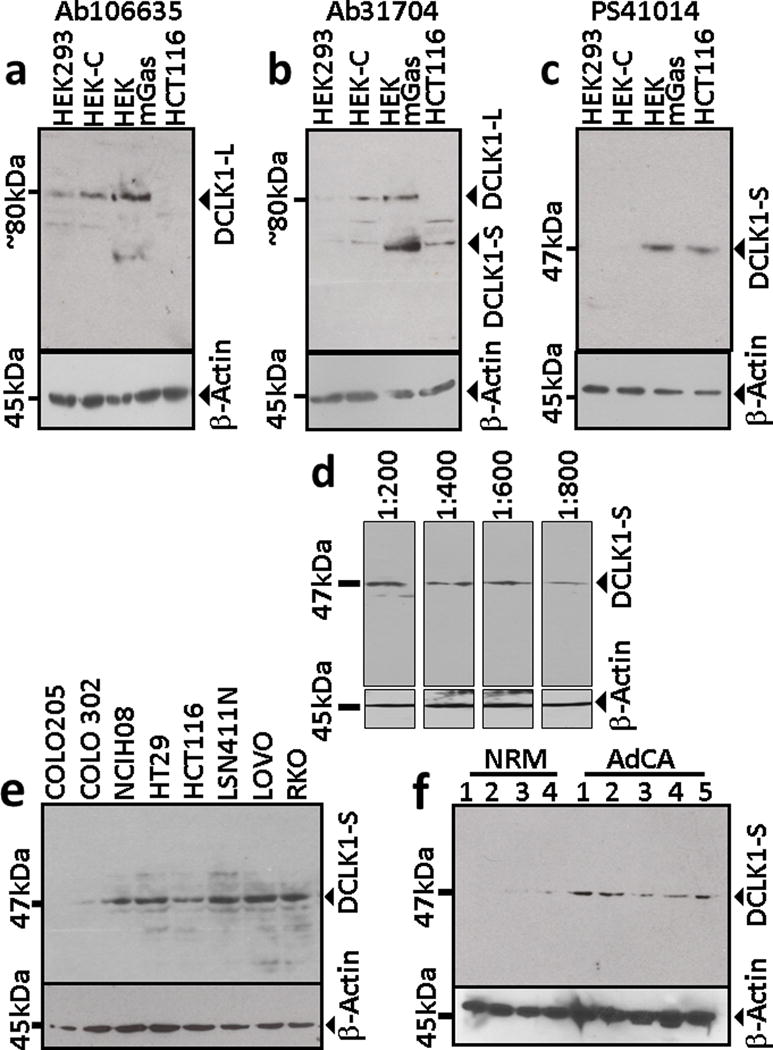
Cellular lysates were prepared from several cell lines or tissue samples and processed for Western Blot (WB) analysis with antibodies, which either detects only the L-isoform of DCLK1 (a), using the commercially available Ab (Ab106635), or detects both the L/S isoforms of DCLK1, using Ab31704 (b), or using the S specific Ab (PS41014), generated by our laboratory (c–f). The cellular lysates processed for WB analysis in panels a–c were from the indicated cell lines. Representative WB data from cellular lysates of HCT116 cells, used at the indicated dilutions, are shown in panel d. Representative WB data from the indicated human colon cancer cell lines are shown in panel e. Representative data from either normal colonic mucosa (NRM) or adenocarcinoma (AdCA) patient samples are presented in panel f; the corresponding patients from whom the NRM and AdCA samples were obtained are listed in Supplementary Table IA. The PS41014-Ab used in panels c–f, detected a single band of 47kDa protein, unlike the commercially available Abs, which appeared to also detect degraded fragments of the L isoform (a,b). Relative levels of β-actin were measured in the same samples, as a loading control, and are shown in panels a–f.
We next characterized sensitivity of PS41014-Ab for detecting DCLK1-S protein in cellular lysates of HCT116-cells (Fig 1d). The PS41014-Ab detected DCLK1-S in HCT116-cells at different dilutions ranging from 1:200 (12.5ng/ml) to 1:800 (3.1ng/ml) (Fig 1d). At concentrations lower than 1:800, the detection of DCLK1-S was significantly reduced (data not shown). Based on the results presented in Figure 1d, an optimal dilution of 1:500 (5ng/ml) of PS41014-Ab was chosen for WB analysis of lysate samples.
Use of PS41014-Ab for detecting DCLK1-S isoform in human colon cancer cell lines (hCCCs) and patient samples by Western Blot analysis
We have previously reported that >80% of hCCCs express DCLK1-S isoform, and none of the hCRC cell lines examined by us expressed the L-isoform, since the 5′ promoter of hDCLK1-gene is hypermethylated and epigenetically silenced in all the colon cancer cell lines (12). In the current studies we used PS41014-Ab to confirm presence/absence of DCLK1-S in CRC cell lines, previously reported to be either positive or negative for the S-transcript (12). Representative data from eight cell lines are presented in Figure 1e. Seven cell lines which express S-transcript (12) were positive for the S-protein band; COLO205 cells, negative for DCLK1-S transcript (12), were negative for S-protein (Fig 1e). Isogenic clones of COLO205 cells, were developed to overexpress either the S or L isoform, (as described in Methods), and used for further validation of the PS41014-Ab, by western blot analysis of lysates from the clones (Supplementary Fig 2). WB data with the PS41014-Ab, presented in Supplementary Figure 2, confirmed that the S-specific-Ab only detects the S-isoform in the COLO205-S-GFP clones, as described above; the Ab did not detect intact or degraded fragments of the L-isoform in COLO205-L-GFP clones, even though the L-isoform was being over-expressed in a colon-cancer-cell line, providing strong evidence that the PS41014-Ab is specific for the S-isoform. Importantly, the PS41014-Ab did not detect any proteins in the control COLO205-C-GFP clones, confirming the specificity of the antibody generated by us (Supplemetary Fig 2).
We next examined if PS41014-Ab efficiently detects the S-protein in lysates of patient samples (Fig 1f). We had previously used the common antibody (Ab-31704) for detecting DCLK1-isoforms in the same lysates, prepared from normal colonic mucosa and CRC samples of patients, and reported the presence of only the L-isoform (82KDa) in the selected normal samples, and the presence of only the S-isoform (47KDa) in the AdCA samples (12). In the current studies, PS41014-Ab did not detect any band in the normal colonic mucosal samples (Fig 1f), confirming the absence of S-isoform in normal colons. The AdCA samples from CRC patients, on the other hand, were positive for variable levels of the S-isoform (Fig 1f), as previously reported with the common antibody (12), validating the specificity of PS41014-Ab for the S-isoform (isoform 2), with no cross-reactivity with the L-isoform (isoform 1). Having validated the use of PS41014-Ab for specifically detecting S-isoform of DCLK1 by WB analysis, we next examined its usefulness for detecting the S-isoform by immunohistochemical (IHC) analysis.
IHC results with PS41014-Ab are more accurate than IHC results with Ab31704, for detecting DCLK1-S expression in patient samples
Normal colonic mucosal (NRM) samples mainly express the canonical L-isoform of DCLK1, while colonic AdCAs mainly express the S-isoform, with rapid loss/gain of DCLK1-L/S, respectively, in adenomas (Ads) (12). Samples of NRM, Ads and AdCAs from several patients (Supplementary Table I) were obtained as described in Methods, and FFPE samples processed for IHC analysis with Ab31704; representative data from NRM/Ad/AdCA samples are presented in Figure 2a. Ab31704 detected DCLK1 (likely DCLK1-L) in a few colonic crypt epithelial cells, but surprisingly also stained some unknown cells in the surrounding matrix of normal crypts (Fig 2a). A significantly higher percentage of cells in Ad samples were positive for DCLK1, but once again Ab31704 detected DCLK1 in surrounding cells in the matrix. Both the intensity and the % area of cells positive for DCLK1 was increased in AdCA samples, and the presence of DCLK1+ve cells were once again detected in the surrounding matrix, using the 31704-Ab (Fig 2a). Five separate areas of each section/slide × 2 slides/sample, was analyzed by Image J, and converted to a red scale. The red scale intensity represents the actual staining of the samples after normalizing the color intensity, by filtering the background noise. The percent area stained for each sample was calculated as described in Methods, and data from all the samples analyzed is presented as a box plot in Figure 2b. The number of samples (n) is shown. The gender, age and ethnicity of the patients from whom these samples were obtained are shown in Supplementary Table I. On an average, the percent area stained with the Ab31704 increased significantly in Ad vs normal samples and in AdCA vs normal and Ad samples.
Figure 2. Immunostaining of patient samples with Ab31704.
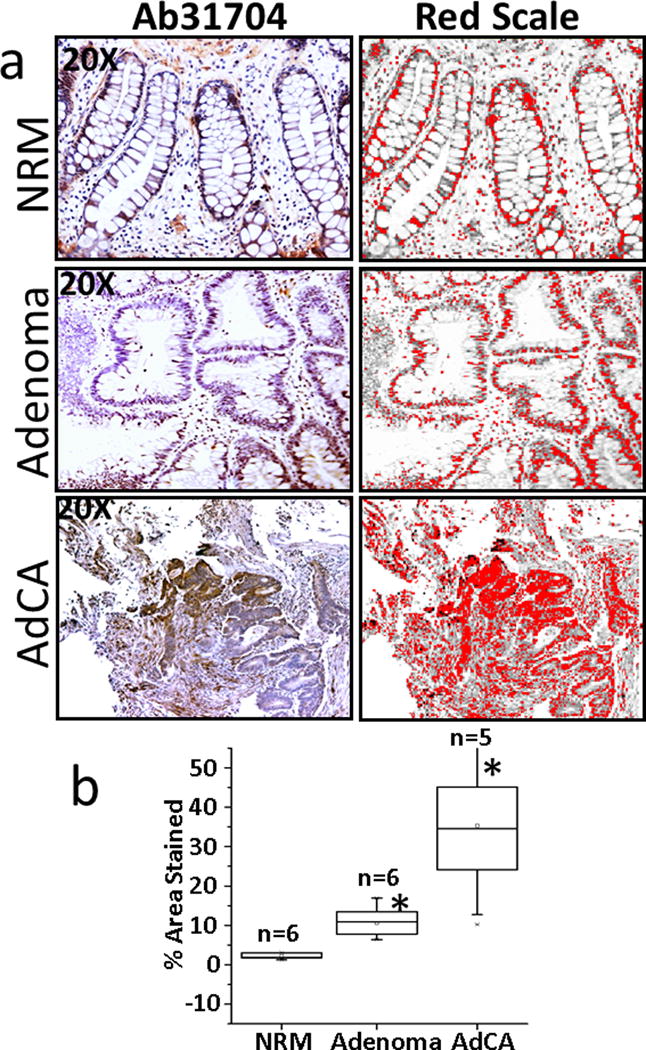
Formalin fixed paraffin embedded (FFPE) samples from either the normal colonic mucosa (NRM), adenomatous polyps (Ads) or adenocarcinomas (AdCAs) were obtained from the colons of patients, as described in Methods, and the patient associated information is provided in Supplementary Table IB. Staining of representative sections of NRM, Ad and AdCA is presented in a. The staining data was analyzed by Image-J, and specific staining converted to the red scale (right-hand side panels) for quantifying the data, as described in Methods. The % areas stained of the sections from all the patient samples analyzed are presented as box plots in panel b. The number of patient samples (n) analyzed are shown for ea group. *=P<0.05 vs normal values.
We next used PS41014-Ab for staining the patient samples (Fig 3). Representative IHC data from one sample each is presented in Figure 3a. Unlike the results with Ab31704, neither the epithelial component nor the mesenchymal (matrix) component of the normal colonic mucosal samples stained for DCLK1 with the PS41014-Ab, confirming specificity of the antibody, and the absence of S-isoform in all cell types present within the normal colonic mucosa (Fig 3a). The AdCA samples were variably positive for the short isoform (Fig 3a). The % area stained was calculated for all the samples, as described above, and is presented as box plots in Fig 3b. Unlike the data with Ab31704, none of the normal samples examined demonstrated staining for DCLK1-S with the PS41014-Ab, strongly validating the specificity of the antibody generated by our laboratory. Importantly, we learned from the current studies that DCLK1-S is not expressed by non-epithelial cells, both in the normal colonic mucosa and in the tumors (Ads/AdCAs) (Fig 3a). However, data with 31704-Ab strongly suggests that DCLK1-L is likely expressed by non-epithelial cells, such as neuronal cells, known to express DCLK1-L (36,37), and perhaps other, as yet, unknown cell types. On an average, DCLK1-S staining with PS41014-Ab, significantly increased in Ads/AdCAs vs normal samples, in the order of AdCAs>Ads>normal mucosa. On an average, the staining of AdCAs with PS41014-Ab, was lower than that with Ab31704 (Fig 2b vs Fig 3b), suggesting the possibility that Ab31704 maybe detecting increased expression of the L-isoform in non-epithelial component of AdCA samples; the latter is an intriguing possibility which needs to be further examined. It is, however, important to state that while the NRM samples examined with the common Ab31704 and S-specific PS41014-Ab (Figs 2,3) were identical, the Ad/AdCA samples were from different patients, due to limited availability of sample size. Thus based on our findings so far, results with PS41014-Ab are expected to provide more accurate information regarding relative expression levels of the S-isoform (specifically expressed by CSCs), at different stages of colon-carcinogenesis, while results with the common antibody (Ab31704) will include detection of L-isoform in normal epithelial cells and other, as yet, unknown cells in the matrix of colonic mucosa. Accurate assessment of relative expression of DCLK1-S by Ad/AdCA samples is important, since we have previously reported that patients expressing high levels of DCLK1-S transcript had an overall worse prognosis than patients expressing relatively low levels of the S-transcript (12). On the other hand, relative expression levels of L-transcript (isoform 1) were not associated with overall survival of the patients (unpublished data from our laboratory). Since, our studies strongly suggest that the L-isoform is not expressed by CSCs, but is expressed by normal epithelial cells and other unknown cell types, it is not surprising that relative levels of L-isoform did not correlate with survival of CRC patients.
Figure 3. Immunostaining of patient samples with PS41014 antibody.
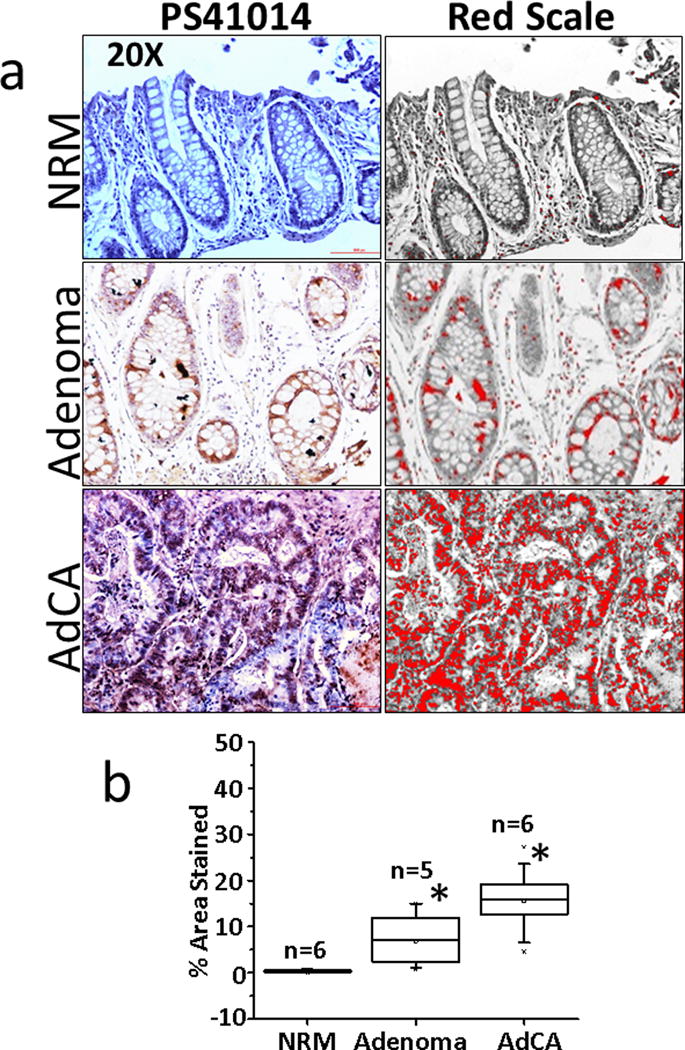
Patient samples from either normal colonic mucosa (NRM), adenomas (Ads) or adenocarcinomas (AdCAs) were obtained as described above and immunostained with PS41014-Ab, as described in Methods. IHC staining of representative sections are presented in a, with red scale conversion of specific staining (right-hand side panels). The patients from whom NRM/Ad/AdCA samples were obtained are listed in Supplementary Table IB. The % area stained of the sections, from all the patient samples, was quantified using the red scale method and is presented as box plots in panel b. The total number (n) of patient samples analyzed are shown for each group. *=P<0.05 vs normal values.
Even though the short isoform is >98% homologous with the C-terminal end of the long isoform (12), the S-isoform lacks the double-cortin domains which is required for binding microtubules (36,37). In preliminary studies, we recently reported that colon cancer cells overexpressing the S-isoform were significantly more invasive than isogenic cells overexpressing the L-isoform (38). We therefore hypothesized that the sub-cellular localization of the S-isoform may be different from that of the L-isoform, and examined localization of the two isoforms by electron microscopy (EM) of isogenic colon cancer cells which overexpressed GFP tagged L- (COLO205-L-GFP) or S-isoform (COLO205-S-GFP); control clones expressed GFP from the control vector (COLO205-C). COLO205 colon cancer cell line was chosen for these experiments, since it is one of the few hCCCs which does not express either L or S isoform (12), and can be cloned to express either isoform, as described above. Both the specificity of PS41014-Ab and differences in sub-cellular localization of the two isoforms was examined by EM, as described below.
Specificity of PS41014-Ab for detecting DCLK1-S in colon cancer cells by immuno-electron microscopy (IEM)
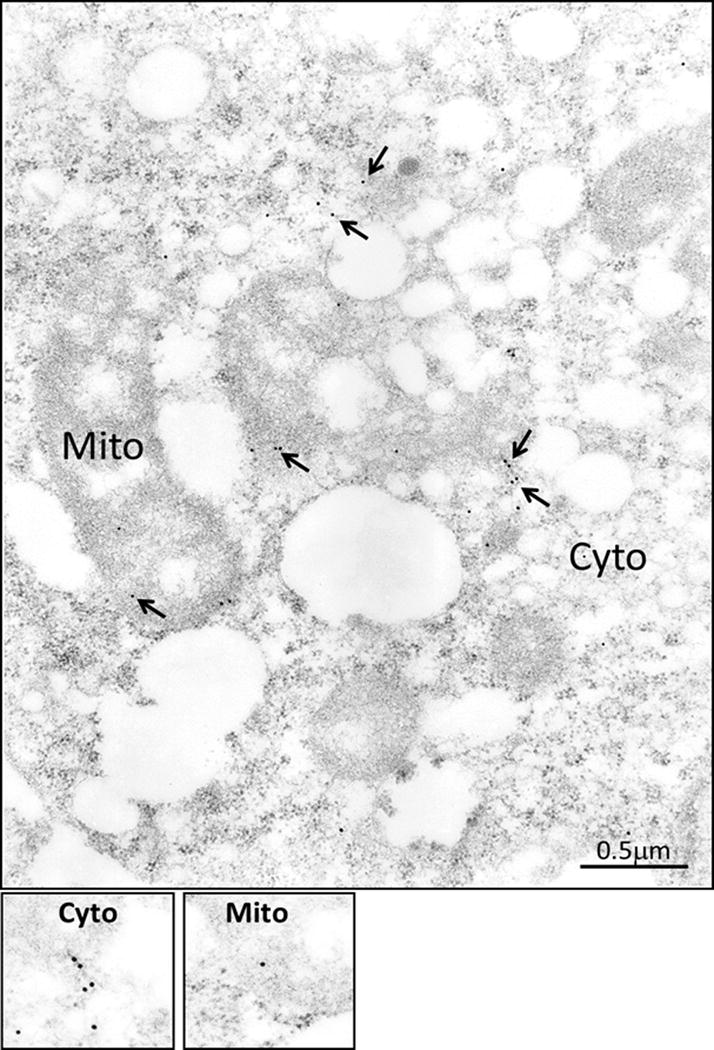
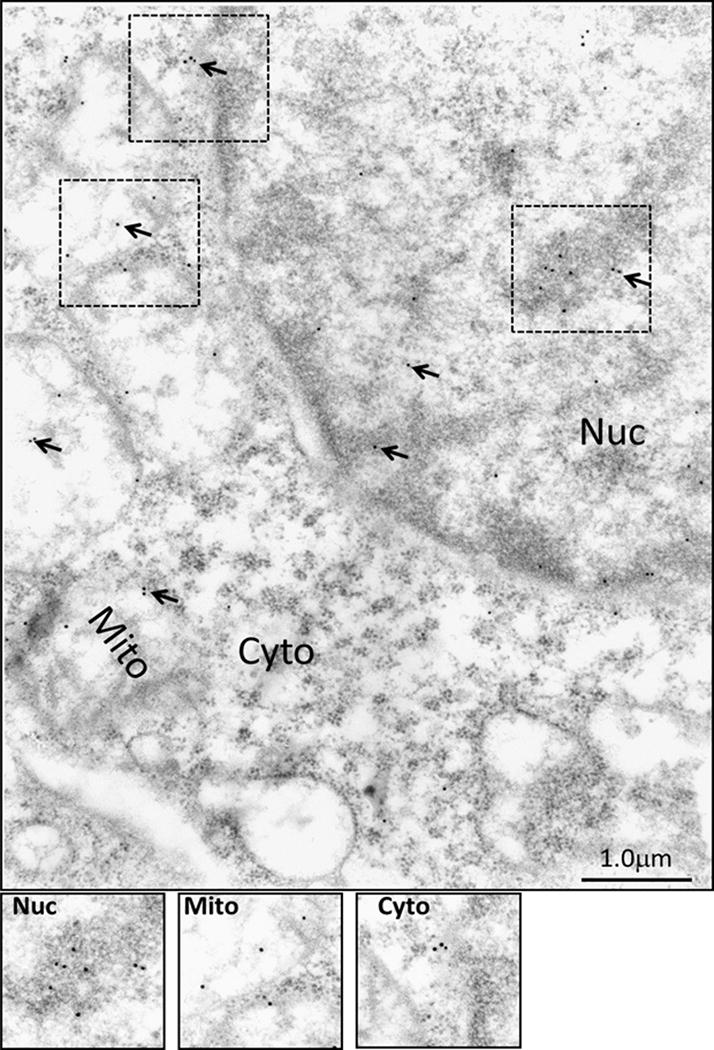
In order to further confirm the specificity and usefulness of PS41014-Ab for detecting the presence of DCLK1-S by IEM, PS41014-Ab was first used for IEM staining of an S-expressing cell line (HCT116) (Fig 4). Surprisingly, we discovered that DCLK1-S is not only present on plasma membranes (P.Memb) and within cytosol (Cyto) of HCT116 cells, but is also present in the nucleus (Nuc) and mitochondrial (Mito) fractions of the cells (Fig 4). In order to visualize the staining better, the indicated insets in the various sub-cellular fractions of the cells have been computer enhanced and shown at the bottom of Figure 4. The COLO205-C-GFP cells (which do not express either S/L isoform of DCLK1) (12), on the other hand, were negative for DCLK1-S staining with the PS41014-Ab (Supplementary Fig 2). Similarly the HEK293 cells which only express the L-isoform were negative for staining with PS41014-Ab, using the IEM method (data not shown). We next examined possible differential sub-cellular localization of L vs S isoforms using IEM, as described below.
Figure 4. Immuno-electron microscopic (IEM) analysis of staining for DCLK1-S in sub-cellular fractions of HCT116 cells, using PS41014-Ab.
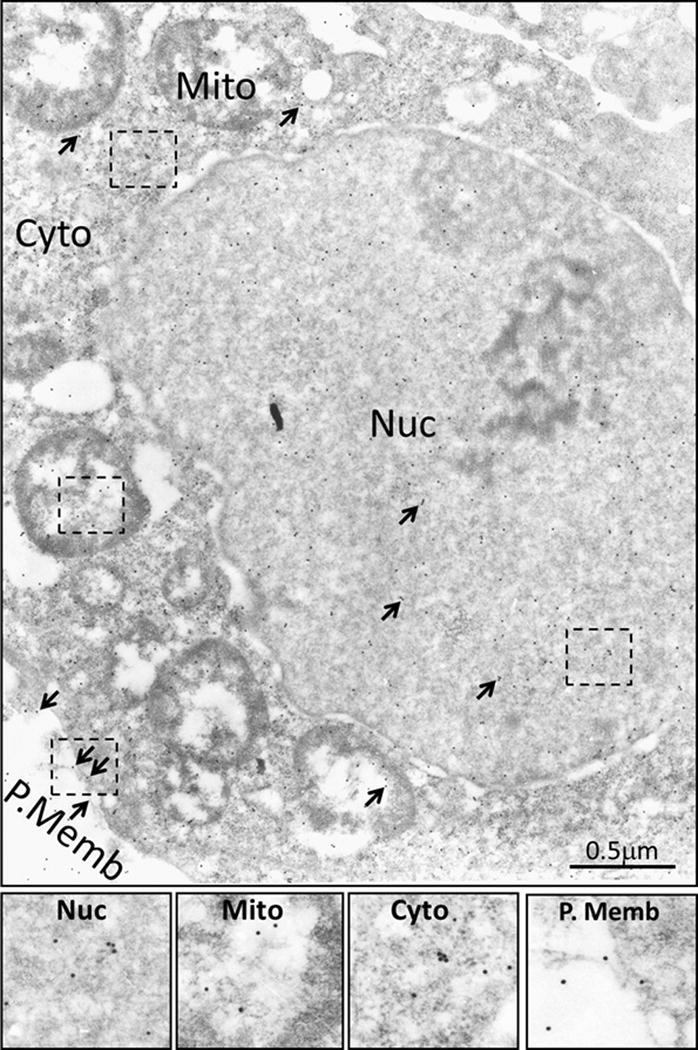
HCT116 cells were processed for IEM analysis as described in the Methods section, using PS41014-Ab. Gold labeled second antibody was used for detecting PS41014-Ab, bound to DCLK1-S in the cells. Arrows demonstrate the presence of DCLK1-S staining in sub-cellular fractions of nucleus (Nuc), mitochondria (Mito), cytosol (Cyto) and plasma membranes (P.Memb). The boxed insets, shown within the dotted outline in the different sub-cellular fractions were computer enhanced, and are presented at the bottom panels for clarity.
The DCLK1-S isoform localizes to the nucleus and mitochondrial fractions of the cells at significantly higher levels than the DCLK1-L isoform
In order to accurately define differences in the sub-cellular localization of L vs S isoforms, rather than using PS41014-Ab (which can only detect the S-isoform), we used anti-GFP-Ab, for IEM analysis. The anti-GFP-Ab was first used to confirm expression of the L vs S isoforms of DCLK1 in the isogenic clones of COLO205 cells (Fig 5a). COLO205-L-GFP clones expressed the expected molecular mass (~110KDa) of DCLK1-L protein fused to GFP. The COLO205-S-GFP clones expressed the expected molecular mass (~84KDa) of S protein fused to GFP. The control clones (COLO205-C-GFP) expressed GFP alone with the expected molecular mass of ~36KDa (Fig 5a). GFP-Ab was next used for IEM analysis of the three isogenic clones, and the data are presented in Figures 6–8. At least ten separate cells from each clone were analyzed for quantifying the relative localization of L vs S isoform in sub-cellular compartments of nucleus, mitochondria, cytosol and plasma membranes, and the data from all the sections is presented as bar graphs in Figure 5b. Based on the results presented in Figures 5–8, it can be stated with some confidence, that the S-isoform likely accumulates in the mitochondrial and nuclear compartments at significantly higher concentrations (levels) than the L-isoform, while the localization of the S-isoform appears to be significantly reduced on the plasma membranes of the cells, compared to that of the L-isoform. Similarly, in neuronal cells, cleavage of DCLK1-L protein by calpain, was reported to result in the preferential localization of the shorter cleaved protein (lacking the double-cortin domains) to the nucleus of the cells, unlike the intact protein (31), resembling our findings with the S-isoform. Localization of the DCLK1 proteins to the mitochondria, however, has not been reported previously. Many of these differences may reflect the differences in the concentration of microtubules in these various sub-cellular fractions, since the L-isoform binds microtubules (36,37). As expected, the overexpressed GFP appears to mainly localize within the cytosol fraction of the COLO205-C-GFP clones (Fig 5b,6), providing further validation for the observed presence of S/L isoforms in several organelles within the cells, unlike the control GFP protein.
Figure 5.
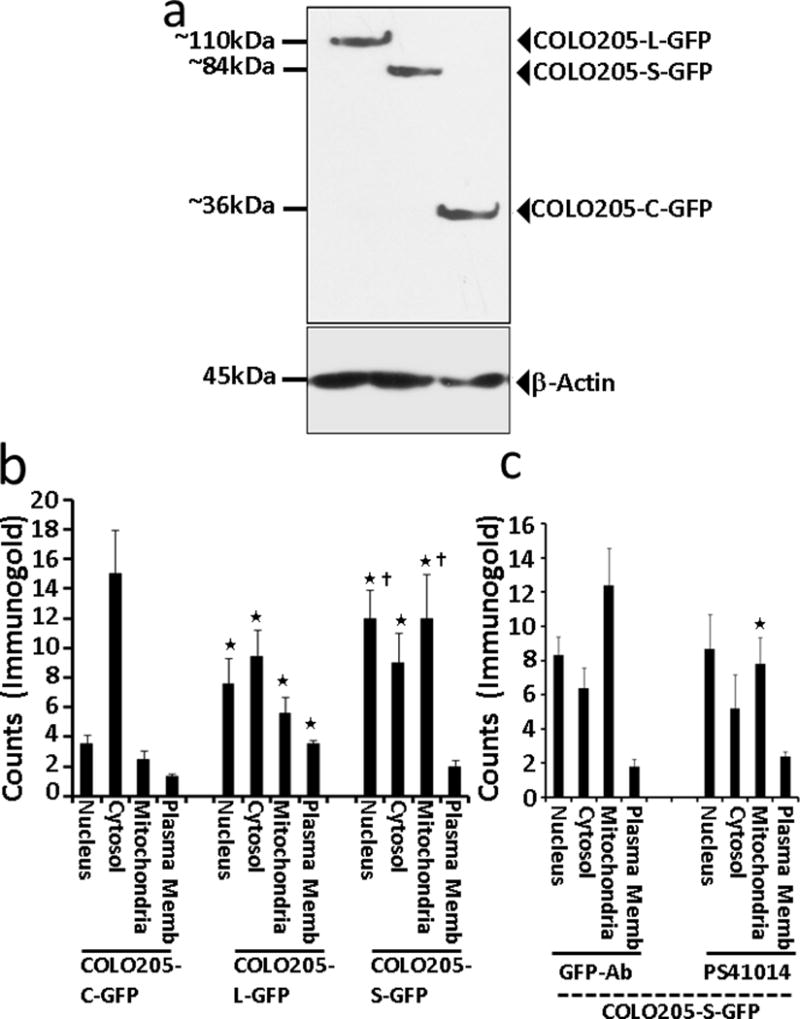
(a) Western Blot confirmation of COLO205 clones, expressing GFP-tagged DCLK1-L/S isoforms, with the expected molecular mass of 110 and 84kDa, respectively, as shown. The control clones (COLO205-C-GFP) demonstrated only the expression of GFP (~36kDa). The corresponding β-actin levels in the cellular lysates of the indicated clones is shown at the bottom of the WB panel. GFP-antibody was used for WB analysis of the clones. (b) Sub-cellular distribution of L vs S isoforms of DCLK1, as analyzed by IEM. The colon cancer cell line, COLO205, which does not express either the L or S isoform of DCLK1, was sub-cloned to express either the L or S isoforms of DCLK1, fused with GFP, and processed for IEM analysis using anti-GFP-Ab, and detected with the gold labeled second antibody, as described in the Methods section; control clones expressing only GFP (COLO205-C-GFP) were similarly processed. Several sections of the IEM processed clones were analyzed for calculating the relative distribution of the immune-gold labeled proteins in the four sub-cellular fractions of nucleus, cytosol, mitochondria and plasma membranes (P.Memb). The data from at least 10–20 separate cells, from 3–4 separate sections are presented as Mean±SEM of counts/cell from each sub-cellular fraction from each clone. *=P<0.05 vs corresponding control values from COLO205-C-GFP clones. Ϯ=P<0.05 vs the corresponding values from the COLO205-L-GFP clones. As can be seen, the S isoform was more heavily located in the nucleus and mitochondria of the cells compared to the L isoform while lower levels of DCLK1-S vs -L were observed to be associated with plasma membranes of the cells. (c) Comparison of the sub-cellular localization of DCLK1-S by IEM analysis using either GFP-Ab or PS41014-Ab. The COLO205-S-GFP clones were processed for EM analysis, and the sub-cellular localization of DCLK1-S was detected by using either GFP or PS41014-Ab as indicated. The relative localization of DCLK1-S in the sub-cellular fractions was counted as described above, and the data from the total number of cells analyzed is presented as Mean±SEM in each bar graph. Other than the mitochondrial fraction, the sub-cellular localization of DCLK1-S was similar, whether detected with GFP-Ab or PS41014-Ab. The slightly higher detection of DCLK1-S in the mitochondrial fractions with GFP-Ab, compared to PS41014-Ab may reflect the fact that GFP was fused at the N-terminal end of DCLK1-S, which may have masked the binding of PS41014-Ab to the unique amino acid epitope of the S-isoform at the N-terminal end.
Figure 6. Sub-cellular localization of control GFP protein in COLO205-C-GFP clones by IEM analysis with GFP antibody.
The control COLO205 clones were processed for IEM analysis, as described in the legend of Figure 4, but GFP-Ab was used as the primary antibody. The control GFP protein was for the most part present in the cytosolic fraction, as can be appreciated from the quantitative data presented in Figure 5b.
Figure 8. Sub-cellular localization of DCLK1-S isoform in COLO205-S-GFP clones, stained with GFP antibody.
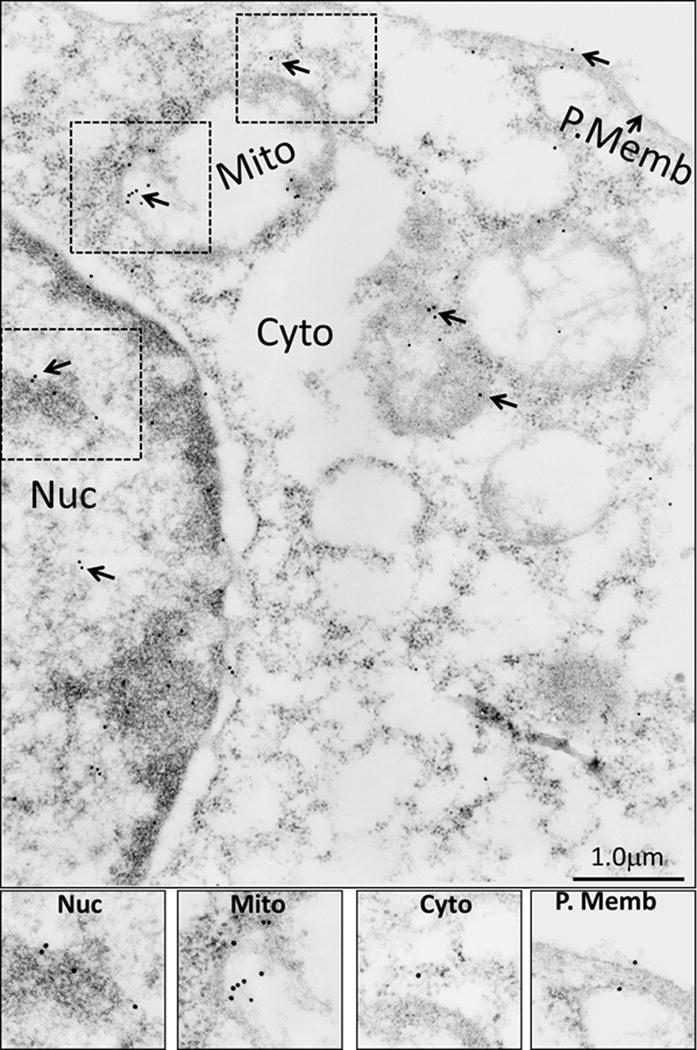
The COLO205-S-GFP clones were processed for IEM analysis with GFP-Ab as described in the legend of Figure 6, and the insets demonstrating the presence of DCLK1-S in the different sub-cellular fractions is enhanced and presented at the bottom of the figure. The relative distribution of DCLK1-S isoform was quantified as described in the legend of Figure 5b, and is presented as bar graphs in Figures 5b and c.
COLO205-S-GFP clones were also processed for WB analysis (as discussed above), and IEM analysis using the PS41014-Ab. Data from IEM studies with PS41014-Ab are presented in Figure 9, and once again demonstrate that PS41014-Ab detected the presence of S-isoform in all four sub-cellular fractions. The bar graph in Figure 5c compares the detection of S-isoform with either the GFP-Ab (Fig 8) or PS41014-Ab (Fig 9). As can be seen, the sub-cellular distribution of the S-isoform was similar in the sub-cellular fractions of COLO205-S-GFP clones, using either antibody (Fig 5c), further validating the specificity of PS41014-Ab for IEM analysis as well. For reasons unknown, the PS41014-Ab does not detect S-isoform by immunofluorescence (IF), and we are in the process of optimizing the conditions for using this antibody for other applications. The PS41014-Ab, however, was very useful for immunoprecipitation of the S-isoform, along with its many binding partners, as confirmed by proteomic analysis (unpublished data from our laboratory). The optimal concentrations of the PS41014-Ab required for detecting the S-isoform in different assays is presented in Supplementary Table II.
Figure 9. Sub-cellular distribution of DCLK1-S in COLO205-S-GFP clones by IEM analysis with PS41014-Ab.
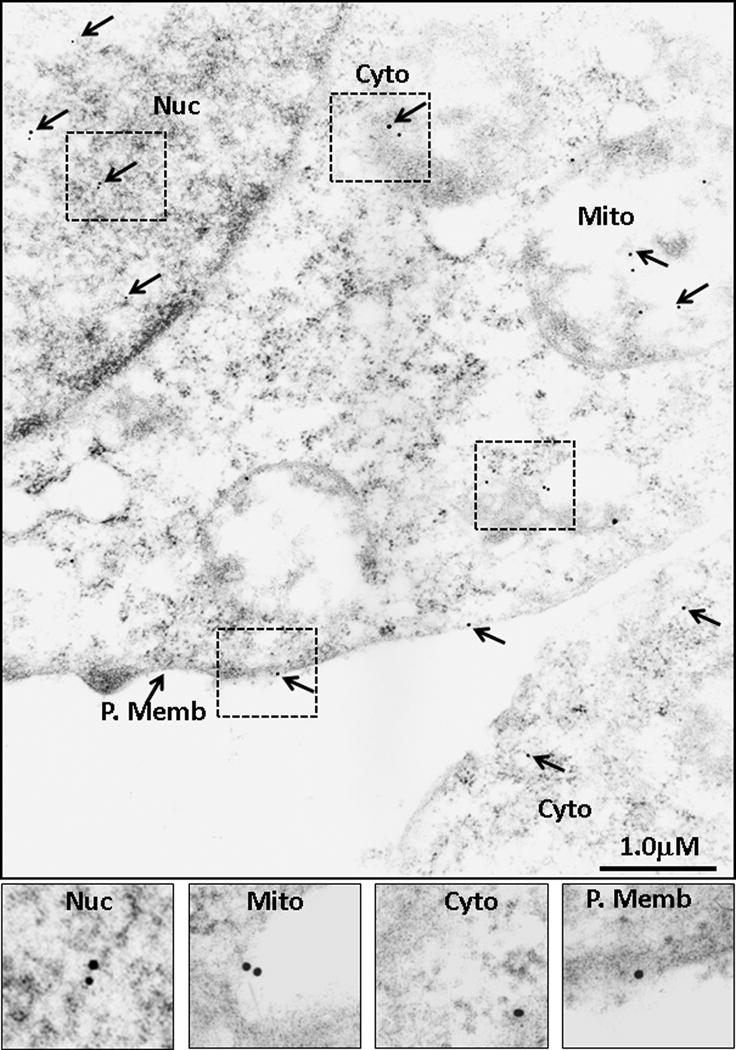
The COLO205-S-GFP clones were processed for IEM analysis with PS41014-Ab as well, in order to compare the relative distribution of staining with either the GFP or PS41014-Ab. The insets from the different sub-cellular fractions are amplified and presented at the bottom of the figure, and the relative distribution of DCLK1-S, using either one of the two antibodies is presented in Figure 5c.
Since the PS41014-Ab was specific for the S-isoform, and specifically marked CSCs, we hypothesized that higher levels of S-isoform (CSCs) at the early stages of polyp growths may allow identification of high-risk patients, who maybe at risk of developing CRCs within shorter time periods. As proof of principle, we conducted a pilot retrospective study, and assigned patients to either low- or high-risk arms of the study, as described in Methods, and examined possible differences in the expression of S-isoform in the polyps of high vs low-risk patients, as described below.
The benign/pre-malignant growths (Hps/Ads) at initial and follow-up colonoscopies, from the high-risk patients express significantly higher levels of DCLK1-S compared to polyps from low-risk patients
As a pilot study, polyps from initial and follow-up colonoscopies were obtained from high- vs low-risk patients as described in Methods. The age, gender and ethnicity of all the patients, whose samples were obtained from the Department of Pathology as FFPE blocks, are presented in Supplementary Tables IIIA,B. The type of polyps and size (whenever available), at the time of initial and subsequent follow-up colonoscopies, are also presented in Supplementary Tables IIIA,B. The FFPE blocks were processed for making slides with two/three sections per slide by routine histological methods, as published previously (32,33), and stained with PS41014-Ab as described in Methods. Representative IHC data from polyps of representative patients at initial and follow-up colonoscopies from the low- and high-risk groups are presented in Figures 10a and 10b, respectively. The staining data from all the patients was quantified by either, 1) image J and red scale method, described above, and presented as % area stained in Figure 10c, or 2) by counting % epithelial cells stained, wherein at least 300 cells were counted per sample at 40×, and data presented as % cells stained in Figure 10d. The total number (n) of polyps analyzed in the high- and low-risk patients (as shown in Supplementary Tables IIIA,B) per colonoscopy are shown above each bar graph (Fig 10 c,d). At each colonoscopy, the % area/cells stained per polyp were significantly higher in the high-risk vs the low-risk patients (P<.05 vs data presented in the corresponding green bars in Fig 10c and d). At least two or more polyps were analyzed per colonoscopy from each patient for data presented in Figures 10c,d. Data from all the polyps obtained at each colonoscopy, from a representative patient in the high- and low-risk groups, are also presented in Figure 10e, in order to demonstrate the stark difference the staining pattern of the polyps at each subsequent colonoscopy for high- vs low-risk patients. The pattern of staining suggests that: % staining of polyps from the low-risk group remains at baseline levels at each follow-up colonoscopy, and may even decrease with advancing age; staining of polyps from the high-risk patients, on the other hand, trends higher at each subsequent colonoscopy (Fig 10e). Importantly the % staining of the polyps in the high-risk patients was at least 2–3 fold higher than that in the polyps from low-risk patients at all time points, and resemble the levels of staining measured in AdCA samples (~20%), as shown in Figure 3. The data presented in Figure 3 was obtained from Ads at the time of screening colonoscopies, in a prospective study, with no knowledge of whether these patients developed AdCAs in their lifetime. Thus the % staining of Ads in Figure 3 likely represents staining from both low- and high-risk patients, overlapping with AdCA staining data (Fig 3), unlike the data presented in Figure 10, which separates the staining of Ads in the two groups. Thus based on data presented in Figure 10, on an average, the % area stained in the polyps of the low-risk patients ranged from <1% to ~ 10%, with an average of ~5%. The % staining of the polyps from high-risk patients, on the other hand, ranged from ~10% to 30–40% with an average of ~20%. These findings suggest, for the first time, that the PS41014-Ab can be used at the time of index/screening colonoscopy for assigning low- or high-risk to the patients, irrespective of the size/number and morphology of the polyps, as currently used for recommending follow-up colonoscopies. For example, even though patient #246 (Supplementary Table IIIA) from the low-risk group had frequent colonoscopies, the polyps remained poorly positive for DCLK1-S, all through the follow-up colonoscopies (Fig 10e). On the other hand, patient #254 (Supplementary Table IIIB) from the high-risk group developed AdCAs within10 years, even though at the time of initial colonoscopy in 2006, the patient was not classified as a high-risk patient based on number/morphology and pathology of the polyps, discovered at that time. Thus the additional use of the PS41014-Ab for IHC staining of the resected polyps at the time of screening colonoscopy will help guide the physicians for more accurate follow-up recommendations, and serve as an important prognostic biomarker at an early stage of the disease, at a time when there are no other available serum or fecal markers which can help identify presence of CSCs and help assess the risk of the patients for developing CRCs. The results in Figure 10 additionally suggest that the resection of polyps in the low-risk group, especially during initial colonoscopies, appears to provide significant protection to the patients from developing advanced growths in their lifetime, while resection of the polyps during colonoscopies in patients at high-risk, does not, by itself, provide protection to the patients from developing AdCAs. It may therefore be important to not only resect all polyps at early stages in both the low- and high-risk groups, but also to identify high-risk patients at an early stage and perhaps use additional preventative strategies for protecting the high-risk patients from developing advanced growths within shorter intervals. Identification of CSC populations, using the PS41014-Ab may allow the identification of high-risk patients at a very early stage, and give an opportunity to develop preventive and interventional strategies for these patients.
Figure 10. Relative levels of DCLK1-S staining in the adenomas from low- vs high-risk patients in a pilot retrospective study.
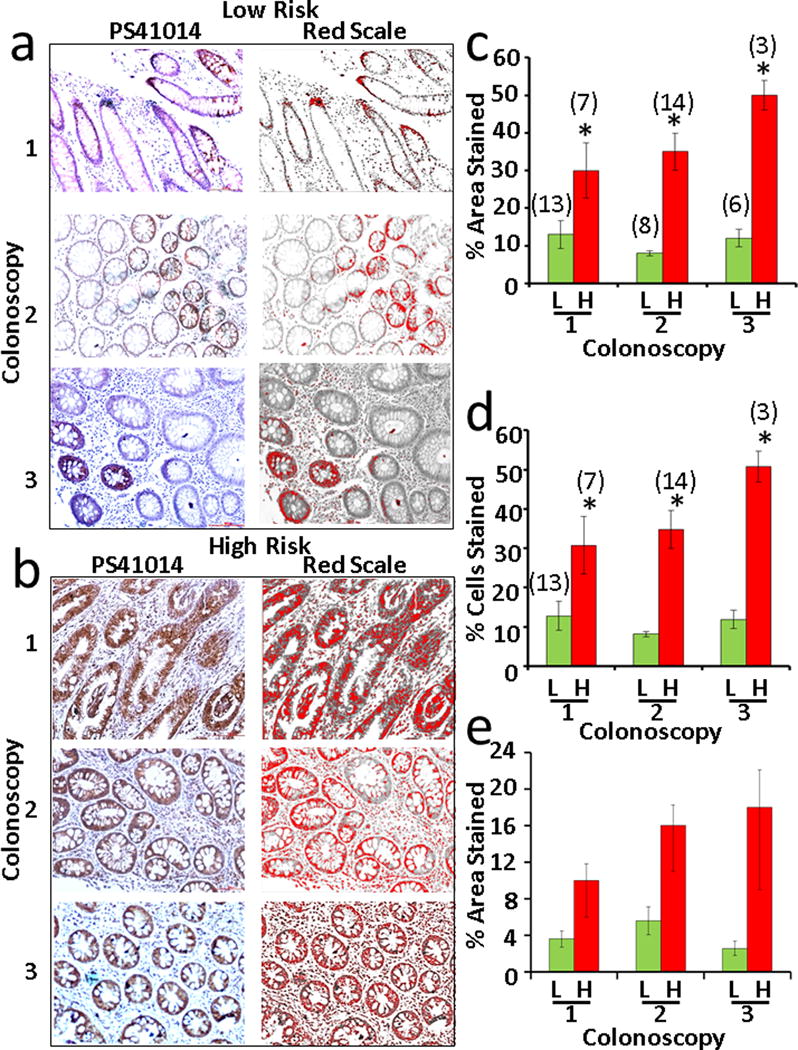
Patients who had multiple colonoscopies at UTMB were separated in the two groups of low- vs high-risk, based on the absence or formation of AdCAs in the colon, within 10 years of initial colonoscopy, as described in the Methods section. Available FFPE samples of adenomas, from the identified patients (Supplementary Tables IIIA,B), from the initial colonoscopy and follow-up colonoscopies were obtained as described in the Methods section and processed for IHC staining with PS41014-Ab. IHC staining of representative polyps from a patient, that were removed at initial colonoscopy (colonoscopy #1) and subsequent follow-up colonoscopies (colonoscopies #2 and 3) are presented in panels a (representative low-risk patient) and b (representative high-risk patient). The red scale conversion of the specific staining data is shown in the right hand panels. The staining data from the total number (n) of polyps from the indicated patients in Supplementary Table III are presented as either % area stained (bar graphs in c) or % epithelial cells stained (bar graphs in d), wherein the data from the low-risk patients is compared to the data from high-risk patients at colonoscopy #s1–3. The total number of polyps analyzed is presented at each time-point at the top of each bar graph (c,d). The data in each bar graph is the Mean±SEM of the indicated number (n) of samples. *=p<.05 between corresponding data for low risk patients (green bars) in c and d. The data for all the polyps from a single representative patient, at each colonoscopy for a low-risk and a high-risk patient, is also presented as bar graphs in e.
Discussion
Based on the results of the current study we report generation of a unique mono-specific polyclonal antibody (PS41014) against the short (S) isoform (isoform 2) of DCLK1, which specifically marks cancer stem cells (CSCs) in adenomas (Ads) and adenocarcinomas (AdCAs) of human colons. The specificity of the antibody (Ab) for detecting only the short isoform, with no cross-reactivity to the canonical long (L) isoform of DCLK1, was demonstrated by using isogenic clones of either human embryonic epithelial cells (HEK-C, HEKmGAS) or human colon cancer cells (hCCCs) (COLO205-S, COLO205-L), which either expressed the L or S isoform of DCLK1 (Fig 1,5). The specificity of PS41014-Ab for detecting DCLK1-S was further confirmed by screening several hCCCs. We have previously reported that none of the hCCCs screened by us expressed DCLK1-L (isoform 1), while ~80% expressed DCLK1-S, and 10-20% (including COLO205) did not express either L/S isoforms (12). In the current studies, COLO205 cells were confirmed to be negative for the presence of DCLK1-S when examined with the PS41014-Ab (Fig 1e). The specificity of PS41014-Ab for the S-isoform was further validated by Western Immunoblot analysis (WB) of normal human colonic mucosal (NRM) samples and AdCA samples from CRC patients. NRM samples were previously analyzed by qRT-PCR and reported to express only DCLK1-L (12); same samples were used in the current studies, and confirmed to be negative for the S-isoform by WB analysis with PS41014-Ab (Fig 1f). The AdCA samples, on the other hand, previously reported to express only DCLK1-S by qRT-PCR analysis (12), demonstrated a single band of ~47KDa, representing DCLK1-S in western blots, when probed with PS41014-Ab (Fig 1f). Hammond et al (39), have similarly reported the presence of only a ~47KDa DCLK1 protein in western blots of hCCCs, when probed with the commercially available Ab, which detects both L/S isoforms of DCLK1. Thus the generation of the DCLK1-S specific Ab, as reported in the current studies, will allow investigators for the first time to specifically measure the expression of DCLK1-S protein, without resorting to electrophoretic separation of the isoforms when using the common Ab.
Since both the epithelial and the extra-epithelial components of NRM do not express DCLK1-S isoform (12), the staining of the NRM samples with PS41014-Ab was almost nil (Fig 3a), further validating the use of PS41014-Ab for IHC detection of DCLK1-S. However, the commercially available common Ab against DCLK1 (which detects both L/S isoforms), stained several cells in both the epithelial and non-epithelial components of normal mucosa (Fig 2a), suggesting that DCLK1-L is expressed by other cell types, besides epithelial cells, in the normal colonic mucosa. While the PS41014-Ab stained <1% area of normal samples (Fig 3), both the common Ab (Ab31704) (Fig 2) and the commercially available Ab against the long isoform (Ab106635) (data not shown), stained ~3–6% of the normal samples.
The specificity of the PS41014-Ab was also validated for staining of the S-isoform at the EM level, by analyzing cells devoid of DCLK1-S expression (HEK-293), or by analyzing isogenic clones of COLO205 cells, engineered to overexpress either the L or the S isoform of DCLK1 (Figs 5–9). Besides establishing the specificity of the PS41014-Ab, using many different platforms for detecting DCLK1-S, with no cross-reactivity to the L-isoform, the sensitivity of the PS41014-Ab was also examined (Fig 1c; Supplementary Table II). The sensitivity of the PS41014-Ab for optimally detecting DCLK1-S in the different assay platforms, was established in terms of ngs/ml (Supplementary Table II). We were thus able to obtain significant titers of an S specific Ab in rabbits, using only the 6 unique amino acid epitope at the N terminal end of the S-isoform, even though the rest of the S-isoform was homologous with the C terminal end of the L-isoform.
An important finding of the current study was that while the S-isoform is mainly expressed by the epithelial component of Ads and AdCAs (Fig 3), the L-isoform appeared to be expressed by several cell types, including normal colonic crypt cells and other unknown cell types located in the matrix of the normal colonic mucosa/colonic tumors. Neuronal cells in the brain are known to express DCLK1-L (36,37). It thus appears likely that DCLK1-L is also expressed by enteric neurons. The specific cell types which express DCLK1-L in the non-epithelial component of either normal human colonic mucosa or colonic tumors, however, needs to be further examined.
As expected, the relative expression levels of DCLK1-S, on an average, were significantly higher in Ads of the colon, compared to that in the normal colonic mucosa (Fig 3). Similarly, relative expression levels of the S isoform, on an average, were higher in AdCAs, compared to that in Ads and normal colonic mucosa (Fig 3), suggesting that on an average, % cells expressing DCLK1-S increased in colon tumors during colon-carcinogenesis, compared to that in the normal mucosa (Fig 3). Increased expression of DCLK1 in both primary tumors and distant metastatic tumors, compared to that in the normal colonic mucosa, has been reported (28,29), using the commercially available common Ab, which however, does not distinguish between L/S isoforms of DCLK1. Since the common antibody detects both isoforms in the epithelial and extra-epithelial components of the tumors, the relative staining of Ads/AdCAs measured with the common Ab, on an average, appeared to be higher compared to that measured with the PS41014-Ab (Figs 2,3), suggesting that besides the S-isoform, the L-isoform expression may also increase in the tumors, especially at the AdCA stage, the significance of which needs to be examined.
A novel finding of the current studies was that L/S isoforms of DCLK1 were not only present in the cytosol and plasma membranes of colon cancer cells, but a significant fraction of the DCLK1 protein was found in the nuclear and mitochondrial fractions, as determined by EM analysis (Figs 4–9). HEK-293 cells, which do not express the S-isoform of DCLK1, did not stain with PS41014-Ab at the EM level (data not shown). But the PS41014-Ab stained DCLK1-S in HCT116 cells (Fig 4), validating the use of PS41014-Ab for specific detection of DCLK1-S by EM analysis, as well. An interesting finding was that the levels of S-isoform in the nuclear and mitochondrial fractions was much higher than that of L-isoform, in cancer cells, with very low presence at the plasma membranes, unlike the L-isoform (Figs 4–9). The sub-cellular localization of DCLK1-S was similar in HCT116 and COLO205-S-GFP cells (Figs 4,8), suggesting that both endogenously (HCT116) and exogenously (COLO201-S-GFP) expressed S-isoform traffics similarly and localizes within the same cellular organelles at equivalent percentages. Importantly, the PS41014-Ab demonstrated a very similar pattern of sub-cellular staining as the GFP-Ab in the COLO205-S-GFP clones (Figs 5c,8,9), once again validating the specificity of the PS41014-Ab for the short isoform.
The molecular size of L/S isoforms of DCLK1 are significantly different, since the S-isoform lacks the two doublecortin (DCX) domains present at the N-terminal end of the L-isoform. The absence of DCX domains in DCLK1-S may preclude the S-isoform from binding the microtubules, as described for L-isoform (36,37). The crystal structure of L-isoform was recently published (40), but the crystal structure of the S isoform remains unknown. Absence of the microtubule binding domain in the S isoform, may allow differential localization of the two proteins, as suggested by the EM results (Fig 5b). Differences in localization of the S/L isoforms may lend itself to differences in the biological activity of the two isoforms as recently reported by us in a preliminary study (38). Colon cancer cells over-expressing the S isoform (COLO205-S-GFP) were found to be significantly more invasive, in vitro and in vivo, compared to the isogenic cells over-expressing the L-isoform (COLO205-L-GFP) (38).
Hyperplastic/Adenomatous (Hp/Ad) growths are the most common neoplastic sporadic growths found during colorectal screening of patients, with no genetic pre-disposition (3). The time to CRCs from Ads is predicted to vary from 10–22 years (4). At age 60, 30–40% of patients are positive for colonic Ads, but the lifetime cumulative incidence of CRC is 5.5%, suggesting that most Ads will not progress to cancer (2).
With aging populations in Europe, US, Japan, China, number of CRC cases are expected to significantly increase in future years (9). Additionally, a significant increase in the incidence of CRCs has been noted in young adults (41). It is extrapolated, that by 2030, incidence of CRCs will rise by 90–124% for patients 20–34 years and by 27–46% for patients aged 35–49 years, based on a retrospective study from 1975 through 2010 (41). However, a small but significant decline in the incidence of CRCs in patients aged 50+, has been noted due to increased screening/surveillance of older patients (41). ‘Field cancerization’ is characterized by genetic/epigenetic alterations in normal-appearing colonic tissues in patients with Ads/CRCs, leading to increased risk of synchronous/metachronous primary tumors (reviewed in 42). Genetic mutations are rare in normal/hyperplastic cells; however, epigenetic changes occur at early stages. Changes in the landscape of DNA methylations, resulting from gradual dysregulation of the genome (epigenetic drift) is associated with aging, causing ‘field effects’ in CRCs (reviewed in 42). Epigenetic-changes are being captured by DNA/non-codingRNA(miRNA) tests of fecal/blood samples from patients, for identifying patients with CRCs, including the FDA approved Cologuard test (reviewed in 42). However, these tests do not identify patients with neoplastic growths (Hps/Ads), and have limited sensitivity for identifying pre-malignant growths or sessile-serrated polyps (reviewed in 42). The miRNA-based biomarker panels, developed so far, are inconsistent (reviewed in 42) and none of the panels are approved for guiding follow-up colonoscopies, which remain the gold standard used for detecting CRCs or advanced growths in patients.
Size/numbers/dysplasia of polyps remains the only reliable predictors of risk, and for guiding time to follow-up colonoscopies; but these features are not precise and majority of the patients subjected to follow-up colonoscopies will never develop cancer (5–7). In order to assess if specific neoplastic growths pre-dispose patients to malignant growths, predictive gene signatures have been developed (42–44), which require frozen biopsies of variable quality. Persistent technical difficulties are noted with multiplexed qRT-PCR platforms (45). Identification of patients, positive for high-risk Ads, at initial/screening colonoscopies, using blood/stool based biomarkers has thus far remained elusive (reviewed in 42). A significant drawback of DNA/RNA/miRNA based biomarkers, is that the sample examined may not be representative of the complete polyp, and quality of collection has remained a significant issue. IHC analysis, on the other hand is cost effective, can potentially cover the entire field of the fixed specimen and can be analyzed by the pathologist while assessing morphological/pathological criteria, much like the analysis of estrogen receptor/HER2neu oncogene, used for prognostic purposes in breast cancer patients. A study has validated the use of colonoscopy with morphological/pathological analysis of polyps, as a cost effective method of prevention and identification of high-risk patients, than all other fecal/blood tests developed so far (46). Very few biomarkers, other than progastrin, have been reported for identifying patients at risk for developing advanced growths using IHC assay of the Ad/Hp samples (47). We hypothesized that antibody based assay(s), which identify transformed stem cells, specific for colon cancers, such as DCLK1-S, will allow a pathologist in any setting, to significantly improve the predictive value of morphological/pathological criteria.
In order to test our hypothesis, we used the specific PS41014-Ab for IHC analysis of Ads, discovered at the time of index/screening colonoscopies, in a pilot retrospective study, in order to determine if staining with this antibody could accurately identify high-risk patients (who eventually developed AdCAs within 10 years of initial colonoscopy). Based on the results of our pilot retrospective study, the PS41014-Ab was found to stain Ads from initial and follow-up colonoscopies of high-risk patients, at significantly higher levels than Ads from low-risk patients (Fig 10), suggesting that PS41014-Ab could be used as an additional tool for more accurately identifying high-risk patients. Identification of CSC populations, using the PS41014-Ab may allow identifying the high-risk patients at a very early stage, and give an opportunity to develop preventive and interventional strategies for these patients. In addition, we must also keep in mind that polypectomies performed during colonoscopies are curative in most patients—utilizing the tissues that are already obtained during these procedures to provide additional prognostic information for patients will be of great benefit.
Colonoscopy is the most commonly performed medical procedure in the US with 14 million procedures in 2003 alone (46). Of the millions who get repeat colonoscopies as recommended, only 1–2% actually develop CRCs (46). Therefore, molecular biomarkers are critically required for identifying the high-risk patients at early time points, so that high-risk patients not only receive more frequent colonoscopies, but are also subjected to additional preventive/interventional strategies, based on the findings of our pilot retrospective studies. Stem cells are critically required for maintaining both normal/abnormal growths, malignant transformation of stem cells, is a critical step towards malignancy; increased CSC populations can lead to invasion and seeding of metastatic growths at shorter intervals (15,16,38). So far there are no biomarkers which specify CSCs in colonic growths. Molecular markers developed so far, for analyzing serum/fecal samples from patients, do not identify high-risk patients, at an early stage, when patients are positive for only polyps (42–44). Additionally, there are no tests/biomarkers available for identifying high-risk patients, at the time of index/screening colonoscopy, to determine which patients may be at risk of developing A-Ads/CRCs within 10–15 years. Based on the results of our pilot retrospective study, identification of high-risk patients at an early time point, based on the pattern of staining for DCLK1-S, at initial and follow-up colonoscopies, can be used to trigger additional preventative/interventional strategies, besides frequent follow-up colonoscopies.
In conclusion, we have generated a DCLK1-S specific polyclonal Ab using the 6 amino acid epitope, unique to the S-isoform, and have validated the specificity of the PS41014-Ab by WB/IHC/IEM. We have previously reported that analysis of the relative expression levels of the S-isoform by qRT-PCR analysis can serve as an independent diagnostic and prognostic marker for identifying CRC patients at risk of poor overall survival (12). In the current studies we demonstrate that the S specific Ab can probably identify patients at the early time points of index/screening colonoscopy, who may be at high risk for developing CRCs. The use of PS41014-Ab is significantly more accurate than using commercially available Abs, which measures both L/S isoforms, given that DCLK1-L is not expressed by human cancer stem cells, but is expressed by many different cell types in the extra epithelial component of the tumors, as well as by the normal colonic epithelial cells.
Supplementary Material
Figure 7. Sub-cellular distribution of the long isoform of DCLK1 in COLO205-L-GFP clones, processed with GFP antibody.
The COLO205-L-GFP clones were processed for IEM analysis as described in the Methods section, and as outlined in the legend of Figure 6, using GFP-Ab. The boxed insets from different sub-cellular fractions of the cell are enhanced at the bottom of the figure. The relative distribution of DCLK1-L isoform in the different sub-cellular fractions was quantified as described in the legend of Figure 5, and is presented in Figure 5b.
Acknowledgments
This work was supported by National Institutes of Health (http://www.nih.gov/) grants CA97959 and CA97959S1 to PS. The funders had no role in study design, data collection and analysis, decision to publish, or preparation of the manuscript.
Footnotes
Author contributions: SS generated all the data with the help of VLP’s laboratory and MO and BL; RO, BL, HS and GL helped to identify the patient samples from two hospital data bases and retrieve the FFPE blocks from the pathology department; HS helped to confirm the pathology of all the samples; MO and BL helped SS to analyze all the IHC data, while VLP helped SS to analyze the IEM data; HS and VLP helped PS to interpret the data and write the manuscript, with the help of all the authors; PS directed all the studies. The authors acknowledge the technical help received from Julie W. Wen and Zhixia Ding, in Dr Popov’s laboratory, for the IEM studies.
Disclosures/Conflict of Interest: The authors report no conflict of interest.
References
- 1.Siegel R, Naishadham D, Jemal A. Cancer statistics, 2013. CA Cancer J Clin. 2013;63:11–30. doi: 10.3322/caac.21166. [DOI] [PubMed] [Google Scholar]
- 2.Atkin WS, Saunders BP, Gastroenterology BSF, Ireland AoCfGBa Surveillance guidelines after removal of colorectal adenomatous polyps. Gut. 2002;51(Suppl 5):V6–9. doi: 10.1136/gut.51.suppl_5.v6. [DOI] [PMC free article] [PubMed] [Google Scholar]
- 3.Bujanda L, Cosme A, Gil I, Arenas-Mirave JI. Malignant colorectal polyps. World J Gastroenterol. 2010;16:3103–11. doi: 10.3748/wjg.v16.i25.3103. [DOI] [PMC free article] [PubMed] [Google Scholar]
- 4.Force USPST. Screening for colorectal cancer: U.S. Preventive Services Task Force recommendation statement. Ann Intern Med. 2008;149:627–37. doi: 10.7326/0003-4819-149-9-200811040-00243. [DOI] [PubMed] [Google Scholar]
- 5.Winawer SJ, Zauber AG, Fletcher RH, et al. Guidelines for colonoscopy surveillance after polypectomy: a consensus update by the US Multi-Society Task Force on Colorectal Cancer and the American Cancer Society. CA Cancer J Clin. 2006;56:143–59. doi: 10.3322/canjclin.56.3.143. quiz 84–5. [DOI] [PubMed] [Google Scholar]
- 6.van Stolk RU, Beck GJ, Baron JA, et al. Adenoma characteristics at first colonoscopy as predictors of adenoma recurrence and characteristics at follow-up. The Polyp Prevention Study Group. Gastroenterology. 1998;115:13–8. doi: 10.1016/s0016-5085(98)70359-2. [DOI] [PubMed] [Google Scholar]
- 7.Huang CS, O’brien MJ, Yang S, et al. Hyperplastic polyps, serrated adenomas, and the serrated polyp neoplasia pathway. Am J Gastroenterol. 2004;99:2242–2255. doi: 10.1111/j.1572-0241.2004.40131.x. [DOI] [PubMed] [Google Scholar]
- 8.Atkin WS, Morson BC, Cuzick J. Long-term risk of colorectal cancer after excision of rectosigmoid adenomas. N Engl J Med. 1992;326:658–662. doi: 10.1056/NEJM199203053261002. [DOI] [PubMed] [Google Scholar]
- 9.Amonkar MM, Hunt TL, Zhou Z, et al. Surveillance patterns and polyp recurrence following diagnosis and excision of colorectal polyps in a medicare population. Cancer Epidemiol Biomarkers Prev. 2005;14:417–421. doi: 10.1158/1055-9965.EPI-04-0342. [DOI] [PubMed] [Google Scholar]
- 10.Imperiale TF, Glowinski EA, Lin-Cooper C, et al. Five-year risk of colorectal neoplasia after negative screening colonoscopy. N Engl J Med. 2008;359:1218–1224. doi: 10.1056/NEJMoa0803597. [DOI] [PubMed] [Google Scholar]
- 11.Sarkar S, Swiercz R, Kantara C, et al. Annexin A2 mediates up-regulation of NF-κB, β-catenin, and stem cell in response to progastrin in mice and HEK-293 cells. Gastroenterology. 2011;140:583–595. doi: 10.1053/j.gastro.2010.08.054. [DOI] [PMC free article] [PubMed] [Google Scholar]
- 12.O’Connell MR, Sarkar S, Luthra GK, et al. Epigenetic changes and alternate promoter usage by human colon cancers for expressing DCLK1-isoforms: Clinical Implications. Sci Reports. 2015;5:14983. doi: 10.1038/srep14983. [DOI] [PMC free article] [PubMed] [Google Scholar]
- 13.Nakanishi Y, Seno H, Fukuoka A, et al. Dclk1 distinguishes between tumor and normal stem cells in the intestine. Nat Genet. 2013;45:98–103. doi: 10.1038/ng.2481. [DOI] [PubMed] [Google Scholar]
- 14.Westphalen CB, Asfaha S, Hayakawa Y, et al. Long-lived intestinal tuft cells serve as colon cancer-initiating cells. J Clin Invest. 2014;124:1283–1295. doi: 10.1172/JCI73434. [DOI] [PMC free article] [PubMed] [Google Scholar]
- 15.Kantara C, O’Connell M, Sarkar S, et al. Curcumin promotes autophagic survival of a subset of colon cancer stem cells, which are ablated by DCLK1-siRNA. Cancer Res. 2014;74:2487–2498. doi: 10.1158/0008-5472.CAN-13-3536. [DOI] [PMC free article] [PubMed] [Google Scholar]
- 16.Sarkar S, Kantara C, Ortiz I, et al. Progastrin overexpression imparts tumorigenic/metastatic potential to embryonic epithelial cells: phenotypic differences between transformed and nontransformed stem cells. Int J Cancer. 2012;131:E1088–1099. doi: 10.1002/ijc.27615. [DOI] [PMC free article] [PubMed] [Google Scholar]
- 17.Vedeld HM, Skotheim RI, Lothe RA, et al. The recently suggested intestinal cancer stem cell marker DCLK1 is an epigenetic biomarker for colorectal cancer. Epigenetics. 2014;9:346–350. doi: 10.4161/epi.27582. [DOI] [PMC free article] [PubMed] [Google Scholar]
- 18.Vedeld HM, Andresen K, Eilertsen IA, et al. The novel colorectal cancer biomarkers CDO1, ZSCAN18 and ZNF331 are frequently methylated across gastrointestinal cancers. Int J Cancer. 2015;136:844–853. doi: 10.1002/ijc.29039. [DOI] [PMC free article] [PubMed] [Google Scholar]
- 19.Powrózek T, Krawczyk P, Nicoś M, et al. Methylation of the DCLK1 promoter region in circulating free DNA and its prognostic value in lung cancer patients. Clin Transl Oncol. 2016;18:398–404. doi: 10.1007/s12094-015-1382-z. [DOI] [PubMed] [Google Scholar]
- 20.Singh P, O’Connell M, Sarkar S. Epigenetic regulation of human DCLK-1 gene during colon-carcinogenesis: Clinical and mechanistic implications. Stem Cell Invest. 2016;3:51. doi: 10.21037/sci.2016.09.07. [DOI] [PMC free article] [PubMed] [Google Scholar]
- 21.Bailey JM, Alsina J, Rasheed ZA, et al. DCLK1 marks a morphologically distinct subpopulation of cells with stem cell properties in preinvasive pancreatic cancer. Gastroenterology. 2014;146:245–256. doi: 10.1053/j.gastro.2013.09.050. [DOI] [PMC free article] [PubMed] [Google Scholar]
- 22.Westphalen CB, Takemoto Y, Tanaka T, et al. Dclk1 Defines Quiescent Pancreatic Progenitors that Promote Injury-Induced Regeneration and Tumorigenesis. Cell Stem Cell. 2016;18:441–455. doi: 10.1016/j.stem.2016.03.016. Comments from Singh et al, regarding inaccuracies in this publication, are published and available at this link: http://www.cell.com/cell-stem-cell/comments/S1934-5909(16)30003-0.Cell Stem Cell. 2016 Apr 7Vol.18, Issue 4. [DOI] [PMC free article] [PubMed] [Google Scholar]
- 23.Chandrakesan P, May R, Qu D, Weygant N, Taylor VE, Li JD, Ali N, Sureban SM, Qante M, Wang TC, Bronze MS, Houchen CW. Dclk1+ small intestinal epithelial tuft cells display the hallmarks of quiescence and self-renewal. Oncotarget. 2015;6:30876–86. doi: 10.18632/oncotarget.5129. [DOI] [PMC free article] [PubMed] [Google Scholar]
- 24.May R, Riehl TE, Hunt C, et al. Identification of a novel putative gastrointestinal stem cell and adenoma stem cell marker, doublecortin and CaM kinase-like-1, following radiation injury and in adenomatous polyposis coli/multiple intestinal neoplasia mice. Stem Cells. 2008;26:630–637. doi: 10.1634/stemcells.2007-0621. [DOI] [PubMed] [Google Scholar]
- 25.May R, Sureban SM, Hoang N, et al. Doublecortin and CaM kinase-like-1 and leucine-rich-repeat-containing G-protein-coupled receptor mark quiescent and cycling intestinal stem cells, respectively. Stem Cells. 2009;27:2571–2579. doi: 10.1002/stem.193. [DOI] [PMC free article] [PubMed] [Google Scholar]
- 26.Sureban SM, May R, Ramalingam S, et al. Selective blockade of DCAMKL-1 results in tumor growth arrest by a Let-7a MicroRNA-dependent mechanism. Gastroenterology. 2009;137:649–659. doi: 10.1053/j.gastro.2009.05.004. [DOI] [PMC free article] [PubMed] [Google Scholar]
- 27.Kantara C, O’Connell MR, Luthra G, et al. Methods for detecting circulating cancer stem cells (CCSCs) as a novel approach for diagnosis of colon cancer relapse/metastasis. J Lab Invest. 2015;95:100–112. doi: 10.1038/labinvest.2014.133. [DOI] [PMC free article] [PubMed] [Google Scholar]
- 28.Gagliardi G, Goswami M, Passera R, et al. DCLK1 immunoreactivity in colorectal neoplasia. Clin Exp Gastroenterol. 2012;5:35–42. doi: 10.2147/CEG.S30281. [DOI] [PMC free article] [PubMed] [Google Scholar]
- 29.Gagliardi G, Moroz K, Bellows CF. Immunolocalization of DCAMKL-1, a putative intestinal stem cell marker, in normal colonic tissue. Pathol Res Pract. 2012;208:475–479. doi: 10.1016/j.prp.2012.05.015. [DOI] [PubMed] [Google Scholar]
- 30.Sarkar S, O’Connell M, Singh P. American Association Cancer Research (AACR) New Orleans: 2016. Apr 16–20, Differential dose effects of curcumin/analogs in long (L) versus short (S) isoforms of a cancer stem cells marker, DCLK1 in colon and pancreatic cancer cells: Bilogical Impact. Abstract # 5242. [Google Scholar]
- 31.Burgess HA, Reiner O. Cleavage of doublecortin-like kinase by calpain releases an active kinase fragment from a microtubule anchorage domain. J Biol Chem. 2001;276:36397–403. doi: 10.1074/jbc.M105153200. [DOI] [PubMed] [Google Scholar]
- 32.Singh P, Velasco M, Given R, et al. Progastrin expression predisposes mice to colon carcinomas and adenomas in response to a chemical carcinogen. Gastroenterology. 2000;119:162–171. doi: 10.1053/gast.2000.8527. [DOI] [PubMed] [Google Scholar]
- 33.Umar S, Sarkar S, Cowey S, et al. Activation of NF-kappaB is required for mediating proliferative and antiapoptotic effects of progastrin on proximal colonic crypts of mice, in vivo. Oncogene. 2008;27:5599–5611. doi: 10.1038/onc.2008.169. [DOI] [PMC free article] [PubMed] [Google Scholar]
- 34.Zhang J, Popov VL, Gao S, Walker DH, Yu X. The developmental cycle of Ehrlichia chaffeensis in vertebrate cells. Cellular Microbiology. 2007;9(3):610–618. doi: 10.1111/j.1462-5822.2006.00812.x. [DOI] [PubMed] [Google Scholar]
- 35.Popov VL, Yu X, Walker DH. The 120 kDa outer membrane protein of Ehrlichia chaffeensis: preferential expression on dense-core cells and gene expression in Ehrlichia coli associated with attachment and entry. Microbial Pathogenesis. 2000;28:71–80. doi: 10.1006/mpat.1999.0327. [DOI] [PubMed] [Google Scholar]
- 36.Lin PT, Gleeson JG, Corbo JC, et al. DCAMKL1 encodes a protein kinase with homology to doublecortin that regulates microtubule polymerization. J Neurosci. 2000;20:9152–9161. doi: 10.1523/JNEUROSCI.20-24-09152.2000. [DOI] [PMC free article] [PubMed] [Google Scholar]
- 37.Shu T, Tseng HC, Sapir T, et al. Doublecortin-like kinase controls neurogenesis by regulating mitotic spindles and M phase progression. Neuron. 2006;49:25–39. doi: 10.1016/j.neuron.2005.10.039. [DOI] [PubMed] [Google Scholar]
- 38.O’Connell MR, Sarkar S, Ward D, Singh P. Short (S) Isoform of Cancer-Stem-Cell Marker, DCLK1, Is Critically Required for Maintaining Proliferative/Tumorigenic Potential of Human Colon Cancer Cells (hCCCs) Independent of DCLK1-L Isoform. (Poster of distinction) Proceeding of the Digestive Disease Week. 2016 May 21–24;150(4):S-605. Gastroenterology. [Google Scholar]
- 39.Hammond DE, Mageean CJ, Rusilowicz EV, et al. Differential reprogramming of isogenic colorectal cancer cells by distinct activating KRAS mutations. J Proteome Res. 2015;14:1535–1546. doi: 10.1021/pr501191a. [DOI] [PMC free article] [PubMed] [Google Scholar]
- 40.Patel O, Dai W, Mentzel M, et al. Biochemical and Structural Insights into Doublecortin-like Kinase Domain 1. Structure. 2016;24:1550–1561. doi: 10.1016/j.str.2016.07.008. [DOI] [PubMed] [Google Scholar]
- 41.Bailey CE, Hu CY, et al. Increasing disparities in the age-related incidences of colon and rectal cancers in the United States, 1975–2010. JAMA Surg. 2015;150:17–22. doi: 10.1001/jamasurg.2014.1756. [DOI] [PMC free article] [PubMed] [Google Scholar]
- 42.Okugawa Y, Grady WM, Goel A. Epigenetic Alterations in Colorectal Cancer: Emerging Biomarkers. Gastroenterology. 2015;149:1204–1225. doi: 10.1053/j.gastro.2015.07.011. [DOI] [PMC free article] [PubMed] [Google Scholar]
- 43.Galamb O, Wichmann B, Sipos F, et al. Dysplasia-carcinoma transition specific transcripts in colonic biopsy samples. PLoS One. 2012;7:e48547. doi: 10.1371/journal.pone.0048547. [DOI] [PMC free article] [PubMed] [Google Scholar]
- 44.Drew JE, Farquharson AJ, Mayer CD, et al. Predictive gene signatures: molecular markers distinguishing colon adenomatous polyp and carcinoma. PLoS One. 2014;9:e113071. doi: 10.1371/journal.pone.0113071. [DOI] [PMC free article] [PubMed] [Google Scholar]
- 45.Binnicker MJ. Multiplex Molecular Panels for Diagnosis of Gastrointestinal Infection: Performance, Result Interpretation, and Cost-Effectiveness. J Clin Microbiol. 2015;53:3723–3728. doi: 10.1128/JCM.02103-15. [DOI] [PMC free article] [PubMed] [Google Scholar]
- 46.Seeff LC, Richards TB, Shapiro JA, Nadel MR, Manninen DL, Given LS, Dong FB, Winges LD, McKenna MT. How many endoscopies are performed for colorectal cancer screening? Results from CDC’s survey of endoscopic capacity. Gastroenterology. 2004;127(6):1670–7. doi: 10.1053/j.gastro.2004.09.051. [DOI] [PubMed] [Google Scholar]
- 47.Do C, Bertrand C, Palasse J, et al. A new biomarker that predicts colonic neoplasia outcome in patients with hyperplastic colonic polyps. Cancer Prev Res (Phila) 2012;5:675–684. doi: 10.1158/1940-6207.CAPR-11-0408. [DOI] [PubMed] [Google Scholar]
Associated Data
This section collects any data citations, data availability statements, or supplementary materials included in this article.