

Abstract
Many enzymes promote structural changes in their nucleic acid substrates via application of piconewton forces over nanometer length scales. Magnetic tweezers (MT) is a single molecule force spectroscopy method widely used for studying the energetics of such mechanical processes. MT permits stable application of a wide range of forces and torques over long time scales with nanometer spatial resolution. However, in any force spectroscopy experiment, the ability to monitor structural changes in nucleic acids with nanometer sensitivity requires the system of interest to be held under high degrees of tension to improve signal to noise. This limitation prohibits measurement of structural changes within nucleic acids under physiologically relevant conditions of low stretching forces. To overcome this challenge, researchers have integrated a spatially sensitive fluorescence spectroscopy method, single molecule-FRET, with MT to allow simultaneous observation and manipulation of nanoscale structural transitions over a wide range of forces. Here, we describe a method for using this hybrid instrument to analyze the mechanical properties of nucleic acids. We expect that this method for analysis of nucleic acid structure will be easily adapted for experiments aiming to interrogate the mechanical responses of other biological macromolecules.
Keywords: Single-molecule FRET, Magnetic tweezers, Nucleic acid
1. Introduction
Recent advances in biophysical research have revealed that mechanical force is a critical modulator of molecular, cellular, and organismal function [1–3]. Initial biophysical characterization of DNA revealed that cellular processes such as replication, transcription, and chromatin compaction rely on mechanical forces for proper biological function [4–10]. These studies revealed that enzymes convert chemical energy into piconewton (pN) scale forces to modulate the twist, stretch, and bend properties of DNA.
Single molecule force spectroscopy has revolutionized how these force-induced structural transitions are characterized, permitting direct manipulation and analysis of individual DNA and RNA molecules [1,11–13]. Optical trapping (OT) and magnetic tweezers (MT) have emerged as two preferred methods for characterizing biologically relevant forces by allowing precise calibration of force and torque [14,15]. Although these techniques access similar force regimes, each comes with certain advantages and limitations. For example, to study mechanical transitions at low forces (<1 pN), MT is often the method of choice due to its inherent stability compared with OT systems. In addition, the geometry of a MT experiment employs a wide-field microscope and therefore can in principle be parallelized to measure the properties of many individual molecules simultaneously [16]. These properties of MT systems, together with their relatively simple and inexpensive assembly, have lead to broad applications of this technique in studies of diverse biological systems.
By comparison, the sophistication of a well-aligned and vibration-isolated OT system can achieve a remarkable degree of spatial resolution, capable of detecting molecular displacements with sub-nanometer resolution [17–19]. Although most traditional MT systems are unable to achieve comparable spatial resolution to OT experiments, more recent advances in MT techniques have also demonstrated the capability of monitoring nanometer scale displacements [20,21]. In either case, to study the mechanical properties of a system of interest (ie. a nucleic acid hairpin [22,23] or globular protein fold [24]) relatively long flexible DNA handles are typically utilized as mechanical force transducers [25]. Increased handle length facilitates micromanipulation of the structure of interest, but also introduces noise into the system that limits the spatial resolution of the measurement. Thus, to achieve maximal spatial resolution, high stretching forces are typically applied to suppress the noise introduced by the DNA handles and the experimental signal must be time averaged [12,17,18]. Consequently, there exists a demand for a single molecule method capable of monitoring nanometer-scale structural changes under low levels of mechanical load.
To address this challenge, several research groups have employed hybrid force-fluorescence spectroscopy methods, which decouple the application of stretching force from the measurement of ‘local’ conformational rearrangements within a structure of interest (SOI). Typically the nanometer-scale rearrangements within the SOI are detected by single-molecule Förster Resonance Energy Transfer (smFRET), a time-resolved fluorescence method that is highly sensitive to distance changes on the nanometer scale [26,27]. In a smFRET experiment, a donor fluorophore is directly excited with a laser (i.e. 532 nm laser for cy3 excitation). If an acceptor dye is in close spacial proximity to the donor (2–8 nm), dipolar coupling of the dyes allows non-radiative energy transfer from the excited donor to the acceptor, where closer proximity results in a higher degree of energy transfer [28]. Experimentally, FRET is often defined by the relationship IA/(IA + ID), where IA and ID are the measured acceptor and donor intensities, respectively. In this way, simultaneous measurement of donor and acceptor fluorescence can provide a sensitive metric for conformational changes within individual molecules.
Integration of smFRET with both OT and MT systems has been reported [29–35]; however, the combination of MT with smFRET has certain practical advantages. OT experiments are achieved using a high-power trapping laser which has the potential to induce photo-damage of the smFRET probes. Although this challenge can be overcome by inter-lacing the trapping laser with the smFRET excitation source using high frequency shutters or acousto-optical modulators (AOM) [36], implementing such a system is expensive and technically challenging. In contrast, magnetic force application in MT is ideally-suited for integration with standard objective-type total internal reflection fluorescence (TIRF) microscopy [37,38], without concerns of induced photo-damage by a trapping laser. The relatively simple integration of an existing MT system with a TIRF microscope should enable biochemistry laboratories to establish a force-FRET assay ‘in house’, rather than exclusively relying on collaborative efforts.
Here, we will review the MT-smFRET system for study of nucleic acid structures. First, we will describe the design of the MT-smFRET instrument. Next, we will address experimental protocols involved in MT-smFRET analysis. Finally, we will discuss successful applications of MT-smFRET in studying the mechanical properties of DNA structure.
2. Magnetic tweezers-single molecule FRET microscope
2.1. Design and construction of a hybrid MT-smFRET microscope
The basic layout of a MT-smFRET instrument is illustrated in Fig. 1. For the purposes of this article we will indicate the specific manufacturers and models of the equipment used in our laboratory; however, we note there are a number of alternative sources of comparable equipment. The hybrid device is built on a standard objective-type total internal reflection fluorescence (TIRF) microscope (Olympus IX71) equipped with an electron multiplying charged coupled device (CCD) camera with single-molecule detection sensitivity (Andor Ixon). The excitation lasers (532 nm for Cy3 and 637 nm for Cy5, Vortran Lasers, Inc.) are coupled through the back port of the microscope and guided to the sample through an objective (Olympus Plan-APO NA 1.4). This objective is mounted onto a piezo-controlled stepping device (Mad City Labs, Inc.), which is later used for force calibrations and bead tracking. Emitted light from the fluorescent probes is collected by the same objective, spectrally separated by dichroic mirrors (Chroma, Inc.) to generate donor and acceptor channels, and subsequently focused onto the CCD. In general, this objective-based TIRF setup closely resembles the systems described in detail in other reviews [37,38].
Fig. 1.

Hybrid MT-smFRET microscope setup. Schematic diagram of the MT-smFRET instrument. The MT-FRET instrument consists of an objective-type TIRF microscope, smFRET detection optics, and an EM-CCD camera. The excitation lasers are coupled through the back port of the microscope and guided to the sample through an oil-immersion objective. The magnetic tweezers apparatus, which controls the linear and angular positions of the magnets, is mounted above the sample chamber. The collimated blue LED light source is mounted directly onto the magnet assembly and is used for direct imaging of the magnetic beads.
Simultaneous measurement of molecular extension and smFRET is possible by integrating additional imaging components [32,35]. A second camera is mounted to a sideport of the microscope to detect the diffraction pattern, and thereby spacial positioning, of a molecule-bound magnetic bead. This pattern is generated by overhead illumination from a collimated LED (Thorlabs, Inc; blue and/or near IR LEDs have been used previously), which can be separated from fluorescence light by a dichroic mirror in the microscope. Spectral separation of the bead image from the fluorescence light provides simultaneous measurement of molecular extension and smFRET, respectively.
Objective-type TIRF microscopy provides an ideal geometry for integrating smFRET with a MT system. The magnetic tweezer apparatus resides above the sample chamber and consists of a pair of 5 mm cubic permanent magnets mounted onto computer controlled translation and rotation stages (Thorlabs Linear Stage and Pacific Laser Company Brushless Motor Rotation Stage). The motorized stage assembly is used to change the linear position and angular displacement of the magnets to apply specific degrees of tension and twist, respectively. More detailed descriptions of similar magnet control systems are discussed in a variety of excellent reports [6,39].
2.2. Calibration of applied force
In a MT experiment, the force being applied to a DNA molecule can be directly extracted by measuring the length of the DNA tether and the amplitude of beads lateral fluctuations in the x-y plane (Fig. 2a). The methods used for tracking the height of the tethered bead from the surface (z-position), as well as tracking the x- and y-positions of the bead in real-time have been described [15,40], and therefore will not be described in detail in this review.
Fig. 2.

Magnetic tweezers force calibration. (a) Schematic illustration of a DNA molecule tethered between a coverglass and a magnetic beads. Forces are measured according to the expression F = kTL/<δx2>, where F is the stretching force, k is Boltzman’s constant, T is temperature, and δx is the amplitude of the bead fluctuation in the x-plane. The stretching force can be changed by varying the position of the magnet assembly held above the sample chamber. (b) Measured stretching forces in pico-Newtons (pN) as a function of magnet position in millimeters (mm) are plotted and fit by a single exponential decay function. The parameters of the exponential fit are then used to convert magnet position to force values across different experiments. (c) Experimental verification of force calibration by fitting a force-extension plot of a DNA molecule with the worm-like chain model, yielding the expected persistence length of 45 nm for DNA under our experimental conditions.
In the context of an integrated MT-smFRET experiment, it is desirable to determine a systematic calibration of the applied stretching force as a function of a magnet height (Fig. 2b). This generalized calibration allows force estimations for any DNA tether without performing individual force calibrations on each molecule. One critical assumption made by this approach is that the magnetic beads used in the experiments are highly uniform with respect to their iron content. We have found the one micron (MyOne, Dynal Thermo Fisher Scientific) beads to be sufficiently uniform so as to provide force estimates with an error of maximally 10% among different beads. This level of accuracy is sufficient for most Force-smFRET experiments. If more precise calibration of the force is required, bead fluctuation and tether length data can be collected for each individual molecular setup allowing direct calibration of each molecule. Accuracy of the force calibration is typically assessed by fitting the force-extension curve to the well-established worm like chain model for DNA elasticity (Fig. 2c) [41,42]. When larger forces (>15 pN) are required, 2.8 μm magnetic beads must be employed. For these experiments, we find the size distribution of the beads to be too large to use a general calibration, and therefore forces are recalibrated for each DNA molecule following each MT-smFRET measurement. A detailed description of the required measurements and methods for force calibration has been discussed elsewhere [15].
3. Description of MT-smFRET method
In the following sections, we describe the preparation of sample chambers and magnetic beads, the construction of FRET dye-labeled molecule, the immobilization of the molecule, and MT-smFRET measurement.
3.1. Preparation of sample chambers and magnetic beads
As with all MT experiments, the DNA molecules to be studied must be specifically attached between a microscope coverglass and a magnetic bead. Sample chambers are prepared by sandwiching two pieces of parafilm between a standard glass microscope slide and a coverglass (Fig. 3a). We note that if higher forces are required, the 1 mm thick microscope slide may be replaced with a standard coverglass, permitting a closer approach of the magnet assembly. In our experiments, this minor adjustment permits application of maximal stretching forces in the range of ~10 pN using the 1 μm diameter Dynal beads. Prior to chamber assembly, the microscope slide is cleaned using a plasma-cleaner, which we have found significantly reduces non-specific sticking of DNA and beads. Since this surface is not imaged during the experiment, additional cleaning steps on the microscope slide are not necessary. In contrast, the coverglass is extensively cleaned by a series of alternating sonication treatments in a strong base and acetone to reduce fluorescence background. After assembly, the chambers can be stored for up to three weeks before use. Directly before the experiment, channels are treated with biotinylated bovine serum albumin (BSA), washed with buffer, and then incubated with streptavidin (Fig. 3b). Following the streptavidin incubation, flow channels are washed again in a suitable buffer, and stored in a humidity chamber to prevent evaporation. An example of a typical channel assembly is described as follows:
Fig. 3.

Preparation of sample chambers. (a) Sample chambers are assembled by sandwiching two strips of parafilm between a coverglass and a glass slide. To adhere the parafilm to the glass, the sample chamber is briefly heated and then allowed to cool to room temperature. (b) To prepare the cleaned and assembled sample chamber for an experiment, a series of buffer exchange steps are performed using a pipette. First a solution of biotinylated-BSA is introduced which adheres non-specifically onto the coverglass. After washing away the unbound biotin-BSA, a solution of streptavidin is flowed over the surface. Following a final wash step to remove excess streptavidin, sample chambers are stored in a humidity chamber to prevent evaporation.
Sonicate the coverglasses to be imaged in a glass staining jar for 20 min in each solution: 10% w/v Alconox, acetone, 1 M KOH, and Milli-Q H2O.
To begin sample chamber assembly, start by drying one of the cleaned coverglasses with nitrogen gas.
Place coverglass on top of a clean quartz slide.
Quickly flame the imaging surface of the coverglass using a handheld propane torch to burn away any fluorescent debris.
After plasma-cleaning the microscope slide for 5 min, assemble sample chambers by sandwiching strips of parafilm between the microscope slide and the coverglass.
Place the assembly beneath a heat block (95 °C) for ~10 s to adhere the parafilm to the glass (parafilm will become partially clear).
Once the assembled slide cools to room temperature, pipette 35 μL of 1 mg/mL biotinylated BSA into the sample chamber and incubate for 5 min.
Wash the chamber with ~200 μL T50 (10 mM Tris pH 8, 50 mM NaCl) buffer, followed by incubation with 50 μL of 0.2 mg/mL streptavidin (made in T50 buffer).
Wash the chambers with ~200 μL T50 buffer to remove excess streptavidin.
Store the equilibrated slides in a humidity box to avoid evaporation. A humidity box can be made by filling the bottom of an empty pipette tip box with some water and covering tightly with lid.
The most common magnetic beads used in MT experiments are 1 μm or 2.8 μm diameter Dynal beads. As mentioned above, the 1 μm bead is designed for experiments using low stretching forces (<10 pN). In contrast, the 2.8 μm bead can exert forces >10 pN. These magnetic beads come with a wide variety of functionalized coatings, which give the flexibility to tether DNA molecules with different antibodies. For our smFRET-MT experiments, we typically use anti-digoxigenin-coated magnetic beads, derived from carboxylated beads as described [33].
3.2. Preparation of smFRET-labeled DNA molecules
The molecules employed in a hybrid MT-smFRET experiment are minimally comprised of three separate fragments: (i) a segment that harbors the SOI, together with appropriately placed smFRET probes and a biotin modification for surface immobilization; (ii) a relatively long DNA handle to space the large magnetic bead away from the imaging surface; and (iii) a linker DNA fragment that contains digoxigenin-modified dUTP for association with anti-digoxigenin coated magnetic bead (Fig. 4). An example of a molecule preparation strategy employed in our laboratory is outlined below:
Fig. 4.

Preparation of DNA molecules for MT-smFRET measurement. The DNA molecule for MT-smFRET measurement is constructed from three different DNA segments. (a) The segment harboring the structure of interest (SOI) labeled with smFRET dyes. The efficiency of the annealing reaction is determined by native polyacrylamide gel and taking a fluorescence scan for the donor (Cy3) and acceptor (Cy5) dyes. The yellow band (small black arrow) represents the target product of the annealing reaction possessing all three oligonucleotides. (b) The DNA handle segment is prepared by restriction enzymes digestion of lambda DNA. The desired basepair segment is purified on an agarose gel. (c) The DNA linker segment is prepared by PCR reaction with a plasmid containing multiple cloning site template using primers flanking the multiple cloning site in the presence of digoxigenin-11-dUTP. (right) The digoxigenin modified 1 kb PCR reaction product is digested with restriction enzymes to obtain ~500 DNA linker segment (small black arrow) and analyzed on a DNA agarose gel. (d) To assemble the final MT-smFRET DNA molecule, a three segment DNA ligation reaction including the SOI, DNA linker, and DNA handle segments is performed. Ligation efficiency is determined by comparing the ethidium bromide (EtBr) stained gel image of the ligation products with a fluorescence scan for Cy3 and Cy5. The largest band that is yellow (small black arrow) represents the target product possessing a DNA linker, DNA handle, and SOI segment.
-
SOI construction: The DNA oligonucleotides used to construct the SOI segment are generated synthetically with site-specific amino modifications. These modifications allow site-specific dye coupling through standard succinimide chemistry, followed by reverse phase HPLC purification of labeled and unlabled DNA fragments.
Dissolve amino-modified DNA oligonucleotides to be dye labeled (50 nmol) in 30 μL Milli-Q H2O and transfer to a 1.5 ml of microcentrifuge tubes. Ethanol precipitate to remove residual chemicals from DNA synthesis. Take care to use sodium acetate rather than ammonium acetate during precipitation as residual ammonium salt will quench the amino coupling dye labeling reaction.
Dissolve the mono-reactive dye packs (GE Cy3 or Cy5) with 50 μL of 0.2 M NaHCO3, combine with 50 μL of the appropriate resuspended DNA oligonucleotide, and incubate at 37 °C for 2 h.
Precipitate the dye labeled DNAs and dry pellets.
Purify labeled from unlabeled DNA fragments by reverse-phase HPLC with a C8 column as described [43].
Mix the dye-labeled and SOI DNA oligonucleotide in T50 Buffer in 1.5 μL microcentrifuge tube in a final volume of 30 μL, yielding a final concentration of 0.1 μM of each DNA oligonucleotide.
Anneal the dye labled SOI segments by heating the solution to 95 °C for 4 min, followed by slow cooling to room temperature on the benchtop.
Handle construction: The large magnetic bead introduces a substantial amount of background fluorescence under conditions of both 532 nm and 637 nm laser excitation. Thus is it crucial that the bead not fluctuate into the vicinity of the evanescent field generated by a TIRF microscope. Ideal TIRF systems are typically characterized by depths of illumination on the order of 100–200 nm. However, we have found it preferable to keep the large magnetic bead significantly further from the surface (ie. >1 μm away). To this end, we have used a 5 μm (~15 kb) DNA fragment generated by digesting commercially available lambda DNA with restriction endonucleases (Fig. 4b). Using a 0.6% w/v agarose gel, this lambda fragment can be purified and used for MT-smFRET DNA molecule construction. We note that other hybrid smFRET-MT experiments have utilized shorter DNA handles that were then supercoiled, causing the bead to approach the surface at distances closer to the ~1 μm threshold [32].
Linker construction: A DNA fragment containing digoxigenin modifications is also created in order to specifically immobilize the final molecule to the magnetic bead. This fragment is generated by performing a polymerase chain reaction (PCR) across a plasmid DNA containing a multiple cloning site (MCS) in the presence of digoxigenin-11-dUTP Fig. 4c). Primers are designed to amplify a DNA fragment with a selected endonuclease restriction site positioned approximately in the middle of the fragment. The digoxigenin-modified PCR product is then cut with a restriction enzyme to yield a sticky-end linker fragment for subsequent ligation to the DNA handle. For experiments aiming to study torque-induced structural changes in DNA, it is necessary to torsionally constrain the DNA molecule between the coverglass and the magnetic bead. One can create an additional linker fragment containing biotin-modified dUTP for immobilization at the slide surface.
Ligation Assembly: The final step of the molecule preparation is to perform a multi-component ligation reaction of the (i) SOI segment, (ii) the purified lambda DNA handle, (iii) and the digoxigenin-modified DNA linker fragment (1:1:1 molar ratio of the three fragments at a final concentration of 0.3 μM). Ligations are carried out using manufacturer protocols (NEB). The efficiency of the ligation reaction can be determined by running a diagnostic agarose gel, and comparing an ethidium bromide stained image with a fluorescence scan for the smFRET dyes (Fig. 4d).
3.3. Sample immobilization
As ligation reactions are not 100% efficient, optimization is necessary to minimize the presence of unwanted side products or unreacted material in the sample chamber (Fig. 5). First, an empirically determined dilution of the ligation reaction is incubated with anti-digoxigenin coated magnetic beads, pre-blocked with BSA to avoid nonspecific DNA binding (Fig. 5a). The beads are next washed during a magnetic bead pull-down step to remove any DNA fragments that were not ligated to an anti-digoxigenin DNA linker fragment (Fig. 5b). The washed beads bound with DNA are next introduced onto the streptavidin coated coverglass (see Fig. 3) and allowed to settle to the surface. Following this incubation period, non-immobilized molecules are washed out of the sample chamber using gravity-controlled buffer flow. This immobilization strategy greatly enriches for those beads that are specifically bound to the streptavidin coverglass and the anti-digoxigenin coated magnetic bead (Fig. 5c). An example of our immobilization protocol is included below:
Fig. 5.
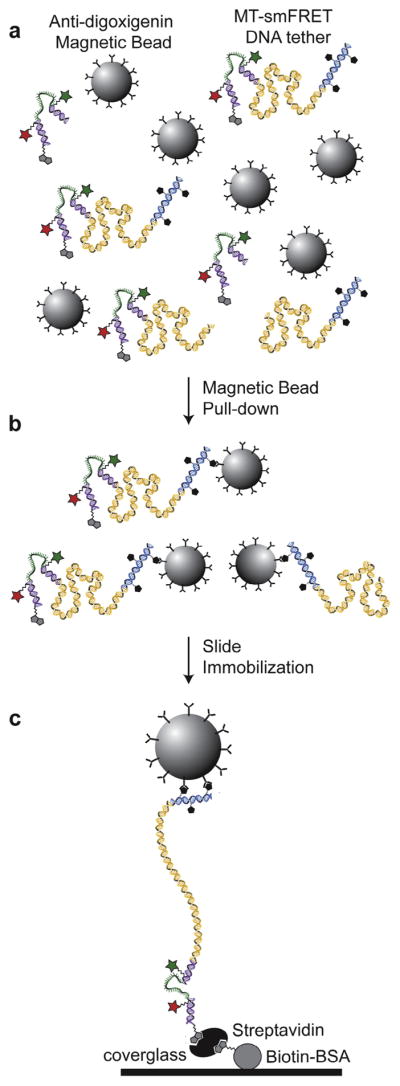
Surface immobilization of DNA molecules for MT-smFRET measurement. (a) Products of DNA ligation reactions are diluted and incubated with pre-blocked anti-digoxigenin coupled magnetic beads. (b) The DNA-magnetic bead mixture is placed on a magnetic separation rack to pull-down only those DNA tethers attached specifically to the antibody coupled magnetic beads via a digoxigenin moiety, while non-digoxigenin modified DNA is washed away at this step. (c) The DNA-magnetic bead mixture is introduced into a sample chamber and immobilized on the coverglass via a biotin-streptavidin linkage. The sample chamber is then gently washed with imaging buffer using gravity controlled buffer exchange to remove any unbound beads. This process greatly enriches for DNA tethers that are site-specifically oriented between the coverglass and magnetic bead.
Wash 50 μL anti-digoxigenin-coated magnetic beads from the stock with 100 mM NaCl and 20 mM Tris (pH 8.0) buffer.
Block the anti-digoxigenin-coated magnetic beads with 500 μL of 5 mg/mL BSA, 50 mM NaCl and 10 mM Tris (pH 8.0) buffer and at 4 °C for at least 1 h.
Dilute the DNA ligation 1:5 with 1 × T4 DNA ligase buffer.
Incubate 6 μL of diluted DNA ligation with 3 μL of blocked anti-digoxigenin-coated magnetic beads at 4 °C for 10 min. Gently agitate the DNA-magnetic bead mixture every 2 min.
Place the DNA-magnetic bead mixtures on a magnetic separation rack. Carefully pipette out the supernatant. Do not allow beads to dry completely.
Resuspend DNA-bound magnetic beads with 200 μL blocking buffer
Store the DNA-bound magnetic beads in 15 μL blocking buffer at 4 °C for up to one day.
Mix 6 μL of DNA-bound magnetic beads with 194 μL of blocking buffer.
Deposit 100 μL of DNA-magnetic beads in blocking buffer to the streptavidin-coated chamber.
Incubate the DNA-magnetic bead mixture at room temperature for 30 min in a humidity chamber with the coverglass side faced down to allow the DNA-bound magnetic beads to settle to the surface by gravity.
Gently wash the chamber with 100 μL of equilibration buffer by gravity to remove the unattached DNA-linked magnetic beads.
3.4. MT-smFRET measurement
A MT-smFRET measurement starts by first identifying a DNA molecule of the appropriate length. This process can be achieved using the eye piece and manual focus knob of the microscope. Once a candidate molecule is found, quality control checks are performed on the molecule before data collection can begin. The first quality control utilizes the rotation stage to check whether the molecule is torsionally constrained. If the molecule is not torsionally constrained, the length of the DNA tether is not affected by rotating the magnets. The length change for a torsionally unconstrained molecule indicates the bead is tethered to the surface by more than one DNA molecule. In the case of experiments utilizing a torsionally constrained DNA tether, the length of the molecule should change as turns are introduced into the molecule. In this instance, one can use the differential response of positively and negatively supercoiled DNA to stretching force as a check for the presence of a single DNA tether [44]. The second quality control is to determine whether the molecule has an active FRET pair by directly exciting both fluorophores. Once the presence of an active smFRET pair has been verified, data is then acquired at the user-determined frame rate and desired stretching force until irreversible photo-bleaching of one of the smFRET dyes is observed. The execution of a typical single molecule experiment is described in detail below:
Prepare oxygen scavenging system (Gloxy) and imaging buffer. Gloxy solution is prepared by mixing 100 mg/mL of glucose oxidase, 4 mg/mL of catalase, 50 mM NaCl and 10 mM Tris (pH 8.0) buffer. Imaging buffer includes 50 mM Tris pH 8.0, 100 mM NaCl, 0.4% w/v D-glucose, and is then saturated with Trolox and filtered twice through a 0.2 μm syringe filter.
Prepare imaging buffer with oxygen scavenging system by mixing 2 μL of Gloxy solution with 200 μL of imaging buffer.
Gently flow 100 μL of imaging buffer plus oxygen scavenging system into the chamber by gravity. Secure the prepared slide on the microscope.
Move the magnet several millimeters above the slide to apply sufficient stretching force to extend the DNA molecule (~2–4 pN). Then use the low magnification side port CCD camera and video monitor to locate a bead that appears to be fluctuating the expected distance from the surface (longer tethers exhibit larger fluctuations). Since the DNA tethers for our MT-smFRET experiments are long (~5 μm) this qualitative screening step is readily achieved by eye.
Next, apply positive or negative torque into molecule to check if the bead is anchored by a single DNA molecule. The extension of a single MT-smFRET DNA tether that is torsionally unconstrained should not change as turns are introduced. Again, changes in the z-position of the bead are readily detected by eye during this step. The same check can be performed when utilizing a torsionally constrained DNA tether. However in this instance, one can use the differential response of positive and negative supercoiling to check for the presence of a single DNA tether [44].
After modifying the optics for observation of the FRET dyes, use the red (637 nm) laser to verify the presence of an active Cy5 dye located directly under the magnetic bead. Since the dye molecule is located ~5 μm away from the magnetic bead, it is necessary to focus the objective down toward the surface to observe the fluorescence signal. We find using the micrometer markings on the focus knob of the microscope to be sufficient to get close to the focus plane of the surface during fluorescence imaging.
Next, use the green (532 nm) laser to verify the presence of an active Cy3 molecule located directly under the magnetic bead.
Once the presence of an active smFRET pair has been verified, set the magnet assembly to the desired linear position, acquire movie (typically 10–30 frames per second) until dyes photo-bleach.
3.5. smFRET data analysis
All smFRET data analysis for our experiments was performed using custom software routines written in Labview and Matlab. Raw movie files captured on the Andor EMCCD camera were analyzed to extract the donor and acceptor dye intensities. At the magnification level of our microscope, each point source occupies approximately a 3 × 3 pixel square area. For each frame of the movie file, donor and acceptor channel background was calculated using a 3 × 3 region of interest (ROI) located on the CCD chip away from the dye molecules. The total background for each channel was calculated by summing all of the average pixel intensity values within the background ROI over a total of 50 frames. The smFRET data was then collected by manually placing the cursor on the center position of the FRET dye in each channel. Programmatically, the local maximum (of the dye image on the CCD) was found and a 3 × 3 pixel ROI was summed around this centroid to give the total dye intensity on a per frame basis for each fluorophore. The average background was subtracted from this value on a per frame basis, and FRET values were calculated using the standard FRET equation Ia/(Ia + Id), where Ia is the acceptor intensity and Id is the donor intensity. Subsequent data analysis in our lab is typically performed using custom written Matlab programs to analyze the smFRET time trajectories.
4. Applications of MT-smFRET
The first experiment combining MT with smFRET was used to dissect the force-induced stretching of single-stranded DNA. In this study, Shroff et al. built a smFRET-based force sensor consisting of a single stranded DNA attached with donor and acceptor dye molecules [34]. They established the relationship between the applied stretching forces and smFRET efficiency. Using this correlation, they were able to determine the internal force sensed by a single-stranded DNA during partial conversion to double-stranded DNA.
Using a similar setup, research in our laboratory characterized the mechanical unfolding pathway of human telomere G-quadruplexes (GQs) [33]. In this experiment, a MT system was used to apply mechanical force to perturb the folding dynamics of telomere GQs, whereas smFRET reported on the structural transitions in a single telomere GQ (Fig. 6a). By analyzing the effect of the stretching force on GQ folding and unfolding, we determined the physical distance to the transition state for the GQ folding pathway. These measurements revealed that the GQ is a relatively brittle DNA structure that readily unfolds after slight structural deformation.
Fig. 6.

(a) smFRET trajectories of a single GQ molecule flanked by donor and acceptor dyes held under three different forces (0.7, 2.5 and 5.1 pN). At low forces, the molecule spends the majority of the time in the high-FRET (folded) state. In contrast, a higher force (5.1 pN) substantially shifts the telomere DNA GQ folding equilibrium toward the low-FRET (unfolded) state. smFRET trajectory is plotted together with the idealized FRET trace (red) generated by hidden Markov modeling using HaMMy fitting software (this figure is modified from [33]). (b) smFRET trajectory of a DNA molecule containing the GC core DNA flanked by donor and acceptor dyes held under 1.4 pN with three different superhelical density (−0.011, −0.012 and −0.013). When the molecule is underwound by magnetic tweezers, the FRET efficiency changes from a high to a low value, indicating the transition from the B-form to the Z-form. Single-molecule FRET trajectories are fitted with a hidden Markov model yielding idealized FRET traces (red) (this figure is adapted from [32]).
The MT-smFRET instrument not only enables the detection and application of stretching forces on DNA molecules, but also can be used to study the response of DNA molecules under torque. Taking advantage of this application, Lee et al. detected the B-to-Z DNA transition under torsion and tension [32]. In this study, MT was used to apply torque to duplex DNA molecules containing GC repeats (Fig. 6b). By simultaneously tracking the smFRET efficiency from the donor and acceptor dyes flanking the GC repeats, as well as changes in the overall extension of the supercoiled DNA tether, they directly observed the B-to-Z conformational change under minute negative superhelicity at low tension, which highlights the highly cooperative and dynamic nature of the B-Z transition.
These studies provided unique insights into the mechanical properties of DNA structures, with implications for the mechanisms of DNA binding proteins that remodel nucleic acid structure, and demonstrated the general utility of the integrated MT-smFRET assay.
5. Conclusion
In summary, here we describe the MT-smFRET method to analyze mechanical properties of nucleic acids. The integration of these single-molecule methods permits measurement of mechanically induced structural transitions with sub-nanometer spatial resolution over a wide range of stretching forces and torques. A nucleic acid SOI is embedded within a long DNA molecule, flanked by smFRET probes, and oriented between a microscope slide and a magnetic bead. In this way, stretching forces and torques allow physical manipulation of the SOI, while smFRET provides a method of interrogating the SOI structure and confromation. We anticipate that the MT-smFRET study of nucleic acid structure will be easily adapted for experiments aiming to interrogate the mechanical response of other biological macromolecules and systems.
Acknowledgments
The authors are appreciative of members of the Stone Research Group for helpful discussions about this work. We thank Benjamin Akiyama, Cheng Lu, Clive Bagshaw, Scott Blanchard and Roger Altman for helpful comments on early versions of the manuscript. This work was supported by the National Institutes of Health [GM095850-02 to M.D.S.] and the National Science Foundation [DGE 0809125 to J.W.P.].
Footnotes
Competing financial interests
The authors declare no competing financial interests.
References
- 1.Brenner MD, Zhou R, Ha T. Forcing a connection: impacts of single-molecule force spectroscopy on in vivo tension sensing. Biopolymers. 2011;95(5):332–344. doi: 10.1002/bip.21587. [DOI] [PMC free article] [PubMed] [Google Scholar]
- 2.Bustamante C, et al. Mechanical processes in biochemistry. Annu Rev Biochem. 2004;73:705–748. doi: 10.1146/annurev.biochem.72.121801.161542. [DOI] [PubMed] [Google Scholar]
- 3.Dulin D, et al. Studying genomic processes at the single-molecule level: introducing the tools and applications. Nat Rev Genet. 2013;14(1):9–22. doi: 10.1038/nrg3316. [DOI] [PubMed] [Google Scholar]
- 4.Abels JA, et al. Single-molecule measurements of the persistence length of double-stranded RNA. Biophys J. 2005;88(4):2737–2744. doi: 10.1529/biophysj.104.052811. [DOI] [PMC free article] [PubMed] [Google Scholar]
- 5.Dawid A, et al. Single-molecule study of RuvAB-mediated Holliday-junction migration. Proc Natl Acad Sci USA. 2004;101(32):11611–11616. doi: 10.1073/pnas.0404369101. [DOI] [PMC free article] [PubMed] [Google Scholar]
- 6.Kim K, Saleh OA. A high-resolution magnetic tweezer for single-molecule measurements. Nucleic Acids Res. 2009;37(20):e136. doi: 10.1093/nar/gkp725. [DOI] [PMC free article] [PubMed] [Google Scholar]
- 7.Kruithof M, et al. Single-molecule force spectroscopy reveals a highly compliant helical folding for the 30-nm chromatin fiber. Nat Struct Mol Biol. 2009;16(5):534–540. doi: 10.1038/nsmb.1590. [DOI] [PubMed] [Google Scholar]
- 8.Lionnet T, et al. Wringing out DNA. Phys Rev Lett. 2006;96(17):178102. doi: 10.1103/PhysRevLett.96.178102. [DOI] [PubMed] [Google Scholar]
- 9.van Loenhout MT, et al. Dynamics of RecA filaments on single-stranded DNA. Nucleic Acids Res. 2009;37(12):4089–4099. doi: 10.1093/nar/gkp326. [DOI] [PMC free article] [PubMed] [Google Scholar]
- 10.Stone MD, et al. Chirality sensing by Escherichia coli topoisomerase IV and the mechanism of type II topoisomerases. Proc Natl Acad Sci USA. 2003;100(15):8654–8659. doi: 10.1073/pnas.1133178100. [DOI] [PMC free article] [PubMed] [Google Scholar]
- 11.Bustamante C, Bryant Z, Smith SB. Ten years of tension: single-molecule DNA mechanics. Nature. 2003;421(6921):423–427. doi: 10.1038/nature01405. [DOI] [PubMed] [Google Scholar]
- 12.Neuman KC, Nagy A. Single-molecule force spectroscopy: optical tweezers, magnetic tweezers and atomic force microscopy. Nat Methods. 2008;5(6):491–505. doi: 10.1038/nmeth.1218. [DOI] [PMC free article] [PubMed] [Google Scholar]
- 13.Smith SB, Cui Y, Bustamante C. Overstretching B-DNA: the elastic response of individual double-stranded and single-stranded DNA molecules. Science. 1996;271(5250):795–799. doi: 10.1126/science.271.5250.795. [DOI] [PubMed] [Google Scholar]
- 14.Smith SB, Finzi L, Bustamante C. Direct mechanical measurements of the elasticity of single DNA molecules by using magnetic beads. Science. 1992;258(5085):1122–1126. doi: 10.1126/science.1439819. [DOI] [PubMed] [Google Scholar]
- 15.Yu Z, et al. A force calibration standard for magnetic tweezers. Rev Sci Instrum. 2014;85(12):123114. doi: 10.1063/1.4904148. [DOI] [PubMed] [Google Scholar]
- 16.De Vlaminck I, et al. Highly parallel magnetic tweezers by targeted DNA tethering. Nano Lett. 2011;11(12):5489–5493. doi: 10.1021/nl203299e. [DOI] [PubMed] [Google Scholar]
- 17.Abbondanzieri EA, et al. Direct observation of base-pair stepping by RNA polymerase. Nature. 2005;438(7067):460–465. doi: 10.1038/nature04268. [DOI] [PMC free article] [PubMed] [Google Scholar]
- 18.Moffitt JR, et al. Differential detection of dual traps improves the spatial resolution of optical tweezers. Proc Natl Acad Sci USA. 2006;103(24):9006–9011. doi: 10.1073/pnas.0603342103. [DOI] [PMC free article] [PubMed] [Google Scholar]
- 19.Carter AR, Seol Y, Perkins TT. Precision surface-coupled optical-trapping assay with one-basepair resolution. Biophys J. 2009;96(7):2926–2934. doi: 10.1016/j.bpj.2008.12.3933. [DOI] [PMC free article] [PubMed] [Google Scholar]
- 20.Huhle A, et al. Camera-based three-dimensional real-time particle tracking at kHz rates and Angstrom accuracy. Nat Commun. 2015;6:5885. doi: 10.1038/ncomms6885. [DOI] [PMC free article] [PubMed] [Google Scholar]
- 21.Dulin D, et al. High spatiotemporal-resolution magnetic tweezers: calibration and applications for DNA dynamics. Biophys J. 2015;109(10):2113–2125. doi: 10.1016/j.bpj.2015.10.018. [DOI] [PMC free article] [PubMed] [Google Scholar]
- 22.Liphardt J, et al. Reversible unfolding of single RNA molecules by mechanical force. Science. 2001;292(5517):733–737. doi: 10.1126/science.1058498. [DOI] [PubMed] [Google Scholar]
- 23.Woodside MT, et al. Nanomechanical measurements of the sequence-dependent folding landscapes of single nucleic acid hairpins. Proc Natl Acad Sci USA. 2006;103(16):6190–6195. doi: 10.1073/pnas.0511048103. [DOI] [PMC free article] [PubMed] [Google Scholar]
- 24.Cecconi C, et al. Direct observation of the three-state folding of a single protein molecule. Science. 2005;309(5743):2057–2060. doi: 10.1126/science.1116702. [DOI] [PubMed] [Google Scholar]
- 25.Neuman KC, Lionnet T, Allemand JF. Single-molecule micromanipulation techniques. Annu Rev Mater Res. 2007;37:33–67. [Google Scholar]
- 26.Ha T. Single-molecule fluorescence methods for the study of nucleic acids. Curr Opin Struct Biol. 2001;11(3):287–292. doi: 10.1016/s0959-440x(00)00204-9. [DOI] [PubMed] [Google Scholar]
- 27.Roy R, Hohng S, Ha T. A practical guide to single-molecule FRET. Nat Methods. 2008;5(6):507–516. doi: 10.1038/nmeth.1208. [DOI] [PMC free article] [PubMed] [Google Scholar]
- 28.Ha T, et al. Probing the interaction between two single molecules: fluorescence resonance energy transfer between a single donor and a single acceptor. Proc Natl Acad Sci USA. 1996;93(13):6264–6268. doi: 10.1073/pnas.93.13.6264. [DOI] [PMC free article] [PubMed] [Google Scholar]
- 29.Lang MJ, et al. Simultaneous, coincident optical trapping and single-molecule fluorescence. Nat Methods. 2004;1(2):133–139. doi: 10.1038/nmeth714. [DOI] [PMC free article] [PubMed] [Google Scholar]
- 30.Zhou R, et al. SSB functions as a sliding platform that migrates on DNA via reptation. Cell. 2011;146(2):222–232. doi: 10.1016/j.cell.2011.06.036. [DOI] [PMC free article] [PubMed] [Google Scholar]
- 31.Hohng S, et al. Fluorescence-force spectroscopy maps two-dimensional reaction landscape of the holliday junction. Science. 2007;318(5848):279–283. doi: 10.1126/science.1146113. [DOI] [PMC free article] [PubMed] [Google Scholar]
- 32.Lee M, Kim SH, Hong SC. Minute negative superhelicity is sufficient to induce the B-Z transition in the presence of low tension. Proc Natl Acad Sci USA. 2010;107(11):4985–4990. doi: 10.1073/pnas.0911528107. [DOI] [PMC free article] [PubMed] [Google Scholar]
- 33.Long X, et al. Mechanical unfolding of human telomere G-quadruplex DNA probed by integrated fluorescence and magnetic tweezers spectroscopy. Nucleic Acids Res. 2013;41(4):2746–2755. doi: 10.1093/nar/gks1341. [DOI] [PMC free article] [PubMed] [Google Scholar]
- 34.Shroff H, et al. Biocompatible force sensor with optical readout and dimensions of 6 nm3. Nano Lett. 2005;5(7):1509–1514. doi: 10.1021/nl050875h. [DOI] [PubMed] [Google Scholar]
- 35.Kemmerich FE, et al. Simultaneous single-molecule force and fluorescence sampling of DNA nanostructure conformations using magnetic tweezers. Nano Lett. 2016;16(1):381–386. doi: 10.1021/acs.nanolett.5b03956. [DOI] [PubMed] [Google Scholar]
- 36.Comstock MJ, Ha T, Chemla YR. Ultrahigh-resolution optical trap with single-fluorophore sensitivity. Nat Methods. 2011;8(4):335–340. doi: 10.1038/nmeth.1574. [DOI] [PMC free article] [PubMed] [Google Scholar]
- 37.Axelrod D, Burghardt TP, Thompson NL. Total internal reflection fluorescence. Annu Rev Biophys Bioeng. 1984;13:247–268. doi: 10.1146/annurev.bb.13.060184.001335. [DOI] [PubMed] [Google Scholar]
- 38.Axelrod D. Total internal reflection fluorescence microscopy in cell biology. Methods Enzymol. 2003;361:1–33. doi: 10.1016/s0076-6879(03)61003-7. [DOI] [PubMed] [Google Scholar]
- 39.Vilfan ID, et al. Magnetic tweezers for single-molecule experiments. Handbook of Single-Molecule Biophysics. 2009:371–395. [Google Scholar]
- 40.Lipfert J, Hao X, Dekker NH. Quantitative modeling and optimization of magnetic tweezers. Biophys J. 2009;96(12):5040–5049. doi: 10.1016/j.bpj.2009.03.055. [DOI] [PMC free article] [PubMed] [Google Scholar]
- 41.Bustamante C, et al. Entropic elasticity of lambda-phage DNA. Science. 1994;265(5178):1599–1600. doi: 10.1126/science.8079175. [DOI] [PubMed] [Google Scholar]
- 42.Bouchiat C, et al. Estimating the persistence length of a worm-like chain molecule from force-extension measurements. Biophys J. 1999;76(1 Pt 1):409–413. doi: 10.1016/s0006-3495(99)77207-3. [DOI] [PMC free article] [PubMed] [Google Scholar]
- 43.Akiyama BM, Stone MD. Assembly of complex RNAs by splinted ligation. Methods Enzymol. 2009;469:27–46. doi: 10.1016/S0076-6879(09)69002-9. [DOI] [PubMed] [Google Scholar]
- 44.Strick TR, et al. Behavior of supercoiled DNA. Biophys J. 1998;74(4):2016–2028. doi: 10.1016/S0006-3495(98)77908-1. [DOI] [PMC free article] [PubMed] [Google Scholar]