Abstract
Purpose
To validate electromagnetic and thermal simulations with in vivo temperature measurements. To demonstrate a framework that can be used to predict temperature increase caused by radiofrequency (RF) excitation with dipole transmitter arrays.
Methods
Dipole arrays were used to deliver RF energy in the back/neck region of swine using different RF excitation patterns (n = 2–4 per swine) for heating. The temperature in anesthetized swine (n=3) was measured using fluoroscopic probes (n=12) and compared against thermal modeling from animal specific electromagnetic simulations.
Results
Simulated temperature curves were in agreement with the measured data. Root mean square error (RMSE) between simulated and measured temperature rise at all locations (at the end of each RF excitation) is calculated as 0.37 °C. Mean - experimental temperature rise at the maximum temperature rise locations (averaged over all experiments) is calculated as 2.89 °C. The RMSE between simulated and measured temperature at the maximum temperature rise location is calculated as 0.57 °C. (Error values are averaged over all experiments).
Conclusion
EM & Thermal simulations were validated with experiments. Thermal effects of RF excitation at 10.5 T with dipoles were investigated.
Keywords: 10.5 T, radiofrequency (RF), Dipole Arrays, SAR, Temperature
Introduction
Ultra-high field (UHF) Magnetic Resonance Imaging (MRI) yields higher signal to noise ratio (SNR), and increased sensitivity (1,2) than conventional MRI. Despite these advantages, various safety issues limit the use of these systems. Radio-frequency (RF) heating is one of those major safety issues. Previous studies have evaluated the thermal effects of RF heating with simulations and experiments (3,4). As a result, diverse engineering solutions were proposed to control and mitigate Specific Absorption Rate (SAR) (5–8) and temperature rise in UHF applications (9).
Multi-Channel excitation is oneexample of such an engineering solution used to overcome RF excitation problems. Previous studies demonstrated the value of multi-channel excitation for improving image quality (5,10) as well as SAR reduction/control (5,11). The advances in multi-channel excitation methods consist of both software and hardware based solutions. Software solutions typically include novel pulse design algorithms implemented to control desired imaging parameters such as transmit B1 homogeneity, flip angle homogeneity(1,5,12), or various safety factors such as global SAR peak local 10 gr average SAR (5) and/or temperature rise (9). On the other hand, hardware based solutions typically focus on optimizing the transmit antenna arrays for RF excitation. For example, novel coil elements/arrays are utilized to alleviate RF safety issues in UHF-MRI (2,6,13,14).
Among many transmit coil designs, the dipole antenna is a promising transmit element that is suitable specifically for UHF applications (15,16). Originally proposed in a previous work (16) different dipole antenna designs were used in UHF studies to address various imaging problems(17) In addition to its simplicity, dipole elements have unique field patterns which make them an interesting element to use simultaneously with existing designs(6,18,19).
In a typical UHF imaging scenario, it is critical to mitigate image inhomogeneity by controlling either the transmit B1 (B1+) distribution or the flip angle distribution in a target organ of interest. For that purpose, the B1 maps of individual coil elements can be measured in a subject specific manner using various techniques (20,21). Then, these measured maps can be used to generate a homogenous B1 field or flip angle distribution in a region of interest by using RF shimming or pulse design algorithms. Unfortunately, it is not a simple task to measure the SAR or temperature using similar subject specific solutions. Different techniques have been proposed to estimate SAR from B1 measurements. However, the accuracy of these techniques in estimating local SAR and temperature in-vivo is limited (22,23). On the other hand, many EM and thermal simulation studies have been performed in the past to assess the thermal effects of RF excitation in MRI. These studies helped us gain better understanding of the risks associated with RF heating.
In order to predict the temperature increase in a subject during an MR scan, one needs validated electromagnetic (EM) and thermal simulation tools as well as realistic anatomical models. Therefore in-vivo validation of such simulation tools and models is crucial. In this work, we conducted RF heating experiments at 447 MHz (i.e. 10.5 T proton Larmor frequency) on anesthetized animals in a controlled RF safety lab environment. We measured temperature in anesthetized swine using fluoroscopic probes and compared our results to the simulated solutions obtained from a digital model of the same swine with specific arrangement of the dipole antennas in each case For our studies, we used a 4 channel fractionated dipole array (15) that is placed on the neck/upper back region. Electromagnetic and thermal simulations were performed along with in vivo experiments with different RF excitation patterns at 10.5 T.
Methods
Animal Preparation & Experimental Setup
RF heating experiments were performed on 3 swine (Yorkshire-cross) in a controlled RF safety lab environment. The weights of these swine varied between 70–75 kg. All experiments were conducted in accordance with a UMN IACUC approved protocol (ID: 1408-31748A). Swine were acclimated in the Research Animal Resources center (RAR) for 2–3 days prior to the experimental procedures in order to minimize anxiety and subsequently fasted for 12 h prior to the induction of the anesthesia to avoid complications (3). Water was provided to the animals during fasting.
Telazol (5–10 mg/kg) and Xylazine (1–3 mg/kg) was delivered via intramuscular injection. Then we transported the swine to the preparation room and immediately started to monitor physiological parameters (SpO2, ETCO2, Heart Rate, Temperature) using a patient monitor (Invivo 3150 MRI, Gainsville, FL). We intubated the swine and delivered isoflurane (~1.5%), in 50% air/50% oxygen mixture using a ventilator (Ohmeda 7000) (respiratory rate of 11–12 cycles/min was used). Finally, the ear vein was catheterized through which a saline solution (0.9 % NaCL) was administered to prevent dehydration during the experiments.
After observing vitals for 15–30 minutes in order to make sure that they were stable and within appropriate ranges the animals were transferred to the RF safety lab in the CMRR. Monitoring of vitals continued throughout RF heating and recovery until euthanasia in order to ensure that sufficient anesthetic depth was maintained and no pain was experienced by the animal. The animals were placed in the ventral position on a PVC table where the heating experiments were conducted. Dipoles were placed on the animal’s neck-back region and fixed in their locations by using a double sided adhesive tape (3M, Maplewood, US). After coil placement, S parameters of the 4 dipole array were measured using a network analyzer. Then 12 fluoroscopic temperature probes were placed in the swine’s neck and upper back at depths varying between 2 cm and 4 cm in the vicinity of the dipole elements. In addition, one liquid-in-glass thermometer was placed in the rectum of the animal. Fluoroscopic probes were used to record continuous temperature data whereas the rectal probe was used to record rectal temperature every 15 minutes, or when needed.
To drive the 4 dipole elements, a custom built transmit array system was used for the heating experiments (Figure 1). An RF signal generator (HP 83620B-H80, CA,USA) was used to drive a Phase and Gain controller (PGC) (CPC, New York, USA) at 447.05 MHz. The output channels of the PGC were connected to the RF amplifiers. 4 broadband RF Amplifiers (CPC MRI Plus, New York, USA) with 2 kW peak power, were used to generate RF excitation. An Arduino circuit board provided an un-blanking signal to the PGC unit in order to generate a 10 % RF duty cycle. To calibrate the system, the amplifier outputs were connected to 50 dB directional couplers (Werlatone Inc, New York, USA) using LMR-400 type cables. We monitored the attenuated forward signal from the directional couplers with an oscilloscope. A separate computer was used to control the phase and gain levels of the PGC to generate the desired excitation patterns. Once the calibration is complete we removed the directional couplers, disconnected the oscilloscope and connected the amplifier outputs directly to the coil elements using the same set of cables used during calibration.
Figure 1.
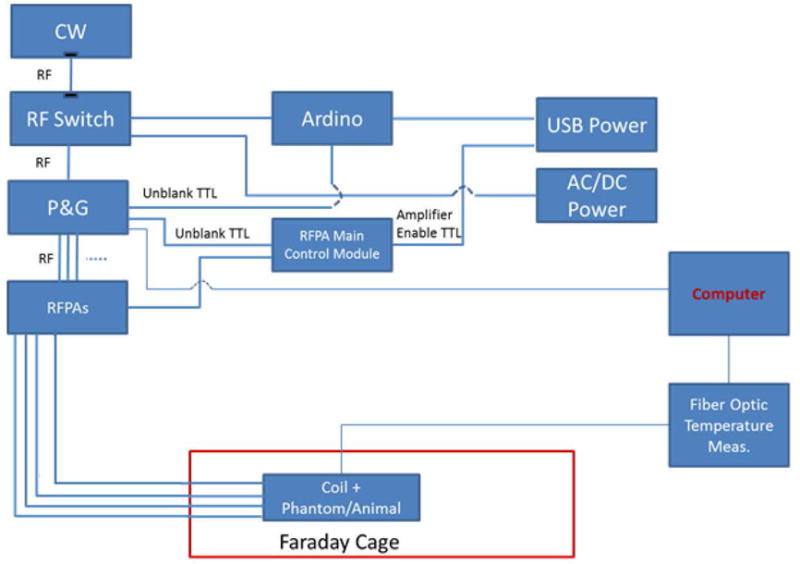
The schematic of the equipment and the RF safety lab environment used during the experiments is shown.
Heating Experiments
The 4 fractionated dipole antennas used to deliver RF energy were designed for body imaging at 10.5T (17). The animals, coil elements and the thermal probes remained inside the faraday cage during the whole RF heating experiment. Amplifiers, PGC, signal generator, oscilloscope, controller computer and the temperature sensor device were all outside of the faraday cage. The metal door of the faraday cage/experiment room was sealed before the RF was turned on in order to prevent any interactions between leaking RF energy and the temperature measurement devices/vital monitors. Figure 1 shows the schematics of the RF safety lab set-up that we used for these experiments.
The duration of RF energy delivery varied from 8 to 15 minutes for different excitation patterns. In order to prevent skin burns, we manually stopped the RF excitation if/when 39 °C was reached at any probe location. In order to keep track of the core temperatures of the animals we recorded the reading on the rectal temperature probe right before and after each RF excitation. After experimenting with each different RF pattern, we waited for the 12 fluoroscopic probe temperature readings to go back to their initial value (i.e. the cool down period). This ensured that we started a new experiment with the next RF pattern at an initial thermal steady state point. Depending on the pattern that was applied, the cool down period took between 45–90 minutes. Table 1 shows the duration of the different excitation patterns. After experimenting with different RF patterns and gathering sufficient data from each animal, the animals were euthanized by injecting (IV) pharmaceutical grade saturated KCL (1–2meq/kg) while the animals were under continuous anesthesia (Euthanasia was confirmed by a veterinary technician after analyzing the vital parameters). After euthanasia, the swine was transferred to a CT scanner without moving the coils and probes from their locations on the swine. The swine was scanned to obtain axial images of the swine, probes and coil elements. As the conductors on the dipole elements caused severe artifacts in the images, two sets of images of the swine at the exact same location were acquired, one with the dipoles in place and one with them removed. Acquiring both sets of images improved the anatomical segmentation in the vicinity of the coil elements.
Table 1.
Maximum ΔT (among all 12 probe locations) at the end of different excitations are shown along with durations of different excitations. The root mean square errors in ΔT obtained by simulations and experiments are also presented for each excitation pattern.
| PIG#/RF Pattern | Duration of Exposure(sec) | Maximum ΔT over 12 Probes-Simulation (°C) | RMSE (°C) |
|---|---|---|---|
| PiG1/Single Element(D2) | 900 | 2.1 | 0.24 |
| PIG 1/In Phase | 480 | 3.0 | 0.46 |
| PIG 1/Out of Phase | 480 | 3.9 | 0.37 |
| PIG2/Single Element (D1) | 780 | 3.1 | 0.24 |
| PIG2/Pattern 1 | 720 | 2.3 | 0.39 |
| PIG2/Pattern 2 | 660 | 2.5 | 0.28 |
| PIG2/Pattern 3 | 900 | 3.4 | 0.42 |
| PIG3/Pattern 1 | 540 | 2.6 | 0.54 |
| PIG3/Pattern 2 | 560 | 2.8 | 0.43 |
Simulations
The CT images were automatically segmented to obtain different tissue types including fat, muscle, bone, skin and inner air. Fat, muscle and bone tissues were segmented by thresholding the Hounsfield units; inner air was segmented by filling the interior ‘holes’ in the swine; and skin was obtained by identifying fat and muscle voxels that were less than 6 mm away from the background. Similarly, thermal probes and the dielectric material of the dipole blocks were also segmented from the same images.
The segmented images were converted to voxel models (.raw) and its associated descriptor files (.txt), and uploaded them in the EM simulation software (Sim4Life v2.2, ZMT, Zurich, Switzerland). Fractionated dipole models were created in the software and placed them at the same locations where the dipole blocks were located in our digital swine model. We assigned appropriate EM property values (conductivity and permittivity) to each tissue(24) and structure(25) in the model. In order to model the details of the meander structures and the excitation ports of the dipoles, we used a grid size which varied between 0.12 mm and 1 mm. We visually investigated the voxels generated by the software, analyzed connectivity and made sure that the model had sufficient resolution and accuracy. Then we performed EM simulations using harmonic signal analysis of the software (the coil coupling is also taken into account in our EM simulations). Simulations were run for 50 cycles, which was observed to be sufficient for the convergence of the solver. S parameters of the dipole arrays, SAR distributions and B1+ patterns of individual coil elements were calculated. Thermal simulations were performed using Sim4Life which has a thermal solver based on the Penne’s Bio-heat equation(26). In our thermal simulations each tissue was assigned a perfusion coefficient value independent of the temperature. The blood temperature was also assumed constant. RF excitation patterns were generated (as used during the experiments) in the software by adjusting the phase and amplitudes of 4 signal sources. Then the temperature distribution was solved inside the body. The dipole elements were excluded from the thermal simulation in order to prevent convergence issues due to highly conducting materials, such as copper. Neumann boundary conditions were assigned with zero heat flux (insulation) for the inner air-tissue interface and mixed boundary conditions were assigned for the skin to outer air interface. Temperature maps were generated and the temperature at the probe tips was plotted with respect to time.
Results
Figure 2 shows the CT based anatomical swine model in Sim4Life. The anatomy is segmented into fat, muscle, bone, skin and inner air regions. The thermal probes and dipole blocks were also segmented from the same images. The dipoles were placed in the animal specific Sim4life body models at locations matching those used experimentally. The relative positions of the dipoles and the probes on swine 1 can be seen in Figure 2. Figure 3 shows the dipole and the probe locations for all three swines. Figure 2 also shows the S parameter matrices obtained from experiments and simulations. As it can be seen from the diagonal values of the S parameter matrices, the dipoles were not exactly matched to 50 ohms. Maximum reflection coefficients of −5.73 dB and −5.76 dB were measured (dipole 2) in the experiment and the simulation respectively. The lowest reflection coefficients were observed in dipole 1 as −10.9 dB in the experiment and −12.35 dB in the simulation. Mismatches at the dipole ports were expected since no attempt was made to match and tune the dipole elements. The maximum coupling between neighboring elements was measured as −23.42 dB (experiment) and −21.84 dB (simulations) which indicated a weak coupling between dipoles. Figure 4 shows the simulated SAR distribution (axial/sagittal planes) in swine 1 obtained as a result of 3 different excitation patterns. The constructive and destructive interference of electric fields resulted in increased (pattern 2) and decreased (pattern 3) local SAR in regions between the elements. Almost perfect field cancellation was obtained in the sagittal plane with pattern 3.
Figure 2.
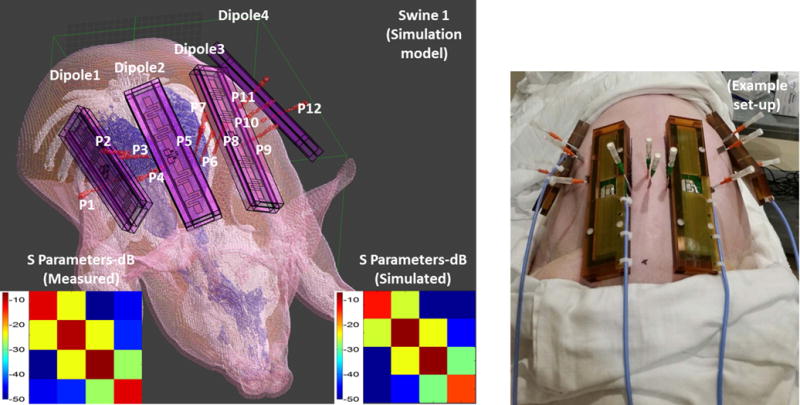
Anatomical swine models are generated from CT images. Anatomy is segmented to fat, muscle, bone, skin and inner air. Thermal probes and dipole blocks were also segmented from the same images. S parameter matrices obtained from experiments and simulations are also shown.
Figure 3.
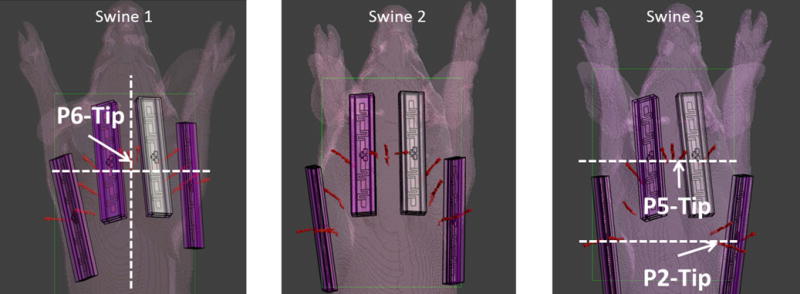
The dipole and the probe locations are shown for all swines. In addition the locations of the planes that are used to calculate the SAR (Figure 4) and temperature increase (Figure 5 & 6) are also shown
Figure 4.
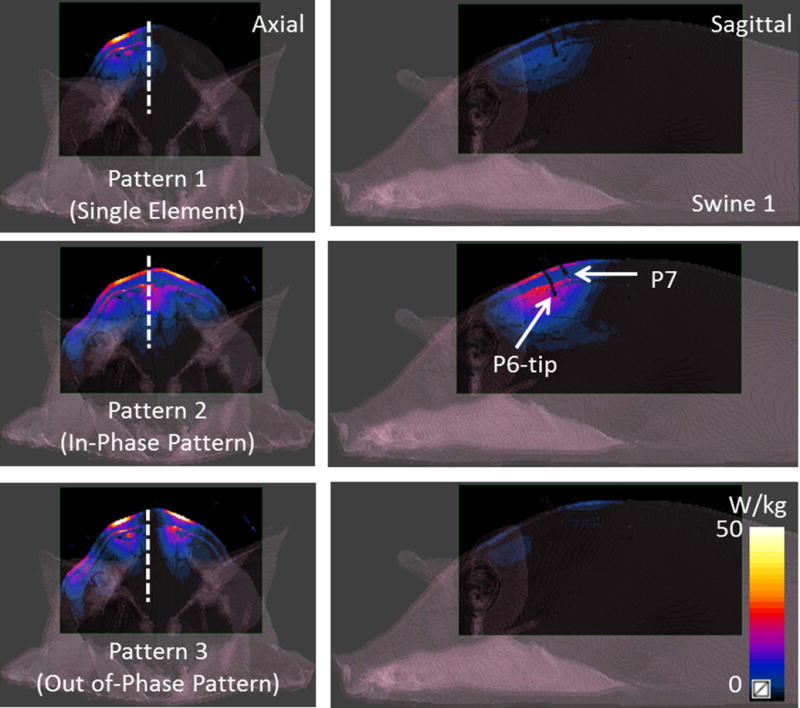
Simulated axial and sagittal SAR patterns due to 3 excitation patterns (the single element pattern, in-phase and out of phase patterns) are shown for swine 1. Drastic difference in SAR due to constructive and destructive interference of electric fields can be seen in patterns 2 and 3.
Figure 5 shows the simulated temperature distribution (axial/sagittal planes) in swine 1 resulting from the SAR distributions shown in Figure 4. Sagittal plane passes through the tip of probe 6 as it can be seen from Figure 3. The single element pattern was applied for 15 minutes whereas pattern 2 and 3 were applied for 8 minutes. Note that the resulting temperature distribution is slightly different than the SAR distribution since temperature is determined by additional variables including perfusion levels, specific heat capacity and thermal conductivity. Maximum temperature increase (measured by the probes) with patterns 1 through 3 were 2.1 °C, 3.0 °C and 3.9 °C respectively. A sagittal temperature map passing between dipoles 2 and 3 shows the resulting distribution due to in-phase and out of phase excitation patterns. Note that the destructive interference of electric fields in pattern 3 resulted in decreased temperature between the elements. Similarly, pattern 2 caused constructive interference of the electric fields resulting in higher temperatures between the dipoles.
Figure 5.
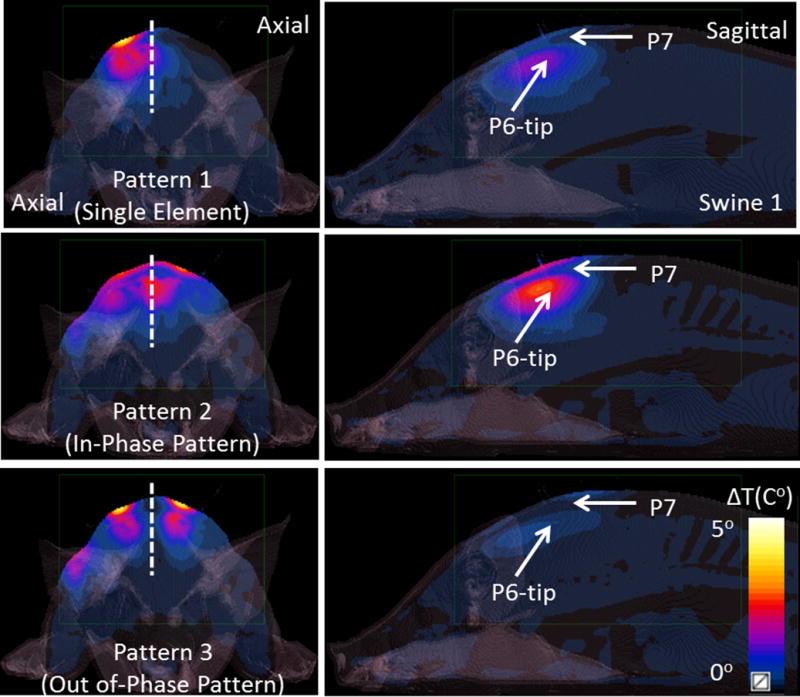
Simulated axial and sagittal temperature maps are shown for 3 excitation patterns presented in Figure 3. Pattern 1 (the single element pattern) was applied for 900 seconds whereas pattern 2 (in-phase pattern) and pattern 3 (out of phase pattern) were applied for 480 seconds.
Figure 6 shows the simulated temperature increase (axial planes passing through probe 2 and probe 5 tips) in swine 3, for pattern 1.
Figure 6.

Simulated temperature maps are shown (Swine 3, Pattern 1) at two axial planes containing the tips of two probes probe 2 and probe 5.
Figure 7 shows the time variation of the temperature increase at the 12 probe locations obtained with excitation pattern 3 (the out-of-phase pattern). Plots show both the simulated and experimental data. Note that the temperature at probes 3, 6, 7 and 10 (probes that are located equidistant from two dipoles) is significantly less in comparison to other locations. This result can be explained by a reduced local SAR resulting from the cancellation of electric fields between the dipoles. This finding requires that electric fields of neighboring dipoles to be opposed in phase. The calibration of the amplifiers is indirectly confirmed by these results showing similar cancellation in both simulation and experimentally. The root mean square error (RMSE) between simulated and measured temperatures (evaluated at the end of RF excitation, averaged over all probe locations) was 0.37 °C for this specific pattern.
Figure 7.
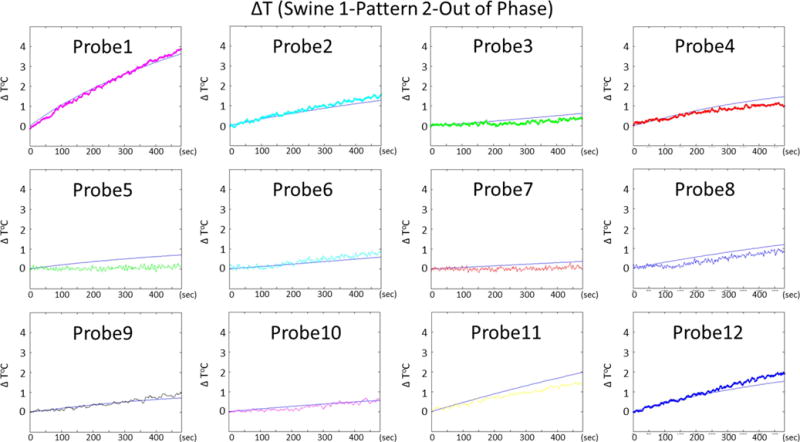
Temporal variations of temperature rise at 12 probe locations obtained by simulations and experiments are presented for swine 1, pattern 2
Figure 8 and Figure 9 shows the time variation of the temperature increase at 12 probe locations obtained with swine 2, pattern 3 and swine 3 pattern 1 respectively.
Figure 8.
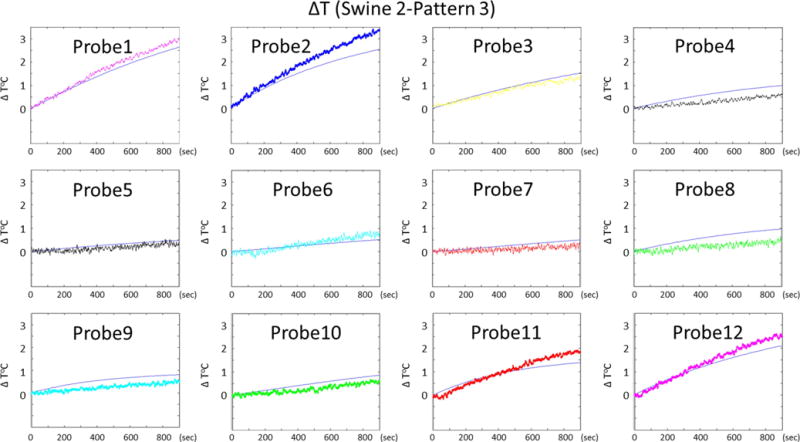
Temporal variations of temperature rise at 12 probe locations obtained by simulations and experiments are presented for swine 2, pattern 3
Figure 9.
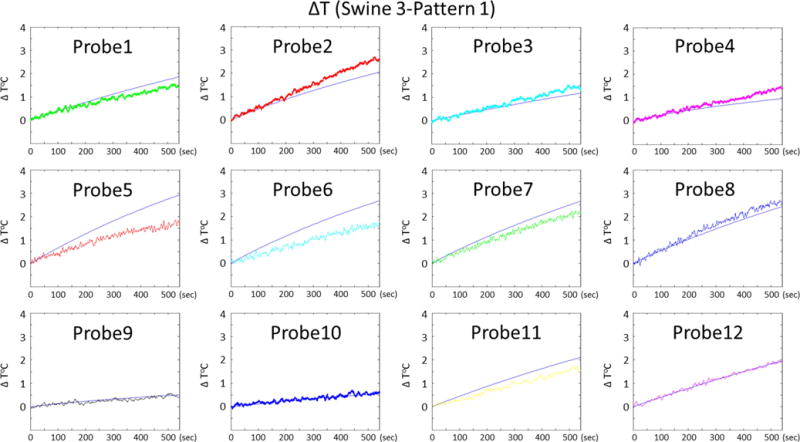
Temporal variations of temperature rise at 12 probe locations obtained by simulations and experiments are presented for swine 3, pattern 1
Temperature RMSE for all experiments can be seen in (Table 1). Supporting table S1 shows the temperature increase observed at the end of all RF heating experiments and thermal simulations (all animals) for all 12 probe locations. Overall RMSE (averaged over all swine and excitation patterns) was 0.37 °C. Finally, supporting table S2 shows the amplitudes and phases that were used for each RF heating experiment. Note that these voltages are measured at the coil-end when the cable is terminated by a 50 Ohm load. In addition to the voltage values, the table shows the total power levels (delivered to the load) for each excitation pattern.(Note that the reflection coefficient seen from feeding port of each element were also taken into account for power calculations)
Discussion and Conclusions
We performed RF heating experiments with anesthetized swine using dipole arrays at 10.5 T. We used various phase and amplitude patterns to generate different RF excitation patterns. Some of the patterns were chosen deliberately (Swine 1, pattern 2 & 3) to demonstrate the effects of constructive and destructive interference between electric fields. On the other hand other arbitrary patterns were also used to investigate the reliability of our simulations over a wide range of phase and amplitude variation. (See tables 1 &2)
In swine 1 with pattern 3, we observed a smaller temperature increase between the elements (probes that are located equidistant from two dipoles) in comparison to pattern 2. However the temperature increase close to the elements was larger with pattern 3. Based on investigation of the SAR maps, we conclude that the SAR level was enhanced because the E-fields due to pattern 3 constructively interfere directly under the elements.
In order to perform multiple experiments with a single animal within a 10–12 hour window, heating was done rapidly. To accomplish this, high average power levels (e.g ~8–9 W/channel) that are beyond the levels of safe/conventional scans were used. If applied in a clinical imaging scenario, these power levels could possibly generate local temperatures that exceed the safety limits (T<39 °C) (27) in various parts of the body. Tissues at some of the probe locations experienced unsafe temperature increases while others did not. For validation purposes we did not make a distinction between probe locations that were used for data comparison. We compared our simulations to experimental data for all probes experiencing safe or unsafe temperature increases.
In order to prevent burns on the animal skin, we limited the maximum temperature to 39 °C at all probe locations during RF excitation. We terminated the RF excitation if/when the temperature limit was exceeded. Since we could not control and observe the temperature at locations other than where the probes were, an empirical temperature limit (39 °C) was determined based on our experience with such RF heating studies. Limiting the maximum temperature allowed us to reduce the risk of RF burns that could occur at skin-dipole contact points. We carefully examined the neck and back region of the swine after each study and verified that the RF exposure did not cause any skin burns.
We experimented with dipole antennas because of their potential for UHF body imaging and their simple geometry that makes them easy to model with simulation software. If needed, this work can easily be extended to other transmitter elements such as loops and TEM elements in the future. We placed our dipoles on the swine’ upper back and the lower neck because dipoles have potential to image those regions as demonstrated in existing literature (6,18).
The swine were imaged with CT after euthanasia in order to generate anatomical models. MRI could also be utilized for this purpose however the tissue contrast in MRI is more complicated and could change after euthanasia and result in tissue segmentation errors. On the other hand, imaging the swine in-vivo in an MR scanner would be a difficult and time consuming task and was beyond the scope of this work. Physiological monitors and anesthesia machines would need to be used in the console room and placed in appropriate locations where fringe fields would not interfere with their operation. Therefore we decided to use a CT scanner to generate digital models of the ex-vivo swine. In studies which would involve patient specific SAR and temperature estimation, MR can also be used as previously demonstrated(28).
Sim4Life uses a temperature solver based on Penne’s bio-heat equation which assumes that the blood temperature remains constant. This assumption is shown to be valid (4) for scans up to 20 minutes under 3.6 W/kg of average SAR. In our studies average SAR was kept less than 0.6 W/kg with maximum exposure times of 15 minutes. Some animals experienced longer total exposure times in our studies. However no consecutive RF heating sessions were performed. Instead, they were distributed in time throughout an experiment day and were separated by >45 minutes. Furthermore, the maximum average SAR applied in our experiments was less than 20 % of what has been discussed in the previous study (4). Therefore we did not expect an increase in the core temperature of the animals. This condition was verified by monitoring the rectal temperature which remained relatively constant (∆T≤0.5 °C) over the whole RF experiments, suggesting that the blood temperature remained constant. Supporting figure S1 shows the rectal temperature readings (acquired ~ every 15 minutes) for three swine experiments.
In our thermal simulations each tissue was assigned a perfusion coefficient value independent of the temperature. However, human tissues respond to temperature increase by a local increase of the blood flow(thermoregulation). For example, Murbach et al. (4) simulated temperatures for 1.5T MRI investigations at SAR limits and found unrealistic temperature increase without local thermoregulation.
Also Simonis et al (29) found discrepancies between measurement and simulation that could only be attributed to local perfusion changes as a thermoregulatory response. While similar discrepancies were not observed in this study, understanding these thermoregulatory responses and incorporating them into the thermal modeling could further improve correspondence between prediction and measurement. That being said, modelling in the absence of a local thermoregulatory response will provide a more conservative assessment of temperature increase and therefore always results in a more conservative safety assessment.
Previous work showed that certain anesthetics (i.e. telazol, isoflurane) causes the swine’s core temperature to drop within the duration of RF experiment (3). In order to alleviate this effect, we covered up the head and the lower back region of the swine with blankets. These body parts did not receive any significant RF energy from the dipoles. Therefore, wrapping up with blankets did not disrupt the local temperature increase measured around the dipoles. However it prevented the core temperature to drop due to anesthetic effects. On the other hand, the parts of the animal that received RF energy from the dipoles (i.e. neck and upper back region) were left bare to ensure that the thermal boundary conditions were not disrupted. We used Neumann boundary conditions for modeling inner air-tissue interfaces and mixed boundary conditions for the interface between the skin and external air (4).
Previous thermal simulation work conducted at 9.4 T (3) focused on modeling and measuring absolute temperature in-vivo for a given excitation pattern(i.e. quadrature excitation). The absolute temperature is crucial to assess the safety of a patient. In this work we focused only on ∆T (temperature rise in tissue) obtained from a variety of RF excitation patterns at 10.5 T. Further studies may be performed to model absolute temperature resulting from excitation with different RF patterns.
In a previous work, a study was conducted to investigate the accuracy of thermal simulations in human subjects during an MR scan at 3 T(29). Heating experiments were performed in 13 healthy subjects by delivering RF energy to the subjects’ calves using a low-pass twisted birdcage coil. B1+ and temperature results obtained with the simulations and experiments were compared for validation. In this work EM and thermal validation was made at 10.5 T for dipole arrays. In addition, the feasibility of predicting temperature increase due to different RF excitation patterns was also investigated.
Supplementary Material
Supporting Fig S1 The rectal temperature readings (acquired ~ every 15 minutes) are shown for three swine experiments.
Supporting Table S1 The temperature increase observed at the end of all RF heating experiments at all 12 probe is presented.
Supporting Table S2 The amplitudes and phases used to excite each dipole are presented for different excitation patterns. Note that these voltages are measured at the coil-end when the cable is terminated by a 50 Ohm load. In addition to the voltage values, the total power (delivered to the load) is also shown for each excitation pattern.
Acknowledgments
Research reported in this publication was supported by the National Institute of Biomedical Imaging And Bioengineering of the National Institutes of Health under Award Number K99EB021173
Grant Support: P41 EB015894, S10 RR029672, K99EB021173
References
- 1.Metzger GJ, Snyder C, Akgun C, Vaughan T, Ugurbil K, Van de Moortele PF. Local B1+ shimming for prostate imaging with transceiver arrays at 7T based on subject-dependent transmit phase measurements. Magn Reson Med. 2008;59(2):396–409. doi: 10.1002/mrm.21476. [DOI] [PMC free article] [PubMed] [Google Scholar]
- 2.Vaughan T, DelaBarre L, Snyder C, Tian J, Akgun C, Shrivastava D, Liu W, Olson C, Adriany G, Strupp J, Andersen P, Gopinath A, van de Moortele PF, Garwood M, Ugurbil K. 9.4T human MRI: preliminary results. Magn Reson Med. 2006;56(6):1274–1282. doi: 10.1002/mrm.21073. [DOI] [PMC free article] [PubMed] [Google Scholar]
- 3.Shrivastava D, Hanson T, Schlentz R, Gallaghar W, Snyder C, Delabarre L, Prakash S, Iaizzo P, Vaughan JT. Radiofrequency heating at 9.4T: in vivo temperature measurement results in swine. Magn Reson Med. 2008;59(1):73–78. doi: 10.1002/mrm.21425. [DOI] [PMC free article] [PubMed] [Google Scholar]
- 4.Murbach M, Neufeld E, Capstick M, Kainz W, Brunner DO, Samaras T, Pruessmann KP, Kuster N. Thermal tissue damage model analyzed for different whole-body SAR and scan durations for standard MR body coils. Magn Reson Med. 2014;71(1):421–431. doi: 10.1002/mrm.24671. [DOI] [PubMed] [Google Scholar]
- 5.Guerin B, Gebhardt M, Cauley S, Adalsteinsson E, Wald LL. Local specific absorption rate (SAR), global SAR, transmitter power, and excitation accuracy trade-offs in low flip-angle parallel transmit pulse design. Magn Reson Med. 2014;71(4):1446–1457. doi: 10.1002/mrm.24800. [DOI] [PMC free article] [PubMed] [Google Scholar]
- 6.Eryaman Y, Guerin B, Keil B, Mareyam A, Herraiz JL, Kosior RK, Martin A, Torrado-Carvajal A, Malpica N, Hernandez-Tamames JA, Schiavi E, Adalsteinsson E, Wald LL. SAR reduction in 7T C-spine imaging using a “dark modes” transmit array strategy. Magn Reson Med. 2015;73(4):1533–1539. doi: 10.1002/mrm.25246. [DOI] [PMC free article] [PubMed] [Google Scholar]
- 7.van den Bergen B, van den Berg CA, Klomp DW, Lagendijk JJ. SAR and power implications of different RF shimming strategies in the pelvis for 7T MRI. J Magn Reson Imaging. 2009;30(1):194–202. doi: 10.1002/jmri.21806. [DOI] [PubMed] [Google Scholar]
- 8.Deniz CM, Brown R, Lattanzi R, Alon L, Sodickson DK, Zhu Y. Maximum efficiency radiofrequency shimming: Theory and initial application for hip imaging at 7 tesla. Magn Reson Med. 2013;69(5):1379–1388. doi: 10.1002/mrm.24377. [DOI] [PMC free article] [PubMed] [Google Scholar]
- 9.Boulant N, Wu X, Adriany G, Schmitter S, Ugurbil K, Van de Moortele PF. Direct control of the temperature rise in parallel transmission by means of temperature virtual observation points: Simulations at 10.5 Tesla. Magn Reson Med. 2016;75(1):249–256. doi: 10.1002/mrm.25637. [DOI] [PMC free article] [PubMed] [Google Scholar]
- 10.Setsompop K, Alagappan V, Gagoski B, Witzel T, Polimeni J, Potthast A, Hebrank F, Fontius U, Schmitt F, Wald LL, Adalsteinsson E. Slice-selective RF pulses for in vivo B1+ inhomogeneity mitigation at 7 tesla using parallel RF excitation with a 16-element coil. Magn Reson Med. 2008;60(6):1422–1432. doi: 10.1002/mrm.21739. [DOI] [PMC free article] [PubMed] [Google Scholar]
- 11.Zhu Y. Parallel excitation with an array of transmit coils. Magn Reson Med. 2004;51(4):775–784. doi: 10.1002/mrm.20011. [DOI] [PubMed] [Google Scholar]
- 12.Metzger GJ, Auerbach EJ, Akgun C, Simonson J, Bi X, Ugurbil K, van de Moortele PF. Dynamically applied B1+ shimming solutions for non-contrast enhanced renal angiography at 7.0 Tesla. Magn Reson Med. 2013;69(1):114–126. doi: 10.1002/mrm.24237. [DOI] [PMC free article] [PubMed] [Google Scholar]
- 13.Lakshmanan K, Cloos M, Wiggins GC. Google Patents, assignee. Circular dipole and surface coil loop structures and methods for using the same. 2014 [Google Scholar]
- 14.Thalhammer C, Renz W, Winter L, Hezel F, Rieger J, Pfeiffer H, Graessl A, Seifert F, Hoffmann W, von Knobelsdorff-Brenkenhoff F, Tkachenko V, Schulz-Menger J, Kellman P, Niendorf T. Two-dimensional sixteen channel transmit/receive coil array for cardiac MRI at 7.0 T: design, evaluation, and application. J Magn Reson Imaging. 2012;36(4):847–857. doi: 10.1002/jmri.23724. [DOI] [PMC free article] [PubMed] [Google Scholar]
- 15.Raaijmakers AJ, Italiaander M, Voogt IJ, Luijten PR, Hoogduin JM, Klomp DW, van den Berg CA. The fractionated dipole antenna: A new antenna for body imaging at 7 Tesla. Magn Reson Med. 2016;75(3):1366–1374. doi: 10.1002/mrm.25596. [DOI] [PubMed] [Google Scholar]
- 16.Raaijmakers AJ, Ipek O, Klomp DW, Possanzini C, Harvey PR, Lagendijk JJ, van den Berg CA. Design of a radiative surface coil array element at 7 T: the single-side adapted dipole antenna. Magn Reson Med. 2011;66(5):1488–1497. doi: 10.1002/mrm.22886. [DOI] [PubMed] [Google Scholar]
- 17.Erturk MA, Wu X, Eryaman Y, Van de Moortele PF, Auerbach EJ, Lagore RL, DelaBarre L, Vaughan JT, Ugurbil K, Adriany G, Metzger GJ. Toward imaging the body at 10.5 tesla. Magn Reson Med. 2016 doi: 10.1002/mrm.26487. [DOI] [PMC free article] [PubMed] [Google Scholar]
- 18.Duan Q, Nair G, Gudino N, de Zwart JA, van Gelderen P, Murphy-Boesch J, Reich DS, Duyn JH, Merkle H. A 7T spine array based on electric dipole transmitters. Magn Reson Med. 2015;74(4):1189–1197. doi: 10.1002/mrm.25817. [DOI] [PMC free article] [PubMed] [Google Scholar]
- 19.Erturk MA, Raaijmakers AJ, Adriany G, Ugurbil K, Metzger GJ. A 16-channel combined loop-dipole transceiver array for 7 Tesla body MRI. Magn Reson Med. 2016 doi: 10.1002/mrm.26153. [DOI] [PMC free article] [PubMed] [Google Scholar]
- 20.Yarnykh VL. Actual flip-angle imaging in the pulsed steady state: a method for rapid three-dimensional mapping of the transmitted radiofrequency field. Magn Reson Med. 2007;57(1):192–200. doi: 10.1002/mrm.21120. [DOI] [PubMed] [Google Scholar]
- 21.Cunningham CH, Pauly JM, Nayak KS. Saturated double-angle method for rapid B1+ mapping. Magn Reson Med. 2006;55(6):1326–1333. doi: 10.1002/mrm.20896. [DOI] [PubMed] [Google Scholar]
- 22.Voigt T, Homann H, Katscher U, Doessel O. Patient-individual local SAR determination: in vivo measurements and numerical validation. Magn Reson Med. 2012;68(4):1117–1126. doi: 10.1002/mrm.23322. [DOI] [PubMed] [Google Scholar]
- 23.Zhang X, Schmitter S, Van de Moortele PF, Liu J, He B. From complex B(1) mapping to local SAR estimation for human brain MR imaging using multi-channel transceiver coil at 7T. IEEE Trans Med Imaging. 2013;32(6):1058–1067. doi: 10.1109/TMI.2013.2251653. [DOI] [PMC free article] [PubMed] [Google Scholar]
- 24.Duck F. Physical properties of tissue. London: Academic Press; 1990. [Google Scholar]
- 25.Hasgall PADGF, Baumgartner C, Neufeld E, Gosselin MC, Payne D, Klingenböck A, Kuster N. IT’IS Database for thermal and electromagnetic parameters of biological tissues. 3.0. 2015. [Google Scholar]
- 26.Pennes HH. Analysis of tissue and arterial blood temperatures in the resting human forearm (Reprinted from Journal of Applied Physiology, vol 1, pg 93–122, 1948) J Appl Physiol. 1998;85(1):5–34. doi: 10.1152/jappl.1948.1.2.93. [DOI] [PubMed] [Google Scholar]
- 27.IEC. International Electrotechnical Commission. Medical equipment: particular requirements for the safety of Magnetic resonance equipment. 3rd. Geneva: 2010. International standard. [Google Scholar]
- 28.Homann H, Bornert P, Eggers H, Nehrke K, Dossel O, Graesslin I. Toward individualized SAR models and in vivo validation. Magn Reson Med. 2011;66(6):1767–1776. doi: 10.1002/mrm.22948. [DOI] [PubMed] [Google Scholar]
- 29.Simonis F, Raaijmakers A, Lagendijk J, van den Berg C. Validating subject-specific RF and thermal simulations in the calf muscle using MR-based temperature measurements. Magn Reson Med. 2016 doi: 10.1002/mrm.26244. [DOI] [PubMed] [Google Scholar]
Associated Data
This section collects any data citations, data availability statements, or supplementary materials included in this article.
Supplementary Materials
Supporting Fig S1 The rectal temperature readings (acquired ~ every 15 minutes) are shown for three swine experiments.
Supporting Table S1 The temperature increase observed at the end of all RF heating experiments at all 12 probe is presented.
Supporting Table S2 The amplitudes and phases used to excite each dipole are presented for different excitation patterns. Note that these voltages are measured at the coil-end when the cable is terminated by a 50 Ohm load. In addition to the voltage values, the total power (delivered to the load) is also shown for each excitation pattern.


