Abstract
Purpose
The purpose of this study was to detect and classify potentially destabilizing conditions encountered by manual wheelchair users with spinal cord injuries (SCI) to dynamically increase stability and prevent falls.
Methods
A volunteer with motor complete T11 paraplegia repeatedly propelled his manual wheelchair over level ground and simulated destabilizing conditions including sudden stops, bumps and rough terrain. Wireless inertial measurement units attached to the wheelchair frame and his sternum recorded associated accelerations and angular velocities. Algorithms based on mean, standard deviation and minimum Mahalanobis distance between conditions were constructed and applied to the data off-line to discriminate between events. Classification accuracy was computed to assess effects of sensor position and potential for automatically selecting a dynamic intervention to best stabilize the wheelchair user.
Results
The decision algorithm based on acceleration signals successfully differentiated destabilizing conditions and level over-ground propulsion with classification accuracies of 95.8, 58.3 and 91.7% for the chest, wheelchair and both sensors, respectively.
Conclusion
Mahalanobis distance classification based on trunk accelerations is a feasible method for detecting destabilizing events encountered by wheelchair users and may serve as an effective trigger for protective interventions. Incorporating data from wheelchair-mounted sensors decreases the false negative rate.
Keywords: Manual wheelchair propulsion, falls, seated posture, Mahalanobis distance, event detection, spinal cord injury, seated stability
Introduction
In USA, there are ~1.4–2.2 million wheelchair riders, about half of whom live outside of institutions [1–3]. According to the National Electronic Injury Surveillance System (NEISS) of the US Consumer Product Safety Commission (USCPSC), an estimated 100 000 wheelchair-related accidents occur each year that are serious enough to warrant attention in an emergency department [2,4]. Of these incidents, there are ~50 wheelchair-related deaths each year [3–5]. Spinal cord injury (SCI) is one of numerous neuromusculoskeletal conditions, diseases or dysfunctions that can result in dependence on a wheelchair for daily personal mobility. There are currently an estimated 276,000 persons living in USA with a SCI and ~12,500 new cases per year [6]. About 68% of people with a SCI use either a wheelchair or scooter with ~40% using a manual wheelchair [7].
Wheelchair-related falls occur for various reasons and result in a variety of injuries. The number one cause of wheelchair-related tips and falls is instability. Tips and falls result in either the user falling out of the wheelchair without the wheelchair tipping or the wheelchair itself tipping over, such that one or more wheels leave the ground. Between 65 and 77.4% of wheelchair-related injuries are due to tips and falls [1–5]. Environmental factors such as inclines, ramps and curb cuts are the most frequent causes of tips and falls. Additionally, walls and large obstacles can cause injuries via collisions [8]. More than twice as many accidents occur outdoors than indoors, where environmental and weather conditions can play a larger role [3]. Fractures, lacerations and contusions/abrasions are the most common wheelchair-related injuries, most of which tend to occur to the head and neck region followed by the trunk, wrist and hand [2,3,8]. Alternatives for stabilizing the torso and preventing falls is often limited to belts, straps or other custom seating adaptations [9]. Users of even the most sophisticated seating system optimized for their specific postural needs are still exposed to unexpected and potentially destabilizing events that could result in falls.
Depending on the level of injury, wheelchair-dependent persons with SCI are often unable to sit upright without external support due to paralysis of the trunk muscles required to actively support the spine and pelvis, even though passive structures like tendons and ligaments are still intact [10,11]. Static support is not widely used or accepted in this population because it interferes with remaining voluntary movement and restricts non-propulsion seated function such as reaching [11]. In a study of individuals with C5–C6 tetraplegia, the effects of personalized seating and positioning interventions on posture and performance showed mixed results, with some subjects showing no improvement in objective measures with custom seating systems [12]. While dynamic support that is responsive to user movement may be more effective, no seating system can guarantee postural stability in the presence of unexpected perturbations that can result in catastrophic falls [11].
This study was designed to explore dynamic options for improving postural stability and recovering from potentially destabilizing events that complement the optimal seating configuration while maintaining as much freedom of movement as possible in the wheelchair.
Various standardized wheelchair functional assessments of safety and stability rely on simulating real-world conditions in controlled laboratory environments. Instruments like the Wheelchair Skills Program (WSP) include various potentially destabilizing wheelchair tasks, such as negotiating a 2 cm (0.787 inch) threshold [13], traversing tracks in multiple orientations [14] or placing 0.375 and 0.625 inch dowels on a treadmill to simulate bumps [15]. Other studies have focused on predicting the risk of falls from wearable sensors [16]. Giasanti et al. reported detecting falls based on data from wearable inertial measurement units (IMUs) that sensed accelerations and angular velocities. The system was able to distinguish between three classes of fall risk based on the Mahalanobis distances between a set of inertial measurements and the statistical distributions of representative examples in multidimensional parameter space [16,17]. A similar approach for training a neural network to detect falls has been developed as well [17].
The purpose of this investigation was to determine whether a classification system could be constructed based on data from simple IMUs that could appropriately differentiate between environmental conditions that could lead to instability during manual wheelchair propulsion. When implemented in real time, such an event detector would be able to trigger the appropriate safety mechanism required to prevent tips and falls that could result in injury. As such, it represents the first stage of a new class of advanced seating systems that reacts to protect the manual wheelchair user from impending harm, much like the automatic triggering systems for automotive airbags.
Methods
Overview
One subject with a motor complete [ASIA Impairments Scale (AIS)-B] thoracic level SCI (T11), consented to participate in a series of experiments with multiple-repeated measures. He has been a manual wheelchair user since February 2009. The subject used his own professionally fit, TiLite ZR wheelchair with seat width 16 inch, seat depth 17 inch and with 14 inch seat back height. Institutional Review Board (IRB) approval was obtained from the Louis Stokes Cleveland Veteran Affairs Medical Center (LSCVAMC) for all experiments.
Data collection
Kinetic data were collected with a 16 camera VICON MS motion capture system (Oxford Metrics, Oxford, UK) configured oriented to cover a 10 × 2 × 2 m volume along the flat 30 m walkway of the Motion Study Laboratory at the LSCVAMC. Six spherical retro-reflective markers (10 mm in diameter) were taped on the wheelchair: two markers on the back cross bar, one at each wheel center and one above each caster. In addition, four markers were taped to the trunk of the subject: one at each shoulder, and one on the sternum, and C7 vertebra. Marker positions were sampled at 100 Hz. Inertial measurements were collected from two custom wireless IMUs, each containing a CMA3000-D01 accelerometer from Texas Instruments (Dallas, TX) and a ST Microelectronics LSM330DLC accelerometer and gyroscope. One IMU was placed on the sternum of the subject and the other on the wheelchair frame above the right caster. The chest sensor was oriented such that the x-axis was in the medial/lateral (M/L) direction, y-axis in the superior/inferior (S/I) direction and z-axis along the anterior/posterior (A/P) direction. The wheelchair sensor was oriented such that the x-axis was in the S/I direction, y-axis in the A/P direction and z-axis in the M/L direction (Figure 1). Inertial data sampled at 50 Hz and synced with the VICON data via a start and stop pulse from the wireless IMU receiver. The three-dimensional position coordinates were recorded for each marker, as well as the 3D components of acceleration and angular velocity from each wireless IMU.
Figure 1.
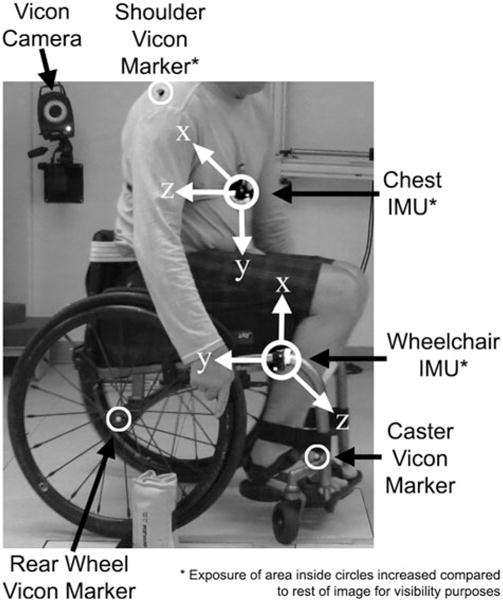
Experimental setup for assessing wireless sensor technology in classification of potentially disturbing wheelchair events. Superior/inferior (S/I) axes are y (inferior positive) for the chest IMU and x (superior positive) for the wheelchair IMU. Anterior/posterior (A/P) axes are z (posterior positive) for the chest IMU and y (posterior positive) for the wheelchair IMU. Medial/lateral (M/L) axes are x (medial positive) for the chest IMU and z (lateral positive) for the wheelchair IMU.
Four propulsion conditions were tested: baseline level over ground wheelchair propulsion, and three simulating potentially destabilizing conditions inspired by standardized clinical tests of wheelchair skill—rough terrain (rumble strips), isolated bumps (thresholds) and sudden stops.
The rough terrain and bump conditions were created by affixing solid semicircular dowels 1.9 cm (0.75 inch) in height to a thin, flat backing. For rough terrain (i.e., rumble strips), the dowels were closely spaced 3.8 cm (1.5 inch) apart over a 1.2 m (4 foot) long section such that the casters would not hit the backing board between them to simulate surfaces such as cobblestone or brick pavers (Figure 2(B)). Isolated bumps, such as contiguous sidewalk slabs of mismatched heights or a door threshold, were simulated with another surface on which two dowels were placed 36-in apart such that the entire wheelchair could return to level ground between strips (Figure 2(C)). The surfaces were positioned in the center of the VICON measurement volume and the subject was instructed to approach them at a comfortable speed, and maintain that speed for at least three strokes after completing the course.
Figure 2.
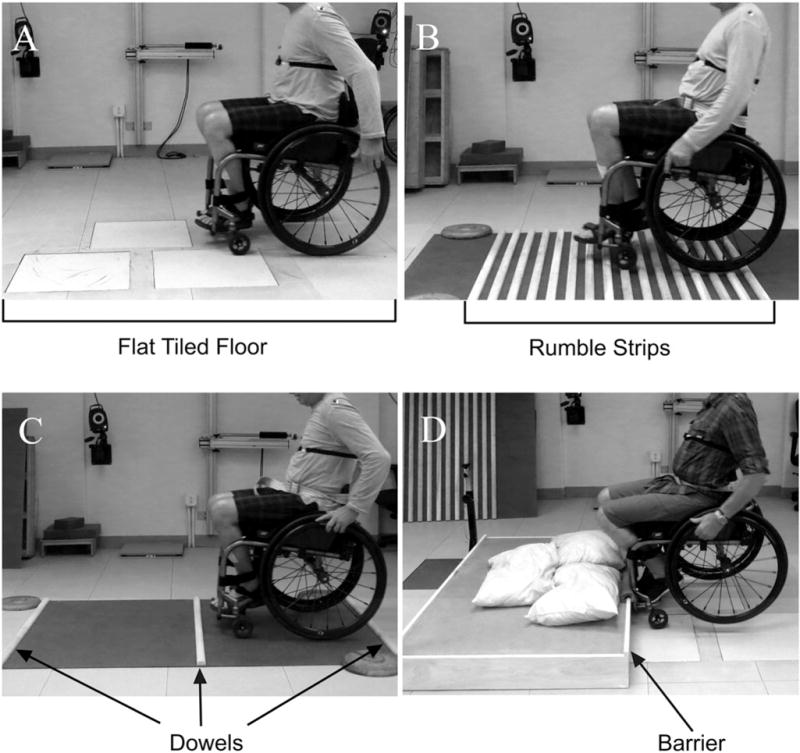
Conditions tested: (A) level ground, (B) rough terrain: 1.9 cm high dowls placed 3.8 cm apart over a 1.2 m area, (C) bumps: 1.9 cm dowels placed 91.4 cm apart and (D) collision/sudden stop: 15.24 cm high barrier.
In most real-life wheelchair collisions, the wheelchair strikes another object such as a wall, while in rarer instances the wheelchair is hit by another object [8]. Sudden stops/collisions were simulated in the laboratory with a 15.24 cm (6 in) high barrier placed toward one end of the VICON data capture volume (Figure 2(D)). The subject was instructed to approach the barrier at moderate speed without breaking or slowing down and collide into the solid, un-cushioned vertical barrier. For safety, the top of the barrier was padded to cushion impact and protect against injury, should the subject tip forward or fall from the wheelchair upon collision. In addition, the subject wore a protective bicycle helmet and loose fitting lap belt for all test conditions. Vision was not obstructed as another safety precaution for subject safety and to allow for quick restorative reactions in the case of an impending fall during data collection.
A total of six trials for each condition were collected. Motion data were pre-processed in VICON Nexus software (Oxford, UK) and exported to Matlab where they were synchronized with the wireless inertial sensor data. Kinematic data from the motion capture cameras were used as the gold standard to determine the exact time that each event occurred. Determinations of the initiation of each event were obtained from the marker position. A sudden stop/collision occurred when the right caster marker had come to a stop in the A/P direction. This was seen when the trajectory defining the A/P-position levels off and it was no longer increasing. Because the subject needed to voluntarily raise the front caster to enter the rough terrain condition, their onset was defined as when the right rear wheel position was on top of the dowels at its first maximum, i.e., when the rear wheel was on top of the first dowel in the set, indicating that the entire wheelchair was over the obstacle. This was defined by the first peak in the S/I coordinate of the rear wheels. A bump was defined as when the right rear wheel had come in contact with the dowel. All the signal components from the wireless IMUs, consisting of the x-, y-and z-accelerations and angular velocities from each sensor, were collected and included in the analysis.
Data processing
Each condition was represented as a cluster of data and the classifier was queried to make a decision in which cluster to place each new observation. The Mahalanobis distance (MD) of a data point at each sampling interval serves as a statistical measure of the distance between the new observation and each of the clusters representing the four classes of test conditions. Each data point was classified by assigning the unlabeled observation to the closest cluster, defined by the smallest MD.
The MD was determined to be an appropriate candidate for a classification tool due to its ability to take into account correlation among parameters and variance within a class in a multidimensional space [16,18]. In this case, each dimension correlated to one direction of acceleration from an IMU. Given different clusters of data, each of which has a Gaussian distribution with a different mean and covariance, and an observation P, the MD measures the distance between P and the centroid (mean) of each of the clusters and quantifies the distance along each of the principal axes of the cluster distribution in terms of the covariance (e.g., standard deviation along the principal directions). The underlying Gaussian distribution of the experimental data was verified using standard statistical methods (Q–Q plots).
The MD for a given observation, I, was defined as:
Where, μ is the mean of the reference cluster, σ is the standard deviation of the reference cluster, and Y is the test set defined as a matrix of size (number of observations [time points] × dimensions of data [signal components]).
To determine the optimal window for discriminating between the events, the MD of each point was compared to a reference cluster representing manual wheelchair propulsion over level ground. A threshold to discriminate level ground from all other events was set as the largest MD from the centroid of the data collected during steady state propulsion over level ground. The optimal window, from one point before to one point after the start of the event (three points total), was determined from the time samples with the most trials larger than the threshold of the reference cluster. The window ideally only captures the individual event and not another event such as level ground that could be happening before or after the potentially disturbing event. Once the optimal window was determined, a classification scheme was developed. The A/P, M/L and S/I components of unfiltered acceleration data were used as features for the classification. The chest and wheelchair accelerations were examined separately and together, resulting in three classification schemes: chest accelerations alone, wheelchair accelerations alone, or both wheelchair and chest accelerations simultaneously. In the first two cases, the single accelerometer used defined a three-dimensional feature space, while in the latter case, the combination of both sets of accelerations resulted in a six-dimensional feature space.
A decision-making flow chart of the classification scheme is shown in Figure 3. Each condition (level ground, rough terrain, bumps and sudden stops/collisions) was represented using the MD mean and standard deviation of its cluster of time points. A threshold for each condition was set as the mean plus two standard deviations. In order to classify the events, the first criterion examined was the number of time points within this threshold for each condition. The trial was labeled as the condition with the most time points inside of its threshold. If multiple conditions exhibited the same number of points within their thresholds, then the average MD across time points was used for further classification. The trial was labeled the condition with the minimum average MD.
Figure 3.
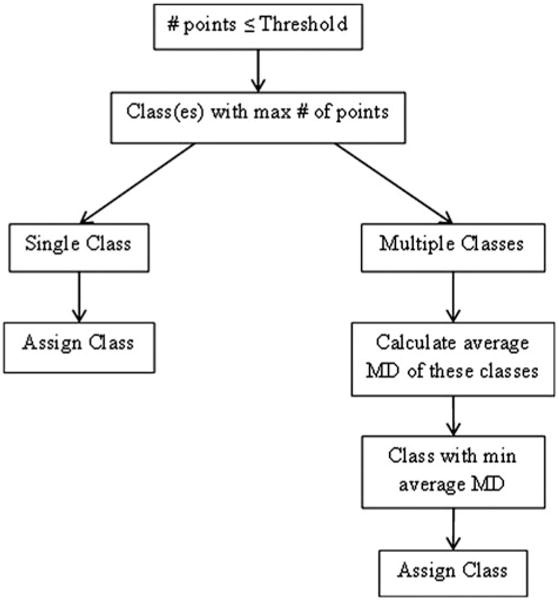
Decision-making flow chart to assign class to test set of data based on a threshold and minimum MD.
A jackknife resampling approach [19] was used for validation of the classifier due to the limited number of trials compared to the number of events being classified. The classifier was trained on all trials except one, which was used for testing. The first testing trial was then included in the training set and a different trial was used for testing until each trial had been tested.
Results
An example of the raw IMU data collected from the chest for a sudden stop/collision is shown in Figure 4. A window of inertial data beginning one point before onset of the event according to the VICON motion data to 19 points after the start of the event was exported from the raw inertial data to Matlab for further analysis. A smaller, three point window (one point before to one point after) was used for MD-based classification.
Figure 4.
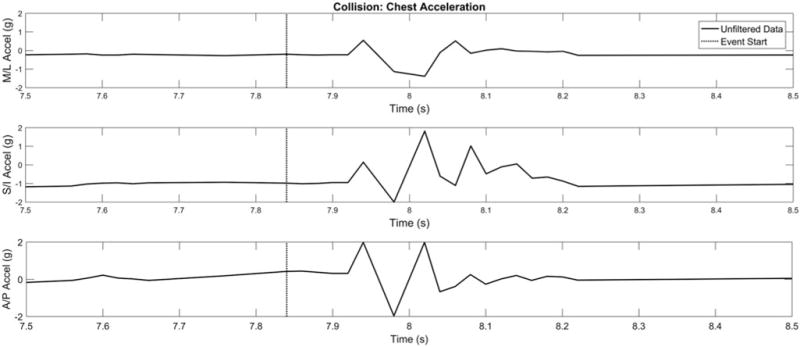
Sample raw data of a collision/sudden stop. The onset of the event as was determined by the motion capture kinematics (the front caster came to a stop) is indicated by a vertical line.
The confusion matrices from the three classification schemes: chest acceleration only, wheelchair acceleration only and chest and wheelchair accelerations are displayed in Figures 5–7. The rows correspond to the predicted conditions or the output of the classifier. Columns correspond to the actual or known condition for each event. The diagonal (from upper left to lower right) would ideally have all of the predicted classifications with the off diagonals being zeros, meaning there were no misclassifications. For example, in Figure 5, the one in the second column (bump) and fourth row (level ground), show that one trial that was a bump, was misclassified as level ground. In Figure 6, the zeros in Rows 2–4 (bump, rough terrain, level ground) of Column 1 (collision) show that all of the collision trials were properly classified as collisions. This is also shown by the entry in Row 1 (collision), Column 1 (collision) representing six correct classifications out of six trials. The percentages are of the number of trials in a given cell in the 4 × 4 sub-matrix, out of the total number of trials for all conditions. Since there was the same number of trials for each of the four classes, each entry in the column should be 25%. The first four columns of the last row, the top number is the percentage of trials properly classified for that column. The bottom number is the percentage of trials misclassified in the given row. Similarly, for the first four rows, the last column represents the percentage of properly classified and misclassified trials per row. The cell in the fifth row and fifth column shows the overall percentages of properly classified (green) and misclassified (red) trials.
Figure 5.
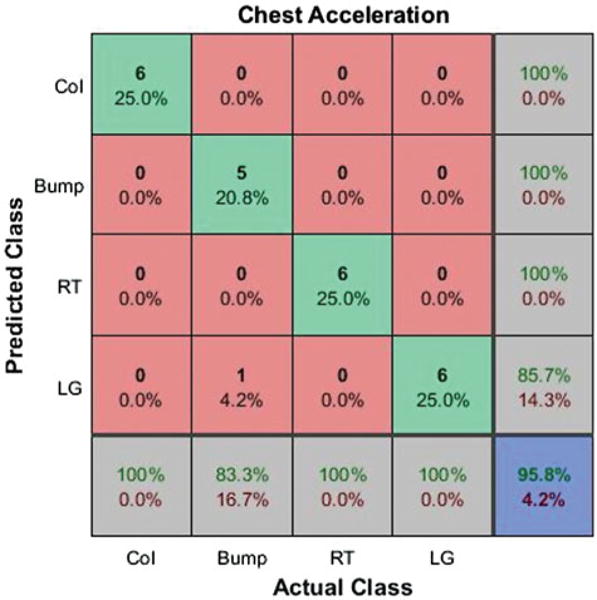
Confusion matrix from MD classifier using all chest acceleration components where Col is a collision/sudden stop, Bump is a bump, RT is rough terrain and LG is level ground.
Figure 7.
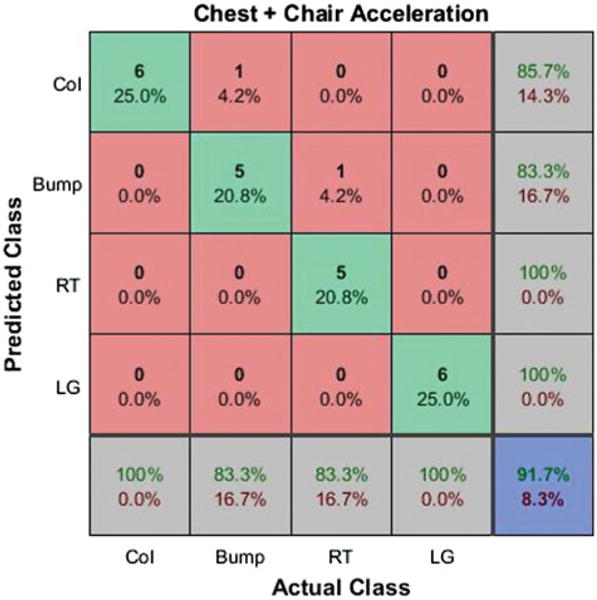
Confusion matrix from MD classifier using all chest and wheelchair acceleration components where Col is a collision/sudden stop, Bump is a bump, RT is rough terrain and LG is level ground.
Figure 6.
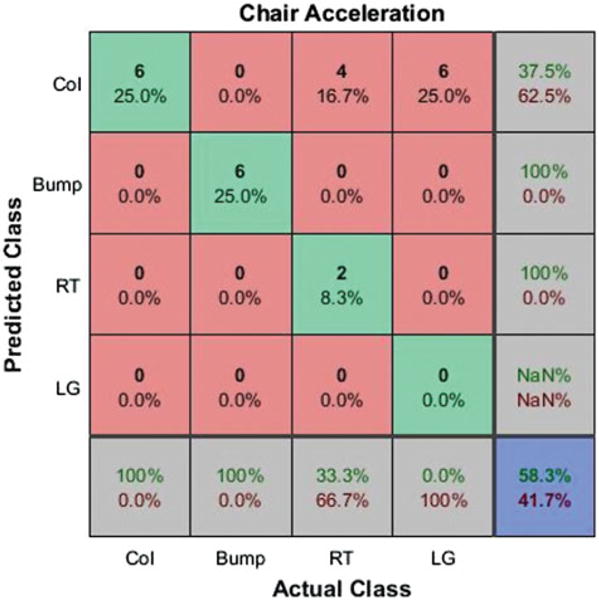
Confusion matrix from MD classifier using all wheelchair acceleration components where Col is a collision/sudden stop, Bump is a bump, RT is rough terrain and LG is level ground.
The overall accuracy of the classifier using chest accelerations, wheelchair accelerations, and both chest and wheelchair accelerations were: 95.8, 58.3 and 91.7%, respectively. The lone misclassification for the classifier using chest accelerations (Figure 5) occurred when a bump was misclassified as level ground, a false negative. Chest acceleration properly classified sudden stop/collisions, rough terrain and level ground 100% of the time. Using only wheelchair acceleration, four out of six rough terrain and six out of six level ground trials were misclassified as sudden stops/collisions. The six level ground trials misclassified as sudden stops/collision are considered false positives. Wheelchair acceleration classified collisions/sudden stops and bump correctly 100% of the time. Using both chest and wheelchair accelerations one bump was misclassified as a sudden stop/collision and one rough terrain trial was misclassified as a bump. A combination of chest and wheelchair accelerations classified sudden stops/collisions and level ground correctly 100% of the time. Sudden stops/collisions were properly classified as collisions 100% of the time across classification schemes and sensor locations.
Discussion
Important considerations in choosing the most appropriate classifier are the false positive and false negative rates. For the purpose of the classifier discussed, not all misclassifications will have an equal impact on the outcome. For example, misclassification of one potentially disruptive event that was similar to another potentially disruptive event would have less of an impact than events that were more dissimilar. A bump and rough terrain are similar in nature and therefore would potentially require similar intervention to correct for their perturbation effects, causing a misclassification of a bump as rough terrain or vice versa to be less of a concern than a collision being misclassified as level ground or vice versa. The rough terrain trial misclassified as a bump when using both chest and wheelchair accelerations seen in the results, is less of a concern than a bump being misclassified as level ground when using chest acceleration only. When using both chest and wheelchair acceleration there was an additional misclassification of a bump as a collision. When using the chest and wheelchair acceleration there was a lower overall accuracy by 4.1% than when using chest acceleration alone. It is not clear whether this difference is significant since the levels of impact of the misclassifications are not equal. Therefore, it is unclear which set of accelerations is best, but it is important to include the chest accelerations in all classification schemes. A better determination of the best set of features could be determined if more trials for each event were available.
Using the MD to form a classifier, potentially destabilizing events and level ground were properly classified with >90% accuracy in two out of three acceleration schemes. Giasanti [17] got an accuracy of 93.5–94.5%, similar to the findings of this study (91.7–95.8%). The classifiers with >90% accuracy had some misclassifications of bumps and rough terrain. Of the misclassifications observed with classifiers where chest acceleration was included, the most problematic case was when the one of the potentially disturbing conditions was misclassified as level ground since no appropriate action would be taken. Other misclassifications that would be problematic would be confusing level ground for an event such as a sudden stop/collision. Based on the results presented, the chest acceleration is necessary to get the best classification scheme. The wheelchair acceleration alone misclassified level ground and rough terrain as a sudden stop/collision for most trials. Level ground being misclassified as a sudden stop/collision is problematic and could potentially be due to the sensitivity of the IMUs, or the location of the wheelchair sensor directly above the castor, which was subject to spurious vibrational input that may not be indicative of a true destabilizing event. The signals could potentially be damped on the trunk IMU causing them to be smoother and thus easier to classify with certainty.
Based on the offline analysis, an event could potentially be classified within 5 ms. This indicated that the MD distance calculation and classification could be performed fast enough for real-time operation [17].
One of the limitations of this study is the limited number of trials per condition and reliance on a single subject. Future testing with more repetitions of each condition is necessary prior to real-time implementation to allow for improved training sets and validation. Future work should also include additional subjects, as well as additional events such as sharp turns, ramps or asymmetric elevation of a single wheel simulating a condition that might lead to tipping. Furthermore, in order to improve detection accuracy and algorithm efficiency, it will be necessary to select a set of optimal signal components and features for the classifier. Potential techniques to determine these components and implement them into a classifier include principal component analysis (PCA), Gaussian mixture model (GMM), local Fisher’s discriminant analysis (LFDA) or a neural network. The collection of additional trials for the subject presented as well as gathering data with additional subjects is ongoing with the addition of a sharp turn condition. Additionally, further analysis is being done to ensure that any dropped data points by the sensor do not cause a problem in the classification process. Plans are underway to further refine the MD classification scheme by minimizing an error function to optimize threshold parameters [18]. Refinements to the MD classifier were limited because of the small number of trials obtained for each condition in this study. Once a classification scheme is set, it will need to be reformulated for real-time operation and tested under real-world conditions outside of the laboratory. Finally, subject specific interventions would need to be determined to react to disturbances and regain user stability in their wheelchair.
One potential application of this destabilizing event detection algorithm is to act as a trigger for a motor system neuroprostheses (NP) activating gluteus maximus, lumbar erector spinae and quadratus lumborum to stabilize the otherwise paralyzed spine and pelvis in individuals with SCI. Active sitting and stimulated control of trunk and pelvic motion for wheelchair dependent individuals with SCI is an evolving and promising field with great potential to provide dynamic seating and positioning through the actions of the user’s own muscles. Neural stimulation can improve skeletal alignment, alter trunk position, enable bimanual reach and expand seated work volume, and restore erect upright sitting from a fully forward flexed position [20]. Electrically activating the paralyzed core hip and trunk muscles can stabilize seated posture and improve manual wheelchair efficiency [21] and prevent forward falls in response to applied disturbances [22,23]. Results of this study indicate that potentially destabilizing events can be detected from a relatively small number of sensors with relatively simple classification algorithms. Such classification techniques may serve as valuable command inputs to a neural stimulation system that can correct for destabilizing perturbations by delivering the appropriate stimulation to the paralyzed muscles to avoid potentially injurious falls from the wheelchair.
Conclusion
The results of the current study have shown that a MD-based classifier is successful in differentiating potentially destabilizing events for wheelchair users. By inputting acceleration data from the wheelchair and user into the MD-based classifier, potentially disturbing events can be identified with >90% accuracy. Sudden stops/collisions were properly classified across classification schemes tested as well were level ground for classification schemes with >90% accuracy with these two conditions being the least and greatest potential for causing instability. Although classification with chest acceleration lent itself to the highest overall accuracy, it may not be the optimal classification scheme. The levels of impact for the different misclassifications must be considered and more data is needed to make this determination. This classification scheme also lends itself to real-time operation making it a feasible determination in triggering a NP device or other intervention to prevent injury to users.
➤ IMPLICATIONS FOR REHABILITATION.
SCI has a significant impact on quality of life, compromising the ability to participate in social or leisure activities, and complete other activities of daily living for an independent lifestyle.
Using inertial measurement units to build an event classifier for control the actions of a neuroprosthetic device for maintaining seated posture in wheelchair users.
Varying muscle activation increases user stability reducing the risk of injury.
Acknowledgments
The authors would like to thank Lisa Lombardo, PT, for her expertise and assistance in preparing and conducting the experiments and Max Freeberg for his assistance in data processing.
Funding
This work was supported by Merit Review (I01 RX001204) (R.T., Principal Investigator) from the Rehabilitation R&D Service of the U.S. Department of Veterans Affairs and utilized the facilities and resources of the Louis Stokes Cleveland VA Medical Center.
Footnotes
Disclosure statement
The contents do not represent the views of the US Department of Veterans Affairs or the United States Government. Human studies approval by LSCVAMC IRB protocol number 07101-H36, “A Neuroprosthesis for Seated Posture and Balance”. The authors report no conflicts of interest.
References
- 1.Gaal R, Rebholtz N, Hotchkiss RD. Wheelchair rider injuries: causes and consequences for wheelchair design and selection. J Rehabil Res Dev. 1997;34:58–71. [PubMed] [Google Scholar]
- 2.Xiang H, Chany A-M, Smith GA. Wheelchair related injuries treated in US emergency departments. Inj Prev. 2006;12:8–11. doi: 10.1136/ip.2005.010033. [DOI] [PMC free article] [PubMed] [Google Scholar]
- 3.Gavin-Dreshnack D, Nelson A, Harrow J. Wheelchair-related falls: current evidence and directions for improved quality care. J Nurs Care Qual. 2005;20:199–127. doi: 10.1097/00001786-200504000-00006. [DOI] [PubMed] [Google Scholar]
- 4.Corfman TA, Cooper RA, Fitzgerald SG. Tips and falls during electric-powered wheelchair driving: effects of seatbelt use, legrests, and driving speed. Am Acad Phys Med Rehabil. 2003;84:1797–1802. doi: 10.1016/s0003-9993(03)00467-2. [DOI] [PubMed] [Google Scholar]
- 5.Kirby RL, Lugar JA. Spotter strap for the prevention of wheelchair tipping. Arch Phys Med Rehabil. 1999;80:1354–1356. doi: 10.1016/s0003-9993(99)90044-8. [DOI] [PubMed] [Google Scholar]
- 6.The National SCI Statistical Center (NSCISC) SCI data sheet: Spinal cord injury (SCI) facts and figures at a glance. Birmingham (AL): Spinal Cord Injury Model Systems (SCIMS), the National SCI Statistical Center; 2014. [Google Scholar]
- 7.The National SCI Statistical Center (NSCISC) Complete public version of the 2013 annual statistical report for the spinal cord injury model system. Spinal Cord Injury Model Systems, NSCISC National Spinal Cord Injury Statistical Center; 2013. [Google Scholar]
- 8.Kirby RL, Ackroyd-Stolarz SA. Wheelchair safety-adverse reports to the United States Food and Drug Administration. Am J Phys Med Rehabil. 1995;74:308–312. doi: 10.1097/00002060-199507000-00009. [DOI] [PubMed] [Google Scholar]
- 9.Triolo RJ, Nogan-Bailey S, Miller ME. Effects of stimulating hip and trunk muscles on seated stability, posture, and reach after spinal cord injury. Arch Phys Med Rehabil. 2013;94:1766–1775. doi: 10.1016/j.apmr.2013.02.023. [DOI] [PMC free article] [PubMed] [Google Scholar]
- 10.Minkel JL. Seating and mobility considerations for people with spinal cord injury. Phys Ther. 2000;80:701–709. [PubMed] [Google Scholar]
- 11.Kamper D, Barin K, Parnianpour M, et al. Preliminary investigation of the lateral postural stability of spinal cord-injured individuals subjected to dynamic perturbations. Spinal Cord. 1991;37:40–46. doi: 10.1038/sj.sc.3100747. [DOI] [PubMed] [Google Scholar]
- 12.Bolin I, Bodin P, Kreuter M. Sitting position - posture and performance in C5–C6 tetraplegia. Spinal Cord. 2000;38:425–434. doi: 10.1038/sj.sc.3101031. [DOI] [PubMed] [Google Scholar]
- 13.Kirby RL. Wheelchair skills program (WSP) version 4.1. Wheelchair skills test (WST) manual. 2007 Available from: http://www.wheelchairskillsprogram.ca/eng/4.1/WST_Manual_Version4.1.51.pdf (last accessed 16 Mar 2017)
- 14.Kilkens O, Dallmeijer A, Seelen HAM. Wheelchair skills tests: a systematic review. Clin Rehabil. 2003;17:418–430. doi: 10.1191/0269215503cr633oa. [DOI] [PubMed] [Google Scholar]
- 15.Baldwin DJ, Thacker JG. Characterization of the dynamic stress response of manual and powered wheelchair frames. J Rehabil Res Dev. 1993;30:224–232. [PubMed] [Google Scholar]
- 16.Giasanti D. Investigation of fall-risk using a wearable device with accelerometers and rate gyroscopes. Physiol Meas. 2006;27:1082–1090. doi: 10.1088/0967-3334/27/11/003. [DOI] [PubMed] [Google Scholar]
- 17.Giasanti D, Macellari V, Maccioni G. New neural network classifier of fall-risk based on the Mahalanobis distance and kinematic parameters assessed by a wearable device. Physiol Meas. 2008;29:N11–N19. doi: 10.1088/0967-3334/29/3/N01. [DOI] [PubMed] [Google Scholar]
- 18.Kumar S, Chow TWS, Pecht M. Approach to fault identification for electronic products using Mahalanobis distance. IEEE Trans Instrum Meas. 2010;59:2055–2064. [Google Scholar]
- 19.Miller RG. The jackknife – a review. Oxf Univ Press Biom. 1974;61:1–15. [Google Scholar]
- 20.Triolo RJ, Boggs L, Miller ME, et al. Implanted electrical stimulation of the trunk for seated postural stability and function after cervical SCI: a single case study. Arch Phys Med Rehabil. 2009;90:340–347. doi: 10.1016/j.apmr.2008.07.029. [DOI] [PMC free article] [PubMed] [Google Scholar]
- 21.Triolo RJ, Nogan-Bailey S, Lombardo LM. Effects of intramuscular trunk stimulation on manual wheelchair propulsion mechanics in 6 subjects with spinal cord injury. Arch Phys Med Rehabil. 2013;94:1997–2005. doi: 10.1016/j.apmr.2013.04.010. [DOI] [PMC free article] [PubMed] [Google Scholar]
- 22.Murphy JO, Audu ML, Lombardo LM. Feasibility of closed-loop controller for righting seated posture after spinal cord injury. J Rehabil Res Dev. 2014;51:747–760. doi: 10.1682/JRRD.2013.09.0200. [DOI] [PubMed] [Google Scholar]
- 23.Audu ML, Lisa ML, Schnellenberger JR, et al. A neuroprosthesis for control of seated balance after spinal cord injury. J NeuroEngineering Rehabil. 2015;12:8. doi: 10.1186/1743-0003-12-8. [DOI] [PMC free article] [PubMed] [Google Scholar]


