

Abstract
Most hepatocellular carcinomas (HCC) develop as a result of chronic liver inflammation. We have shown that the oncoprotein gankyrin is critical for inflammation‐induced tumorigenesis in the colon. Although the in vitro function of gankyrin is well known, its role in vivo remains to be elucidated. We investigated the effect of gankyrin in the tumor microenvironment of mice with liver parenchymal cell‐specific gankyrin ablation (Alb‐Cre;gankyrin f/f) and gankyrin deletion both in liver parenchymal and non‐parenchymal cells (Mx1‐Cre;gankyrin f/f). Gankyrin upregulates vascular endothelial growth factor expression in tumor cells. Gankyrin binds to Src homology 2 domain‐containing protein tyrosine phosphatase‐1 (SHP‐1), mainly expressed in liver non‐parenchymal cells, resulting in phosphorylation and activation of signal transducer and activator of transcription 3 (STAT3). Gankyrin deficiency in non‐parenchymal cells, but not in parenchymal cells, reduced STAT3 activity, interleukin (IL)‐6 production, and cancer stem cell marker (Bmi1 and epithelial cell adhesion molecule [EpCAM]) expression, leading to attenuated tumorigenic potential. Chronic inflammation enhances gankyrin expression in the human liver. Gankyrin expression in the tumor microenvironment is negatively correlated with progression‐free survival in patients undergoing sorafenib treatment for HCC. Thus, gankyrin appears to play a critical oncogenic function in tumor microenvironment and may be a potential target for developing therapeutic and preventive strategies against HCC.
Keywords: Bmi1, ERK, hepatocellular carcinoma, interleukin‐6, vascular endothelial growth factor
Hepatocellular carcinoma (HCC), the most common form of liver cancer, is the third leading cause of cancer deaths worldwide and is usually associated with a very poor prognosis.1 Given the increase in non‐alcoholic steatohepatitis and imminent disappearance of chronic viral hepatitis, hepatosteatosis is a major risk factor for HCC.2 Although a causal relationship between chronic damage, inflammation and carcinogenesis has been widely recognized, the exact molecular mechanism of hepatocarcinogenesis remains to be elucidated.
Hepatic progenitor cells are bipotential cells residing in normal liver and are thought to be implicated in hepatocarcinogenesis.3 A stem cell marker Bmi1 is involved in the regulation of cell proliferation, stem cell maintenance, tumorigenesis and tumor progression.4, 5 Bmi1 is overexpressed and acts as an oncogene in several human malignancies, including HCC.6, 7 The expression of another “stemness”‐related marker epithelial cell adhesion molecule (EpCAM) in HCC is associated with an aggressive biological behavior and poor clinical outcome.8 In chronic inflammation, inflammatory signaling is important for the dedifferentiation and expansion of tumor‐initiating cells.9, 10, 11, 12, 13, 14
Gankyrin (also named p28GANK or PSMD10) is commonly overexpressed in human cancers.15, 16 In our previous study, we used a conditional gankyrin “floxed” (gankyrin f/f) strain to generate Villin‐Cre;gankyrin f/f and Mx1‐Cre;gankyrin f/f mice lacking gankyrin in intestinal epithelial cells and inflammatory cells to assess the role of gankyrin in the development of colorectal cancer.12 We found that gankyrin promoted the development of inflammation‐induced colorectal cancer. We now describe that gankyrin enhances signal transducer and activator of transcription 3 (STAT3) activation, interleukin (IL)‐6 production and subsequent hepatocarcinogenesis in mice exposed to the carcinogen diethylnitrosamine (DEN). Gankyrin upregulates the expression of stem cell markers in tumors. In addition, gankyrin expression in human non‐parenchymal cells is inversely correlated with progression free survival (PFS) in HCC patients treated with sorafenib, suggesting that gankyrin expression may be considered as a new biomarker to predict the likelihood of response to sorafenib.
Methods
Animals, tumor induction and analysis
Gankyrin f/f mice were crossed with Alb‐Cre and Mx1‐Cre mice (Jackson Laboratory, Bar Harbor, Maine, USA) to generate Alb‐Cre;gankyrin f/f and Mx1‐Cre;gankyrin f/f mice, respectively.12 Induction of Mx1‐Cre was achieved with three intraperitoneal injections of 300 μg poly(I:C) (Sigma‐Aldrich, St. Louis, MO, USA) every other day to 4–8‐week‐old mice. All mice were maintained in the C57BL/6 background in filter‐topped cages at Kindai University. Male mice (2‐week old) were injected intraperitoneally with 25 mg/kg DEN (Sigma). After 8 months on normal chow, mice were killed and analyzed for the presence of HCC. To examine the effect of gankyrin in non‐parenchymal cells, we performed bone marrow transplantation (BMT) experiments. Because only 30% of Kupffer cells are reconstituted by donor‐derived bone marrow cells 6 months after BMT,17 we gave mice an intravenous injection of liposomal clodronate (200 uL intravenously) before irradiation to deplete Kupffer cells and accelerate macrophage turnover.18 We then flushed the tibias and femurs of donor mice to obtain bone marrow. We injected 1 × 10⁷ bone marrow cells into the tail veins of lethally irradiated (11 Gy) recipient mice. Six weeks after BMT, mice were injected intraperitoneally with DEN (100 mg/kg). Four hours after DEN injection, mice were killed and their livers were removed.
All animal procedures were performed according to protocols approved by the Medical Ethics Committee of Kindai University Faculty of Medicine and Institutional Animal Care and in accordance with the recommendations for proper care and use of laboratory animals.
Biochemical, immunochemical analyses and cell culture
Real‐time quantitative PCR (qPCR), immunoblotting and immunohistochemistry were performed as previously described.12, 19, 20 The following antibodies were purchased: anti‐actin and anti‐PSMD10 (gankyrin) from Sigma (St. Louis, MO, USA); anti‐Ki67, anti‐STAT3, anti‐phospho‐STAT3, anti‐extracellular signal‐regulated kinases (ERK), anti‐phospho‐ERK, anti‐p38 and anti‐phospho‐p38 from Cell Signaling (Danvers, MA, USA); and anti‐Src homology 2 domain‐containing protein tyrosine phosphatase‐1 (SHP‐1) from R&D Systems (Minneapolis, MN, USA). Anti‐gankyrin antibody was described previously.16 Immunohistochemistry was performed using ImmPRESS reagents (Vector Laboratory, Burlingame, CA, USA) according to the manufacturer's recommendations. Immunofluorescent TUNEL staining was performed to measure apoptosis in paraffin‐embedded sections using the In Situ Apoptosis Detection Kit, as described by the manufacturer (Takara, Tokyo, Japan) and previous reports.12, 21 Nuclei were stained with 4′,6‐diamidino‐2‐phenylindole. Duolink fluorescence method was employed to study the interaction between gankyrin and SHP‐1, as per the manufacturer's recommendations (Sigma Aldrich). The interaction of gankyrin with SHP‐1 was assessed under a confocal laser microscope using antibodies against human gankyrin and SHP‐1.
THP‐1 cells and Mono Mac 6 cells, an immortalized line of human monocyte, were maintained in RPMI‐1640 medium (Gibco, Carlsbad, CA, USA) supplemented with 10% FBS, containing penicillin (100 U/mL) and streptomycin (100 mg/mL) and transfection of gankyrin siRNA (Santa Cruz, Dallas, TX, USA) was carried out using X‐treme GENE siRNA Transfection Reagent (Roche, Basel, Switzerland).
Immunohistochemical analyses of gankyrin expression
To evaluate gankyrin expression in the tumor microenvironment, we assessed the expression in tumor‐infiltrating cells and non‐tumor cells at the invasive front of the HCC samples by immunohistochemistry. The evaluation of gankyrin was performed at high magnification (×100) on the tumor material obtained before receiving sorafenib treatment. The staining status was obtained by calculating the intensity × extensity score (gankyrin expression score) as described previously.22 Intensity of the staining was scored as 0 (negative), 1 (weak) or 2 (strong). Extensity of the staining was scored as 0 (1%–5% of non‐tumor cells), 1 (6%–30%), 2 (3%–70%) or 3 (71%–100%). To calculate the intensity × extensity score (gankyrin expression score) of non‐tumor cells of the HCC samples, five fields were selected at the invasive front as well as within tumors and the average of five fields (magnification 100 × ) was used to determine the score. Scoring was performed in a blinded fashion by two investigators (T. S. and N. Y.). Samples were considered high expression for gankyrin if the intensity × extensity score (gankyrin expression score) was more than a median value. The gankyrin expression score was evaluated in tumor cells as well.
Patients and specimens
From May 2009 to June 2010, 38 patients with refractory HCC uncontrolled with standard therapeutic modalities received sorafenib (Nexavar; Bayer HealthCare Pharmaceuticals‐Onyx Pharmaceuticals, Leverkusen, Germany) at Kindai University. All pathological specimens of HCC were collected using needle biopsy before sorafenib treatment. Demographic profiles of patients were previously described.21 In addition, liver specimens were collected with needle biopsy in 13 patients who were clinically suspected of non‐alcoholic steatohepatitis. The study protocol conformed to the ethical guidelines of the 1975 Declaration of Helsinki and was approved by the institutional review boards. Written informed consent was obtained from all patients for subsequent use of their resected tissues.
The eligibility criteria for sorafenib therapy were previously described.16 Sorafenib was administered orally at a daily dose of 800 mg divided into two equal doses. Treatment interruptions and up to two dose reductions (first to 400 mg once daily, followed by 400 mg every 2 days) were permitted for drug‐related adverse effects (National Cancer Institute‐Common Terminology Criteria [NCI‐CTC, version 3]). Treatment was continued until the occurrence of radiologic progression, as defined by the Response Evaluation Criteria in Solid Tumors (RECIST, Version1.1).
Statistical analysis
Data are presented as means ± SEM. Statistical differences between groups were analyzed using the Fisher's exact test or Student's t‐test. A value of P < 0.05 was considered statistically significant.
Results
Gankyrin deficiency attenuated hepatocarcinogenesis
We previously generated Mx1‐Cre;gankyrin f/f mice by crossing gankyrin f/f mice with Mx1‐Cre mice. Mx1‐Cre;gankyrin f/f mice exhibited gankyrin deletion both in parenchymal cells and non‐parenchymal cells of the liver (Fig. 1a and Fig. S1).12 Histomorphology and serum levels of ALT revealed no apparent liver dysfunction in Mx1‐Cre;gankyrin f/f mice. The strain failed to exhibit spontaneous liver tumors up to 1 year of age. However, DEN injection on postnatal day 1423 induced well‐differentiated HCC in all gankyrin f/f and Mx1‐Cre;gankyrin f/f mice (Fig. S2a). Mx1‐Cre;gankyrin f/f mice showed gankyrin deletion both in tumor cells and non‐parenchymal cells (Fig. 1a). In comparison to gankyrin f/f controls, Mx1‐Cre;gankyrin f/f mice exhibited reduced HCC multiplicity and size (Fig. 1b–d). HCC isolated from Mx1‐Cre;gankyrin f/f mice exhibited reduced expression of IL‐6 and vascular endothelial growth factor (VEGF) (Fig. 1e).
Figure 1.
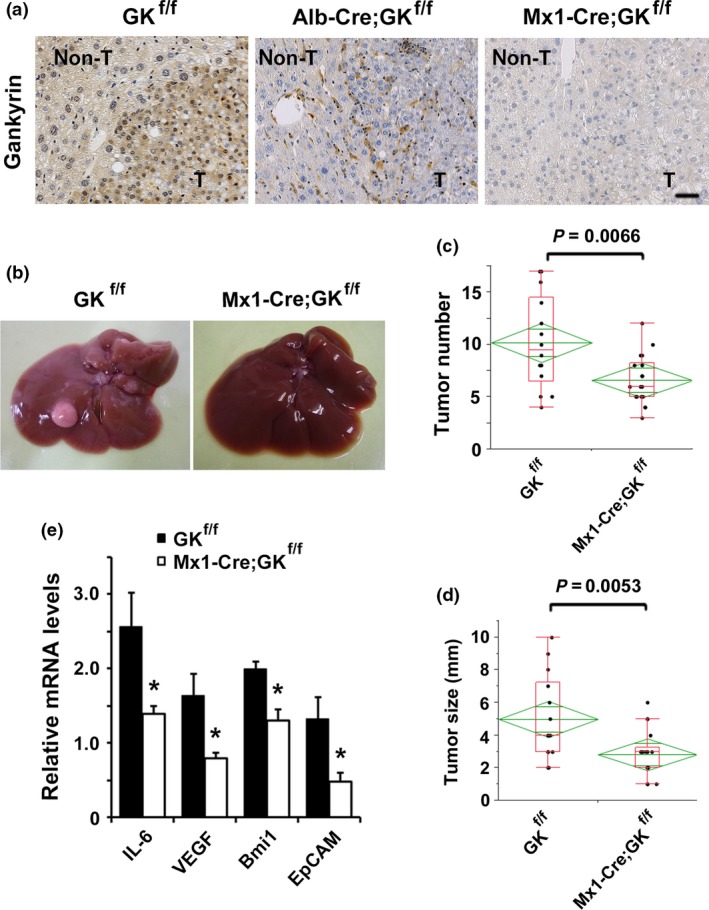
Attenuated hepatocarcinogenesis in Mx1‐Cre;gankyrin f/f mice. (a) Control (GK f/f), Alb‐Cre;gankyrin f/f (Alb‐Cre;GK f/f) and Mx1‐Cre;gankyrin f/f (Mx1‐Cre;GK f/f) mice were challenged with diethylnitrosamine (DEN) and killed after 8 months. Liver sections were examined with immunohistochemistry using gankyrin‐specific antibody. Distinction between tumor and non‐tumorous liver tissue was made by H&E staining. Non‐T, non‐tumorous liver tissues; T, tumors. Scale bar, 50 μm. (b) Typical examples of macroscopic tumorigenesis in the hepatocellular carcinomas (HCC) model. Livers of control (GK f/f) and Mx1‐Cre;gankyrin f/f (Mx1‐Cre;GK f/f) mice 8 months after DEN injection are shown. (c) Tumor number and (d) maximal tumor sizes (diameters) in control (GK f/f, n = 14) and Mx1‐Cre;gankyrin f/f (Mx1‐Cre;GK f/f, n = 18) mice. (e) RNA was extracted from tumors of Mx1‐Cre;gankyrin f/f (Mx1‐Cre;GK f/f) and gankyrin f/f (GK f/f) mice. Relative amounts of mRNA were determined by real‐time quantitative PCR (qPCR) and normalized to the amount of actin mRNA. The amount of each mRNA in the untreated liver was given an arbitrary value of 1.0. Data are means ± SEM (n = 5).
Kupffer cell is a major source of IL‐6 production in the liver.24 Therefore, we purified Kupffer cells from Mxl‐Cre;GK f/f mice and examined whether gankyrin in Kupffer cells affect IL‐6 production. We found that gankyrin deletion reduced IL‐6 expression in Kupffer cells (Fig. S2b). Immunohistochemistry showed that expression of VEGF was reduced in tumor cells of Mxl‐Cre;GK f/f mice compared with control mice (Fig. S2c). Gankyrin deficiency would downregulate the expression of IL‐6 in Kupffer cells and that of VEGF in tumor cells. Thus, the deletion of gankyrin both in parenchymal and non‐parenchymal cells inhibited hepatocarcinogenesis.
Figure 2.
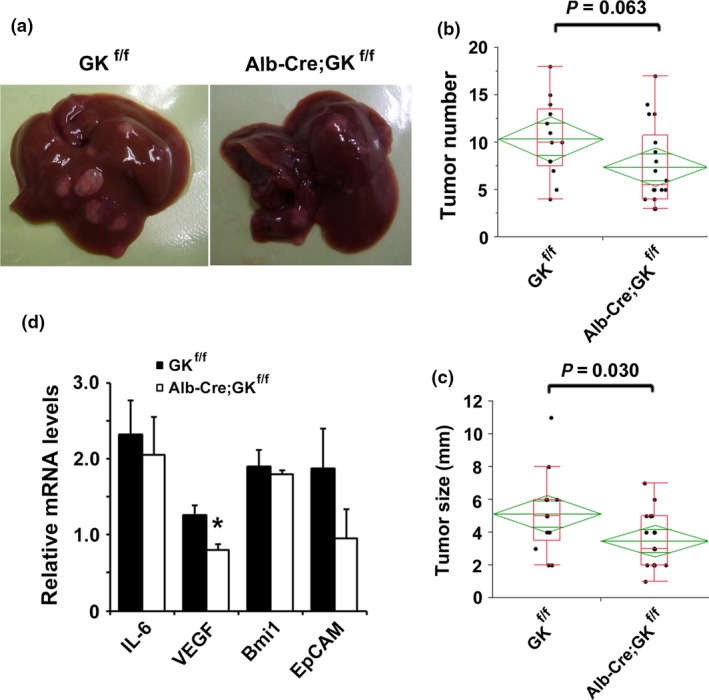
Attenuated hepatocarcinogenesis in Alb‐Cre;gankyrin f/f mice. (a) Typical examples of macroscopic tumorigenesis in the hepatocellular carcinomas (HCC) model. Livers of control (GK f/f) and Alb‐Cre;gankyrin f/f (Alb‐Cre;GK f/f) mice 8 months after diethylnitrosamine (DEN) injection are shown. (b) Tumor number and (c) maximal tumor sizes (diameters) in control (GK f/f, n = 13) and Alb‐Cre;gankyrin f/f (Alb‐Cre;GK f/f, n = 18) mice. (e) RNA was extracted from tumors of Alb‐Cre;gankyrin f/f (Alb‐Cre;GK f/f) and gankyrin f/f (GK f/f) mice. Relative amounts of mRNA were determined by real‐time quantitative PCR (qPCR) and normalized to the amount of actin mRNA. The amount of each mRNA in the untreated liver was given an arbitrary value of 1.0. Data are means ± SEM (n = 5).
We evaluated the role of gankyrin in HCC development in the liver parenchymal cells. Alb‐Cre;gankyrin f/f mice were generated by crossing gankyrin f/f mice with Alb‐Cre mice. Alb‐Cre;gankyrin f/f mice were negative for gankyrin only in liver parenchymal cells (Fig. 1a and Fig. S1b).12 Alb‐Cre;gankyrin f/f progeny obtained in the expected Mendelian ratio was healthy and failed to show any apparent liver dysfunction. The strain showed no spontaneous liver tumors up to 1 year of age. All gankyrin f/f and Alb‐Cre;gankyrin f/f mice challenged with DEN developed well‐differentiated HCC (Fig. S2a). Gankyrin deficiency in liver parenchymal cells reduced HCC size but not HCC number (Fig. 2a–c). Furthermore, the deletion of gankyrin in tumor cells reduced the expression of VEGF but not IL‐6 (Fig. 2d).
Several studies report that gankyrin promotes proliferation of cancer cells through the inhibition of apoptosis and cell cycle progression in vitro.15, 25, 26 We assessed the effect of gankyrin on cell death and proliferation in vivo. Gankyrin deletion exhibited no significant reduction in apoptosis and proliferation of tumors, as assessed by TUNEL assay and immunohistochemistry using anti‐Ki67 antibody, respectively (Fig. S3a,b). Gankyrin deletion affected neither the protein levels of p53 and RB1 nor the mRNA levels of their target genes (Fig. 3a and Fig. S3c).
Figure 3.
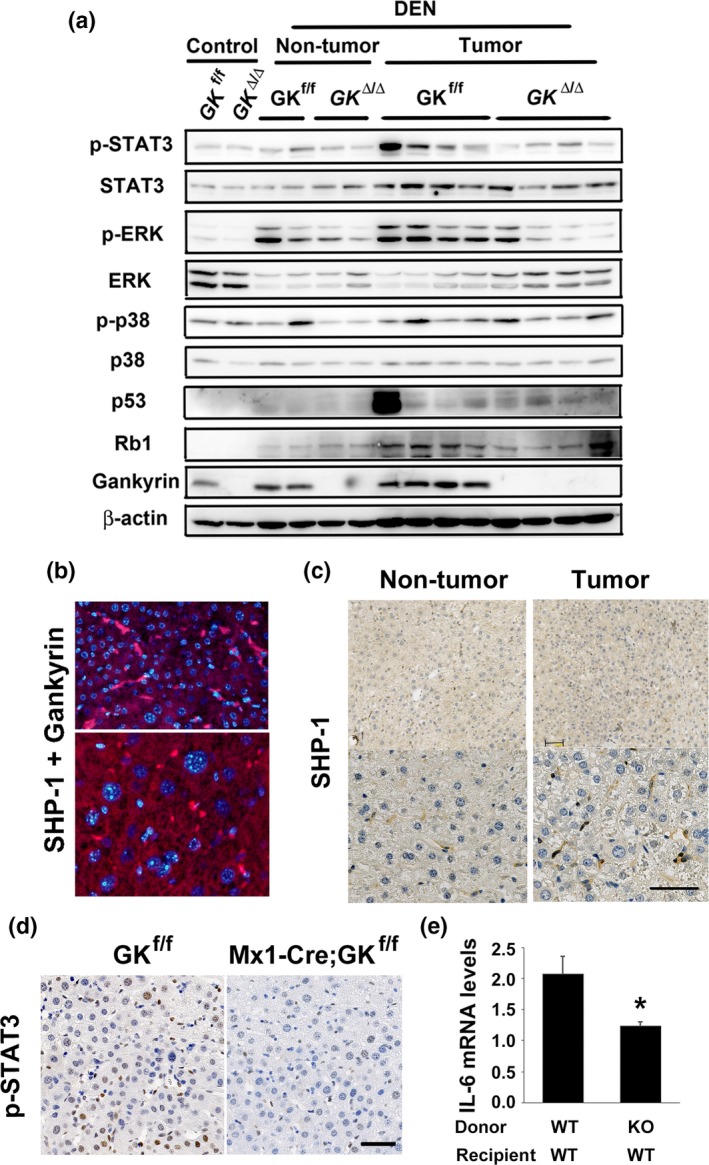
Gankyrin deficiency inactivated STAT3/IL‐6 signaling pathway in the cancer microenvironment. Control (GK f/f) and Mx1‐Cre;gankyrin f/f (GK Δ/Δ) mice were challenged with diethylnitrosamine (DEN) and killed after 8 months. (a) Homogenates of non‐treated livers (control), non‐tumor colon tissues (non‐tumor) and tumors (tumor) were gel‐separated and immunoblotted with the indicated antibodies. (b) The interaction of gankyrin with SHP‐1 was assessed by Duolink Assay in DEN‐treated gankyrin f/f liver. Non‐tumor and tumor liver tissues are shown in the upper and lower panels, respectively. (c) Representative images of immunohistochemical detection of SHP‐1 in livers (non‐tumor) and tumors (tumor) of gankyrin f/f mice challenged with DEN. Scale bar, 50 μm. (d) Representative images of immunohistochemical detection of phosphorylated STAT3 in tumors. Scale bar, 50 μm. (e) Six weeks after BMT, mice were injected intraperitoneally with DEN (100 mg/kg). Four hours after DEN injection, mice were killed and their livers were removed. Relative amounts of IL‐6 mRNA were determined by real‐time quantitative PCR (qPCR) and normalized to the amount of actin mRNA. The amount of each mRNA in the untreated liver was given an arbitrary value of 1.0. Data are means ± SEM (n = 3).
Next, we examined the differentiation status of HCC obtained from gankyrin f/f, Mx1‐Cre;gankyrin f/f and Alb‐Cre;gankyrin f/f mice. Analysis of H&E‐stained HCC sections did not show any difference in the differentiation status among these strains (Fig. S2a). Epithelial to mesenchymal transition (EMT) is a multistep biological process whereby epithelial cells change in plasticity by transient de‐differentiation into a mesenchymal phenotype. Gankyrin overexpression was reported to exhibit EMT phenotype, including loss of the epithelial marker E‐cadherin and gain of the mesenchymal marker vimentin in cell lines.27 However, gankyrin deficiency did not show significant difference in expression of EMT‐related genes (Fig. S4a,b).
Gankyrin deficiency inactivated signal transducer and activator of transcription 3/interleukin‐6 signaling pathway in the cancer microenvironment
Studies have shown that STAT3 plays a critical role in HCC development.24, 28 We examined the consequences of gankyrin deletion on several signaling pathways in liver parenchymal and non‐parenchymal cells. Gankyrin deletion significantly reduced the expression of phosphorylated STAT3 in tumors, and slightly reduced the expression in non‐tumor liver tissues (Fig. 3a). Gankyrin‐induced pro‐inflammatory response enhances the activation of ERK in colorectal tumors.12 This is in line with our result, wherein gankyrin deletion in non‐parenchymal cells reduced ERK activity in HCC (Fig. 3a). Previous studies have described a critical role of c‐Jun and c‐Jun N‐terminal kinases (JNK) in the development of HCC.20, 21, 29 We observed no effect of gankyrin deficiency on JNK activity (Fig. S5a).
SHP‐1, a well‐known inhibitor of activation‐promoting signaling cascades, negatively regulates signaling by STAT3 dephosphorylation.12, 30 The Duolink Assay showed the interaction between gankyrin and SHP‐1 as red punctate dots in liver tumors (Fig. 3b and Fig. S6), suggestive of STAT3 activation following gankyrin/SHP‐1 interaction in non‐parenchymal cells where SHP‐1 was predominantly expressed (Fig. 3c). HCC isolated from Mx1‐Cre;gankyrin f/f mice exhibited reduced expression of IL‐6, a downstream molecule of STAT3. To confirm the effect of gankyrin in non‐parenchymal cells, we performed bone marrow transplantation (BMT) experiments. Six weeks after BMT, mice were injected intraperitoneally with DEN (100 mg/kg). Four hours after DEN injection, mice were killed and their livers were removed. GK f/f mice rescued with gankyrin‐deficient bone marrow exhibited a reduced expression of phosphorylated STAT3 and IL‐6 compared with those rescued with wild‐type bone marrow (Fig. 3e and Fig. S7). In addition, no difference in IL‐6 expression and STAT3 activity was found between Alb‐Cre;gankyrin f/f mice and gankyrin f/f controls (Fig. 2d and Fig. S5b). Given that IL‐6 produced by non‐parenchymal cells activates the transcription factor STAT3 in the liver,24 the decrease in IL‐6 production in gankyrin‐deficient inflammatory cells may lead to reduced STAT3 activity in tumor cells through a paracrine mechanism. Indeed, immunohistochemistry results showed that the STAT3 activity in tumor cells as well as non‐parenchymal cells of Mx1‐Cre;gankyrin f/f mice was reduced as compared to that in gankyrin f/f controls (Fig. 3d). These data indicate that gankyrin in non‐parenchymal cells plays a crucial role in the regulation of STAT3/IL‐6 signaling, which is critical for DEN‐induced hepatocarcinogenesis.24
Signal transducer and activator of transcription 3 is essential for the expansion of liver cancer stem cell.11, 12, 28 Inflammatory cytokines such as IL‐6 are important for the dedifferentiation and generation of tumor‐initiating cells.9, 10, 11, 12, 13, 14 HCC isolated from Mx1‐Cre;gankyrin f/f mice, but not Alb‐Cre;gankyrin f/f mice, exhibited decrease in the expression of stem cell markers Bmi1 and EpCAM as compared to those from controls (Fig. 1e and 2d). Immunohistochemistry showed that expression of Bmi1 was reduced in tumor cells of Mxl‐Cre;GK f/f mice compared with control mice (Fig. S8). Taken together, gankyrin in non‐parenchymal cells may control STAT3 signaling and stem cell expansion within the tumor microenvironment.
Gankyrin accelerates proteasomal degradation of RB.15 Recently, we reported that gankyrin knockdown reduced STAT3 activities in a myeloid cell line.15 To investigate whether the gankyrin‐mediated STAT3 activation depends on degradation of SHP‐1 protein, we examined the protein expression level of SHP‐1 in the myeloid cell line. Gankyrin knockdown did not affect the protein level of SHP‐1 (Fig. S9a), suggesting that gankyrin activates STAT3 by inhibiting the phosphatase activity of SHP‐1, but not by accelerating the degradation of SHP‐1. Gankyrin knockdown decreased the mRNA level of SHP‐1 in THP‐1 cells (Fig. S9b). Given that gankyrin knockdown did not affect the protein level of SHP‐1, gankyrin might be involved in degradation of SHP‐1, but it is not the mechanism by which gankyrin activates STAT3. In myeloid cell lines, Mono Mac 6 cells and THP‐1 cells, gankyrin knockdown decreased the phosphorylation of STAT3 and the expression of downstream target genes Pim1 and Mcl‐1 (Fig. S9b,c).12
Gankyrin expression was upregulated in chronic hepatitis
In our previous study, we showed that longstanding intestinal inflammation increases the expression of gankyrin in the colonic mucosa of patients with inflammatory bowel disease.12 We assessed the association between gankyrin and chronic hepatitis by collecting liver biopsy specimens from patients clinically suspected to have non‐alcoholic steatohepatitis. Patient characteristics are shown in Table S1. Patients with chronic hepatitis exhibited an increase in the expression of gankyrin as compared with those without inflammation (Fig. 4a). Thus, gankyrin expression was associated with the disease activity of chronic hepatitis. Immunohistochemical studies has shown that gankyrin expression was enhanced in inflammatory cells as well as hepatocytes (Fig. 4b), indicative of the increased gankyrin expression in non‐parenchymal cells and hepatocytes during chronic inflammation.
Figure 4.
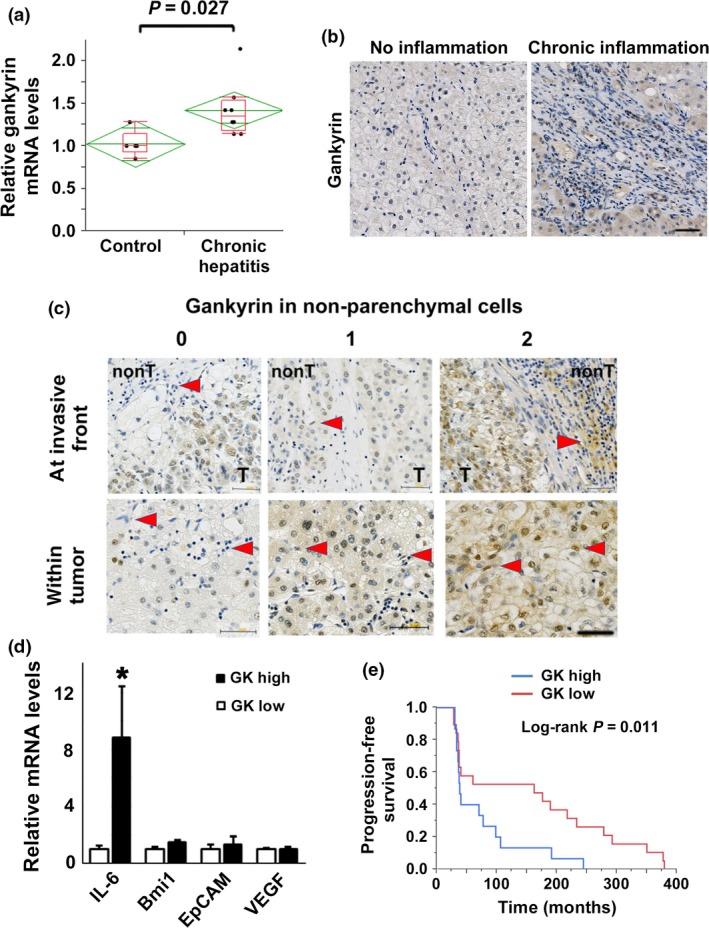
Association between gankyrin expression and poor prognosis in patients treated with sorafenib. (a) Liver specimens were collected using needle biopsy in 13 patients clinically suspected of non‐alcoholic steatohepatitis. The expression of gankyrin mRNA in livers without inflammation or fibrosis (control, n = 5) and those with inflammation and fibrosis (chronic hepatitis, n = 8) was determined by real‐time quantitative PCR (qPCR). (b) Representative images of immunohistochemical detection of gankyrin in livers of patients with and without chronic inflammation. Scale bar, 50 μm. (c) Liver specimens of hepatocellular carcinomas (HCC) were taken before sorafenib treatment. Representative images of HCC with intensity of the staining scored as 0 (negative), 1 (weak) or 2 (strong) are shown. Five fields were selected at the invasive front and within tumors. Immunohistochemical detection of gankyrin in non‐parenchymal cells of HCC (arrows) are shown. Scale bar, 50 μm. (d) Liver specimens were collected using needle biopsy before sorafenib treatment. The mRNA expression levels of indicated genes in HCC was determined by quantitative real‐time qPCR and compared between patients grouped according to the level of gankyrin expression in hepatic non‐parenchymal cells as assessed by immunohistochemistry. (e) Association between gankyrin expression and progression‐free survival (PFS) in patients with HCC. The Kaplan–Meier method was used to determine the PFS and log‐rank test was used to compare PFS between patients grouped according to the level of gankyrin expression in hepatic non‐parenchymal cells.
Association between gankyrin expression and progression‐free survival in patients treated with sorafenib
Sorafenib is the only anticancer drug with proven prognostic efficacy in HCC. Identification of surrogate biomarkers that predict the biological and clinical efficacy may help us predict the therapeutic response of patients.31 Cancer stem cells have been reported to play a pivotal role in drug resistance of various cancer types. Given the critical role of gankyrin in the regulation of STAT3 signaling and stem cell marker expression, we investigated the association between the therapeutic response to sorafenib and gankyrin expression using human HCC specimens collected prior to treatment. HCC specimens collected before sorafenib treatment were stained with anti‐gankyrin antibody (Fig. 4c). Based on immunohistochemistry, patients were divided into high‐gankyrin expression and low‐gankyrin expression groups. In line with the data in DEN‐induced hepatocarcinogenesis model, increased gankyrin expression in non‐parenchymal cells, but not in parenchymal cells, is significantly associated with enhanced IL‐6 expression (Fig. 4d and Fig. S10a). As regards VEGF, we previously reported that gankyrin expression is significantly associated with VEGF expression in human HCC.32 Our data using Alb‐Cre;gankyrin f/f mice indicates a significant relationship between gankyrin and VEGF in tumor cells (Fig. 5). We examined the impact of gankyrin expression in non‐parenchymal cells on the therapeutic response of patients treated with sorafenib. A log‐rank test using the Kaplan–Meier method showed that the low‐gankyrin expression group exhibited significant prolongation of PFS (P = 0.011, Fig. 4e), but not overall survival (OS; Fig. S11), as compared to the high‐expression group. By contrast, gankyrin expression in tumor cells affected neither PFS nor OS in patients treated with sorafenib (Fig. S10b,c). We have assessed the relationship between gankyrin expression in non‐parenchymal cells or parenchymal cells and several clinical parameters, including differentiation and stage of HCC (Table S2 and S3). No significant difference was observed in any parameters other than PFS between gankyrin low and high expression groups.
Figure 5.
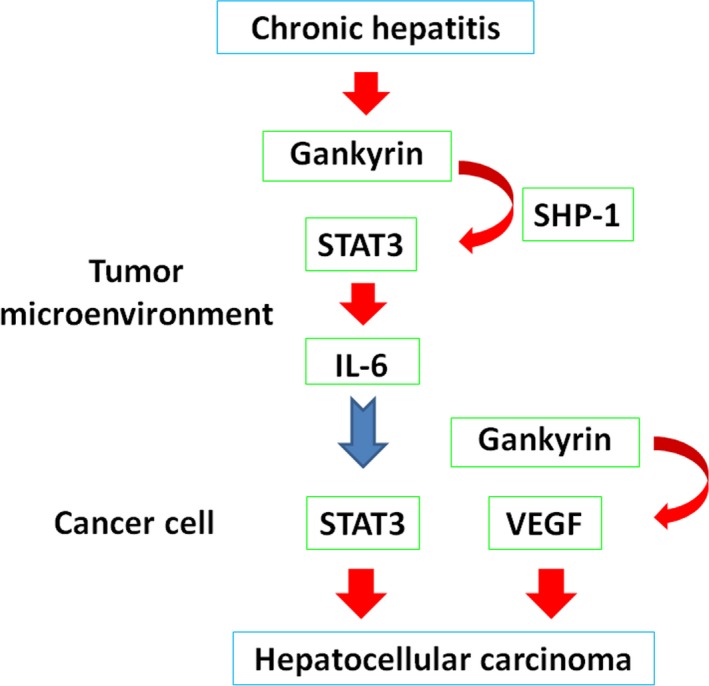
The role of gankyrin in the tumor microenvironment and hepatocarcinogenesis. Chronic inflammation enhances gankyrin expression in the human liver. Gankyrin binding to SHP‐1 leads to enhanced IL‐6 production in the tumor microenvironment. The augmented inflammatory response will activate STAT3, and gankyrin upregulates the expression of vascular endothelial growth factor (VEGF) in tumor cells, which eventually promote the development of hepatocellular carcinoma.
Discussion
Studies have shown that gankyrin is upregulated in many HCC cell lines, wherein it promoted the proliferation of cancer cells through the inhibition of apoptosis and cell cycle progression.15, 25, 26 However, the role of gankyrin in the development of HCC in vivo was unclear. Here, we investigated the role of gankyrin in controlling the tumor microenvironment. In our recent study, we revealed that gankyrin upregulates IL‐17 and TNF‐alpha expression in lamina propria cells of the colon and accelerates the development of colitis‐associated cancer.12 In the present study, we found that gankyrin activates STAT3 through SHP‐1 inhibition and IL‐6 upregulation in the tumor microenvironment, leading to enhanced hepatocarcinogenesis. Thus, STAT3/IL‐6 signaling may mediate the gankyrin‐induced cross‐talk between tumor cells and non‐parenchymal cells.
Gankyrin has been suggested as a regulator for liver tumor‐initiating cells.12, 16, 33 STAT3 activation in inflammatory cells regulates the expansion of cancer stem cells through augmented inflammatory response in the liver.11, 28 Thus, it is generally accepted that cytokine‐mediated inflammatory signaling pathways are important for dedifferentiation and generation of tumor‐initiating cells.9, 10, 11, 12, 13, 14 However, the precise mechanism involved in the activation of cancer‐initiating cells in response to pro‐inflammatory cytokines has been poorly understood. In this study, we provide the evidence that gankyrin expression in non‐parenchymal cells increases levels of cancer stem cell markers (Bmi1 and EpCAM), thereby promoting the expansion of cancer‐initiating cells in tumor microenvironment. We show that the molecular interaction between gankyrin and SHP‐1 leads to the activation of STAT3 and secretion of pro‐inflammatory cytokine IL‐6, which may explain the mechanism of gankyrin‐induced inflammatory responses by non‐parenchymal cells. Thus, understanding of the function of gankyrin in non‐parenchymal cells has elucidated a part of the molecular mechanism involved in HCC development.
In this study, we used two types of conditional gankyrin‐deficient mice: Alb‐Cre;gankyrin f/f and Mx1‐Cre;gankyrin f/f mice. Gankyrin deletion was confirmed in cancer cells in Alb‐Cre;gankyrin f/f mice and non‐parenchymal as well as cancer cells in Mx1‐Cre;gankyrin f/f mice. DEN‐induced HCC development was attenuated in Alb‐Cre;gankyrin f/f mice and to a greater extent in Mx1‐Cre;gankyrin f/f mice as compared with that in control gankyrin f/f mice. These studies with two types of conditional gankyrin‐deficient mice strongly suggest the important role played by gankyrin‐expressing non‐parenchymal and cancer cells in HCC development. This was supported by our observation that gankyrin expression was enhanced both in non‐parenchymal cells and hepatocytes of the liver tissue from patients with chronic hepatitis. In addition, DEN treatment significantly reduced the expression of the proangiogenic factor VEGF in HCC tissues of both Alb‐Cre;gankyrin f/f and Mx1‐Cre;gankyrin f/f mice. Thus, gankyrin may enhance tumor development through its effect in the tumor cell as well as the tumor microenvironment.
The therapeutic options for advanced‐stage HCC are limited, as HCC displays a poor response to systemic treatments such as conventional chemotherapy and radiotherapy. So far, sorafenib is the only anticancer drug with proven prognostic efficacy in HCC. Identification of surrogate biomarkers that predict the biological and clinical efficacy may help to tailor treatment to every individual patient.31 Sorafenib targets the abnormal activation of ERK often observed in human HCC.34 However, the predictive value of ERK signaling, including VEGF, for the efficacy of sorafenib in HCC remains uncertain.35, 36 The activation of other signaling pathways such as JNK and STAT3 may bypass the sorafenib‐induced blockade of ERK signaling, resulting in sorafenib resistance.21, 37 Thus, JNK and STAT3 signaling pathways are potential predictive biomarkers. To date, no robust predictive biomarker has been developed. In this study, we found a strong correlation between elevated gankyrin expression in the tumor microenvironment and unfavorable PFS in patients treated with sorafenib. Evaluation of gankyrin expression in HCC may be useful to differentiate between responders and non‐responders before starting sorafenib treatment and may help to select patients who are likely to benefit from the treatment. STAT3 modulation by gankyrin will contribute to sorafenib resistance, and gankyrin may represent a candidate biomarker to predict the likelihood of response to sorafenib in future HCC patients.
Targeting gankyrin might be a promising strategy for cancer prevention and treatment. Small molecular drugs that inhibit gankyrin have gained increasing interest as therapeutics for liver cancer.38 Given that gankyrin deletion has no effect on liver injury in several hepatitis models (data not shown), gankyrin inhibitors may work without severe adverse side effects. Further work should be performed to obtain more information about the clinical implication of gankyrin and for the development of new therapeutic strategies.
Taken together, gankyrin, upregulated in chronic inflammation, induces STAT3 activation and IL‐6 production by binding to SHP‐1 in non‐parenchymal cells. Such pro‐inflammatory cytokine responses may upregulate the expression of stem cell markers in the tumor microenvironment and eventually promote the development of HCC (Fig. 5). Thus, suppression and measurement of gankyrin expression is a promising approach for advanced treatment and personalized management of HCC patients.
Disclosure Statement
The authors have no conflict of interest to declare.
Supporting information
Fig. S1. Gankyrin expression in the liver.
Fig. S2. Diethylnitrosamine (DEN)‐induced hepatocellular carcinomas (HCC).
Fig. S3. Apoptosis and cell proliferation.
Fig. S4. Epithelial to mesenchymal transition (EMT) and gankyrin.
Fig. S5. Effects of gankyrin on signaling pathways.
Fig. S6. Duolink assay in Mx1‐Cre;GK mice.
Fig. S7. Bone marrow transplantation.
Fig. S8. Bmi1 expression in gankyrin‐deficient mice.
Fig. S9. Effects of gankyrin on SHP‐1.
Fig. S10. Effects of gankyrin expression in tumor cells.
Fig. S11. Effects of gankyrin expression in non‐parenchymal cells.
Table S1. Characteristics of controls and patients with chronic hepatitis.
Table S2. Patient characteristics and gankyrin expression in non‐parenchymal cells.
Table S3. Patient characteristics and gankyrin expression in tumor cells.
Acknowledgments
This study was supported by JSPS KAKENHI (26460979 and 17K09396) and a Health Labour Sciences Research Grant.
Cancer Sci 108 (2017) 1996–2003
Funding Information
Japan Society for the Promotion of Science, (Grant/Award Number: ‘17K09396‘,’26460979‘).
References
- 1. Thorgeirsson SS, Grisham JW. Molecular pathogenesis of human hepatocellular carcinoma. Nat Genet 2002; 31: 339–46. [DOI] [PubMed] [Google Scholar]
- 2. Bellentani S. The epidemiology of non‐alcoholic fatty liver disease. Liver Int 2017; 37(Suppl 1): 81–4. [DOI] [PubMed] [Google Scholar]
- 3. Lo RC, Ng IO. Hepatic progenitor cells: their role and functional significance in the new classification of primary liver cancers. Liver Cancer 2013; 2: 84–92. [DOI] [PMC free article] [PubMed] [Google Scholar]
- 4. Gargiulo G, Cesaroni M, Serresi M et al In vivo RNAi screen for BMI1 targets identifies TGF‐beta/BMP‐ER stress pathways as key regulators of neural‐ and malignant glioma‐stem cell homeostasis. Cancer Cell 2013; 23: 660–76. [DOI] [PubMed] [Google Scholar]
- 5. Wang MC, Jiao M, Wu T et al Polycomb complex protein BMI‐1 promotes invasion and metastasis of pancreatic cancer stem cells by activating PI3K/AKT signaling, an ex vivo, in vitro, and in vivo study. Oncotarget 2016; 7: 9586–99. [DOI] [PMC free article] [PubMed] [Google Scholar]
- 6. Effendi K, Mori T, Komuta M et al Bmi‐1 gene is upregulated in early‐stage hepatocellular carcinoma and correlates with ATP‐binding cassette transporter B1 expression. Cancer Sci 2010; 101: 666–72. [DOI] [PMC free article] [PubMed] [Google Scholar]
- 7. Yanai H, Atsumi N, Tanaka T et al Intestinal cancer stem cells marked by Bmi1 or Lgr5 expression contribute to tumor propagation via clonal expansion. Sci Rep 2017; 7: 41838. [DOI] [PMC free article] [PubMed] [Google Scholar]
- 8. Kim H, Park YN. Hepatocellular carcinomas expressing ‘stemness’‐related markers: clinicopathological characteristics. Dig Dis 2014; 32: 778–85. [DOI] [PubMed] [Google Scholar]
- 9. Adachi T, Sakurai T, Kashida H et al Involvement of heat shock protein a4/apg‐2 in refractory inflammatory bowel disease. Inflamm Bowel Dis 2015; 21: 31–9. [DOI] [PMC free article] [PubMed] [Google Scholar]
- 10. Sakurai T, Kashida H, Watanabe T et al Stress response protein cirp links inflammation and tumorigenesis in colitis‐associated cancer. Cancer Res 2014; 74: 6119–28. [DOI] [PubMed] [Google Scholar]
- 11. Sakurai T, Yada N, Watanabe T et al Cold‐inducible RNA‐binding protein promotes the development of liver cancer. Cancer Sci 2015; 106: 352–8. [DOI] [PMC free article] [PubMed] [Google Scholar]
- 12. Sakurai T, Higashitsuji H, Kashida H et al The oncoprotein gankyrin promotes the development of colitis‐associated cancer through activation of STAT3. Oncotarget 2017; 8: 24762–76. [DOI] [PMC free article] [PubMed] [Google Scholar]
- 13. Sakurai T, Kashida H, Komeda Y et al Stress response protein RBM3 promotes the development of colitis‐associated cancer. Inflamm Bowel Dis 2017; 23: 66–74. [DOI] [PubMed] [Google Scholar]
- 14. Schwitalla S, Fingerle AA, Cammareri P et al Intestinal tumorigenesis initiated by dedifferentiation and acquisition of stem‐cell‐like properties. Cell 2013; 152: 25–38. [DOI] [PubMed] [Google Scholar]
- 15. Higashitsuji H, Itoh K, Nagao T et al Reduced stability of retinoblastoma protein by gankyrin, an oncogenic ankyrin‐repeat protein overexpressed in hepatomas. Nat Med 2000; 6: 96–9. [DOI] [PubMed] [Google Scholar]
- 16. Mine H, Sakurai T, Kashida H et al Association of gankyrin and stemness factor expression in human colorectal cancer. Dig Dis Sci 2013; 58: 2337–44. [DOI] [PubMed] [Google Scholar]
- 17. Kennedy DW, Abkowitz JL. Kinetics of central nervous system microglial and macrophage engraftment: analysis using a transgenic bone marrow transplantation model. Blood 1997; 90: 986–93. [PubMed] [Google Scholar]
- 18. Van Rooijen N, Sanders A. Liposome mediated depletion of macrophages: mechanism of action, preparation of liposomes and applications. J Immunol Methods 1994; 174: 83–93. [DOI] [PubMed] [Google Scholar]
- 19. Sakurai T, Kashida H, Hagiwara S et al Heat shock protein A4 controls cell migration and gastric ulcer healing. Dig Dis Sci 2015; 60: 850–7. [DOI] [PubMed] [Google Scholar]
- 20. Sakurai T, Maeda S, Chang L, Karin M. Loss of hepatic NF‐kappa B activity enhances chemical hepatocarcinogenesis through sustained c‐Jun N‐terminal kinase 1 activation. Proc Natl Acad Sci USA 2006; 103: 10544–51. [DOI] [PMC free article] [PubMed] [Google Scholar]
- 21. Hagiwara S, Kudo M, Nagai T et al Activation of JNK and high expression level of CD133 predict a poor response to sorafenib in hepatocellular carcinoma. Br J Cancer 2012; 106: 1997–2003. [DOI] [PMC free article] [PubMed] [Google Scholar]
- 22. Remmele W, Stegner HE. Recommendation for uniform definition of an immunoreactive score (IRS) for immunohistochemical estrogen receptor detection (ER‐ICA) in breast cancer tissue. Pathologe 1987; 8: 138–40. [PubMed] [Google Scholar]
- 23. Sakurai T, He G, Matsuzawa A et al Hepatocyte necrosis induced by oxidative stress and IL‐1 alpha release mediate carcinogen‐induced compensatory proliferation and liver tumorigenesis. Cancer Cell 2008; 14: 156–65. [DOI] [PMC free article] [PubMed] [Google Scholar]
- 24. Naugler WE, Sakurai T, Kim S et al Gender disparity in liver cancer due to sex differences in MyD88‐dependent IL‐6 production. Science 2007; 317: 121–4. [DOI] [PubMed] [Google Scholar]
- 25. Dawson S, Apcher S, Mee M et al Gankyrin is an ankyrin‐repeat oncoprotein that interacts with CDK4 kinase and the S6 ATPase of the 26 S proteasome. J Biol Chem 2002; 277: 10893–902. [DOI] [PubMed] [Google Scholar]
- 26. Higashitsuji H, Higashitsuji H, Itoh K et al The oncoprotein gankyrin binds to MDM2/HDM2, enhancing ubiquitylation and degradation of p53. Cancer Cell 2005; 8: 75–87. [DOI] [PubMed] [Google Scholar]
- 27. Fu J, Chen Y, Cao J et al p28GANK overexpression accelerates hepatocellular carcinoma invasiveness and metastasis via phosphoinositol 3‐kinase/AKT/hypoxia‐inducible factor‐1alpha pathways. Hepatology 2011; 53: 181–92. [DOI] [PubMed] [Google Scholar]
- 28. He G, Yu GY, Temkin V et al Hepatocyte IKKbeta/NF‐kappaB inhibits tumor promotion and progression by preventing oxidative stress‐driven STAT3 activation. Cancer Cell 2010; 17: 286–97. [DOI] [PMC free article] [PubMed] [Google Scholar]
- 29. Hagiwara S, Kudo M, Chung H et al Activation of c‐Jun N‐terminal kinase in non‐cancerous liver tissue predicts a high risk of recurrence after hepatic resection for hepatocellular carcinoma. Hepatol Res 2012; 42: 394–400. [DOI] [PubMed] [Google Scholar]
- 30. Inoue T, Suzuki Y, Mizuno K, Nakata K, Yoshimaru T, Ra C. SHP‐1 exhibits a pro‐apoptotic function in antigen‐stimulated mast cells: positive regulation of mitochondrial death pathways and negative regulation of survival signaling pathways. Mol Immunol 2009; 47: 222–32. [DOI] [PubMed] [Google Scholar]
- 31. Kudo M. Biomarkers and personalized sorafenib therapy. Liver Cancer 2014; 3: 399–404. [DOI] [PMC free article] [PubMed] [Google Scholar]
- 32. Liu Y, Higashitsuji H, Higashitsuji H et al Overexpression of gankyrin in mouse hepatocytes induces hemangioma by suppressing factor inhibiting hypoxia‐inducible factor‐1 (FIH‐1) and activating hypoxia‐inducible factor‐1. Biochem Biophys Res Commun 2013; 432: 22–7. [DOI] [PubMed] [Google Scholar]
- 33. Qian YW, Chen Y, Yang W et al p28(GANK) prevents degradation of Oct4 and promotes expansion of tumor‐initiating cells in hepatocarcinogenesis. Gastroenterology 2012; 142: 1547–58. e14 [DOI] [PubMed] [Google Scholar]
- 34. Llovet JM, Ricci S, Mazzaferro V et al Sorafenib in advanced hepatocellular carcinoma. N Engl J Med 2008; 359: 378–90. [DOI] [PubMed] [Google Scholar]
- 35. Newell P, Toffanin S, Villanueva A et al Ras pathway activation in hepatocellular carcinoma and anti‐tumoral effect of combined sorafenib and rapamycin in vivo. J Hepatol 2009; 51: 725–33. [DOI] [PMC free article] [PubMed] [Google Scholar]
- 36. Abou‐Alfa GK, Schwartz L, Ricci S et al Phase II study of sorafenib in patients with advanced hepatocellular carcinoma. J Clin Oncol 2006; 24: 4293–300. [DOI] [PubMed] [Google Scholar]
- 37. Su JC, Tseng PH, Wu SH et al SC‐2001 overcomes STAT3‐mediated sorafenib resistance through RFX‐1/SHP‐1 activation in hepatocellular carcinoma. Neoplasia 2014; 16: 595–605. [DOI] [PMC free article] [PubMed] [Google Scholar]
- 38. Song X, Wang J, Zheng T et al LBH589 Inhibits proliferation and metastasis of hepatocellular carcinoma via inhibition of gankyrin/STAT3/Akt pathway. Mol Cancer 2013; 12: 114. [DOI] [PMC free article] [PubMed] [Google Scholar]
Associated Data
This section collects any data citations, data availability statements, or supplementary materials included in this article.
Supplementary Materials
Fig. S1. Gankyrin expression in the liver.
Fig. S2. Diethylnitrosamine (DEN)‐induced hepatocellular carcinomas (HCC).
Fig. S3. Apoptosis and cell proliferation.
Fig. S4. Epithelial to mesenchymal transition (EMT) and gankyrin.
Fig. S5. Effects of gankyrin on signaling pathways.
Fig. S6. Duolink assay in Mx1‐Cre;GK mice.
Fig. S7. Bone marrow transplantation.
Fig. S8. Bmi1 expression in gankyrin‐deficient mice.
Fig. S9. Effects of gankyrin on SHP‐1.
Fig. S10. Effects of gankyrin expression in tumor cells.
Fig. S11. Effects of gankyrin expression in non‐parenchymal cells.
Table S1. Characteristics of controls and patients with chronic hepatitis.
Table S2. Patient characteristics and gankyrin expression in non‐parenchymal cells.
Table S3. Patient characteristics and gankyrin expression in tumor cells.