Abstract
Comparative sequence analysis methods, such as phylogenetic footprinting, represent one of the most effective ways to decode regulatory sequence functions based upon DNA sequence information alone. The laborious task of assembling orthologous sequences to perform these comparisons is a hurdle to these analyses, which is further aggravated by the relative paucity of tools for visualization of sequence comparisons in large genic regions. Here, we describe a second-generation implementation of the GenePalette DNA sequence analysis software to facilitate comparative studies of gene function and regulation. We have developed an automated module called OrthologGrabber (OG) that performs BLAT searches against the UC Santa Cruz genome database to identify and retrieve segments homologous to a region of interest. Upon acquisition, sequences are compared to identify high-confidence anchor-points, which are graphically displayed. The visualization of anchor-points alongside other DNA features, such as transcription factor binding sites, allows users to precisely examine whether a binding site of interest is conserved, even if the surrounding region exhibits poor sequence identity. This approach also aids in identifying orthologous segments of regulatory DNA, facilitating studies of regulatory sequence evolution. As with previous versions of the software, GenePalette 2.1 takes the form of a platform-independent, single-windowed interface that is simple to use.
1. Introduction
An enduring challenge in developmental genetics is to decode non-coding genomic regions involved in gene regulation based upon DNA sequence alone. While relatively simple rules exist to infer protein-coding regions of the genome, it has long been appreciated that few hard-and-fast rules predict which genomic regions serve important non-coding functions (Aerts, 2012; Alonso et al., 2009). Transcriptional control regions, variously known as enhancers, cis-regulatory elements, or cis-regulatory modules, are often quite complex, comprising multiple docking sites for transcription factors that combinatorially determine the precise developmental time and location in which a gene is transcribed (Davidson and Peter, 2015; Levine, 2010). As each transcription factor recognizes relatively short and variable DNA sequence motifs, many more sites for a given factor will be found in a genomic region than could possibly be relevant in vivo (Wasserman and Sandelin, 2004). Computational tools that aid in the identification and characterization of regulatory sequences promote progress in understanding their genomic functions and evolutionary trajectories.
The examination of sequence conservation, a method known as phylogenetic footprinting (Tagle et al., 1988), is a commonly used strategy to identify likely functional portions of non-coding sequences. This approach exploits the observation that critical regulatory sequence functions may be constrained, often resulting in the conservation of important binding sites, while surrounding sequences fluctuate (Bulyk et al., 2003; Hardison, 2000; Pennacchio and Rubin, 2001). Countless examples demonstrate the success of phylogenetic footprinting in identifying highly conserved binding sites that serve various regulatory functions (Barolo et al., 2000; Jeong and Epstein, 2003; Miller et al., 2014, 2009; Nellesen et al., 1999). Furthermore, a handful of examples have identified binding sites within regulatory elements that have been preserved for exceptionally long periods, between phyla and across orders (Gehrke et al., 2015; Rebeiz et al., 2012, 2005; Yao et al., 2016).
While the conservation of a transcription factor binding site is an excellent predictor of likely regulatory sequence functions, the absence of conservation presents a relatively poor indicator that a sequence lacks function. Some tissues have been found to exhibit generally poor enhancer sequence conservation (Blow et al., 2010), and many examples of rapid sequence turnover have been documented in enhancers that nevertheless support conserved functions (Berman et al., 2004; Ludwig et al., 2000, 1998; Swanson et al., 2011). Thus, binding sites may not be perfectly conserved, but could have been replaced by other instances of the site, or sites for other factors that compensate for turnover. Computational tools that can identify “functionally conserved” binding sites, e.g. sites that are not themselves conserved, but reappear in the surrounding sequence, might aid in overcoming the challenges of identifying instances of binding site turnover (Aerts, 2012; Berman et al., 2004).
Although conservation is a powerful tool in the identification of regulatory sequences, it necessarily ignores regulatory sequences that have participated in evolutionary processes. A major theme in evolutionary developmental biology has been the role of regulatory sequence mutations in driving differences in gene expression that result in morphological differences (Carroll, 2008; Stern, 2000). However, function-altering mutations often represent a small number of potential sequence differences that exist between individuals or across species (Frankel et al., 2011; Jeong et al., 2008; Rebeiz et al., 2009), making it difficult to employ sequence comparisons alone to map phenotypically relevant variants. Furthermore, given the rapid turnover of regulatory sequences, it is often difficult to align these regions in order to delimit an orthologous region to be used in comparative tests of enhancer function. Hence, sequence conservation is often used to identify orthologous segments in analyses of regulatory sequence divergence (Frankel et al., 2012; Koshikawa et al., 2015).
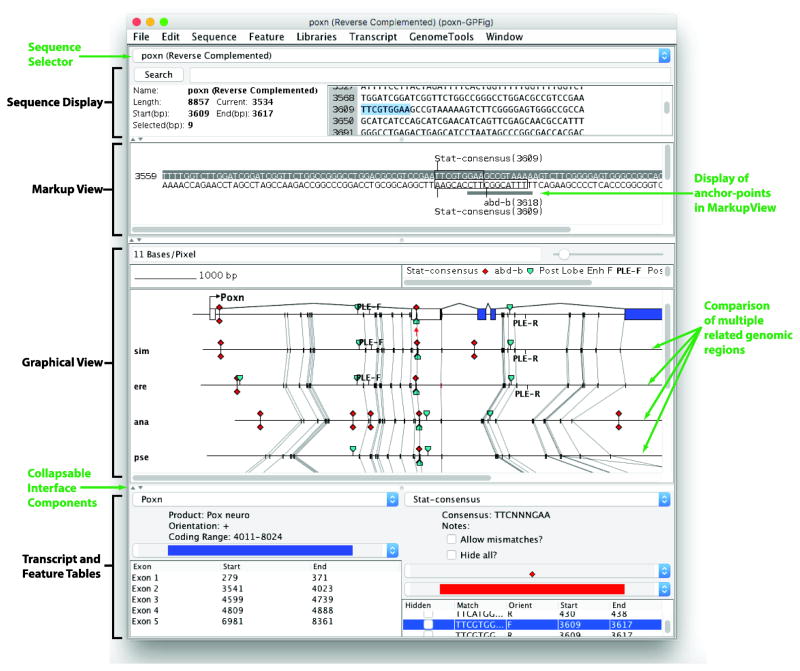
Here, we describe new streamlined methods for orthologous sequence acquisition and analysis using the GenePalette application (Figure 1). We initially released GenePalette in 2004 (Rebeiz and Posakony, 2004). At that time, there were relatively few tools offering the ability to access the large repertoire of genomic sequences and gene structure annotations available in GenBank. The GenePalette 1.0 release was unique in providing a highly interconnected user-friendly interface, allowing one to quickly traverse between different perspectives of the sequence (graphical, marked-up sequence, selectable text). We have added a new module that accesses the UC Santa Cruz genome browser database to acquire sequences orthologous to a region of interest. Sequences are aligned using a method that identifies high-confidence anchor-points along each sequence, the results of which are displayed in a graphical interface. These additions allow the assessment of binding site conservation and turnover, and will aid in determining orthology relationships in rapidly diverging regions. This ability greatly facilitates both the identification of highly conserved regulatory information in genomic sequence, but also fills important needs for comparative analyses of regulatory sequence divergence.
Figure 1. The GenePalette interface integrates genome alignments with sequence browsing functions.
New components are labeled in green. When multiple sequences are being compared, a selector box is present that allows the user to work with any of the compared sequences directly. In the Graphical View, the aligned sequences appear below the main sequence that is being referenced. Anchor-points are marked as gray boxes, and orthologous anchor-points are connected by lines. In the Markup View, sequences that are contained within an anchor-point are indicated by a gray box. Each panel of the interface can be collapsed to make vertical space for visualizing other components.
2. Results and Discussion
2.1 OrthologGrabber Module
One major hurdle in comparative sequence analysis is the acquisition of genomic sequences orthologous to a region of interest from one of the many sequence databases. This often time-consuming task usually involves either BLAST searches against an appropriate database, or use of tools such as the liftOver module of the UCSC genome database, which stores orthology relationships for a curated set of species comparisons (Tyner et al., 2017). In order to streamline this process, we sought to establish capabilities that would apply to a broad variety of organisms. The UCSC genome browser website maintains a large number of genome sequences in its database, including multiple species of fly and nematode, as well as many vertebrate groups. Although not comprehensive, the organization of the UCSC genome database presents a particularly convenient access point to the species it supports. Each genome database is accessible to the BLAT tool, which can rapidly identify regions of high sequence identity (Kent, 2002). Once a region is identified by BLAT, the database provides simple access points to obtain the DNA sequence of interest.
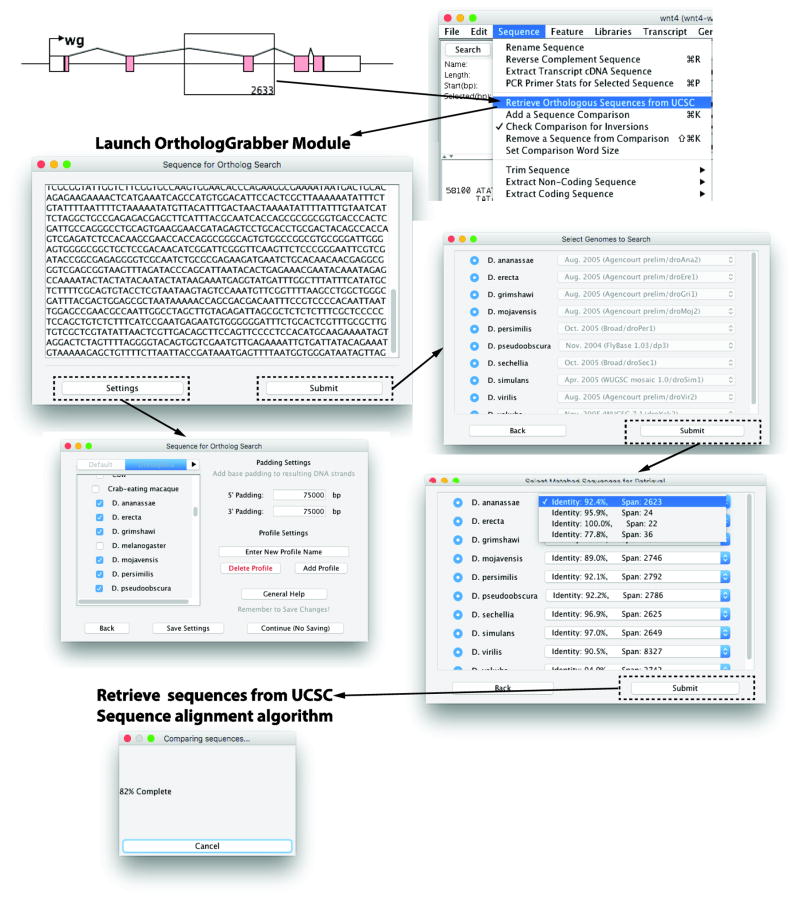
We designed the OrthologGrabber (OG) module to be a stand-alone program that will compare a sequence of interest to a user-selected list of genome databases at the UCSC genome browser by BLAT search (Figure 2). Through the settings page, the user can save a pre-selected grouping of species, and establish multiple profiles to rapidly toggle different groups of interest. This page also allows the user to specify how much sequence upstream and downstream of the BLAT match will be included in the retrieved sequences. Once a group of species is chosen through the settings menu, the user is then prompted to select which version of each indicated genome will be searched by BLAT. By default, the most recent genome version is always selected by the module. Next, a BLAT search is performed against each selected genome version, and the results are parsed by OrthologGrabber, and presented in the next dialog window. Here, the top scoring hit is selected, displaying the percent identity and length of matched area. Lower-quality hits may be selected, and a radio button allows the user to deselect species for which only a poor match was found in the database. From this page, each selected region of identity, including the specified flanking sequences, are retrieved by OrthologGrabber and written to the output. This output is collected by GenePalette and diverted to an alignment algorithm.
Figure 2. The OrthologGrabber module automates the retrieval of orthologous sequences from the UCSC genome database.
In the Graphical View, a user can click and drag a box to select a subregion of the currently loaded sequence to compare to the UCSC genome database. The OrthologGrabber module is launched through a menu item, opening a second java window. The Settings button allows the user to select the species to which the selected sequence will be compared, and specify the amount of flanking sequence to be retrieved from the database. Settings can be saved for frequent usage. Once the Submit button is pressed, the user is given the option to select among the different available versions of the selected genomes. The next window shows the results from the BLAT search, and users may select which BLAT match will be used for sequence retrieval. Retrieved sequences, including the specified amount of flanking sequence, are then fed back into GenePalette’s sequence alignment algorithm.
2.2 Sequence comparison function
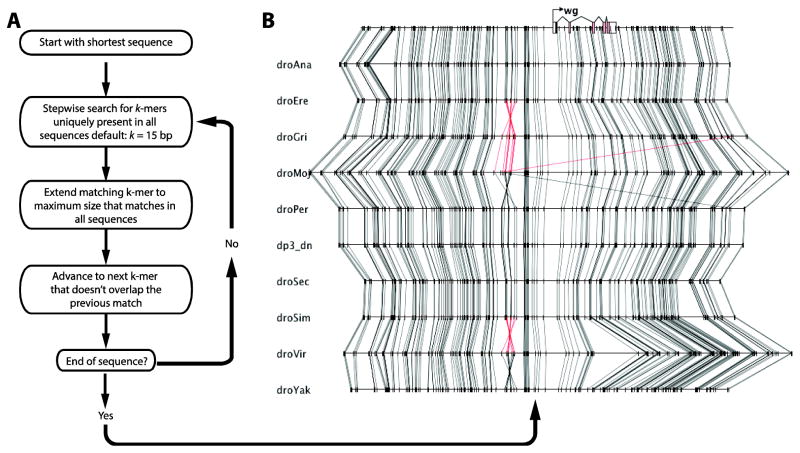
Conservation in non-coding sequences often manifests as short stretches of perfectly conserved sequence that can range from a few to dozens of nucleotides in length. When aligned, these conserved segments often stand out as co-linearly arranged “anchor-points”, often separated by insertions, deletions, and inversions (Figure 3B). In order to provide a graphical interface that could handle these challenges, we set out to implement a stand-alone sequence comparison function that could detect these small regions of conservation and display them visually within the pre-existing framework of the program.
Figure 3. Sequence comparison function identifies identical k-mers that serve as anchor-points for alignment.
(A) Sequence alignment algorithm. Among the sequences to be aligned, the algorithm selects the shortest sequence to reduce calculation time. The algorithm determines whether each subsequence of specified length (default k = 15) is perfectly conserved and unique in each sequence, and advances to the next subsequence until the end of the shortest sequence is reached. (B) The output is displayed in the Graphical View.
To identify a set of anchor-points shared between the aligned sequences, the program implements an algorithm that searches for sequence stretches of size k (default k = 15) that are present in all sequences (Figure 3A). To avoid repeated sequences that hamper the visualization of orthologous regions, matches are restricted to regions that occur only once in each aligned sequence. Each match is then expanded to identify the largest stretch matched in all sequences. The user can toggle whether both strands are searched, to detect inversions, or if only the one strand should be used. These anchor-points are then displayed in the Graphical View (Figure 1).
2.3 Interacting with sequence alignments in the interface
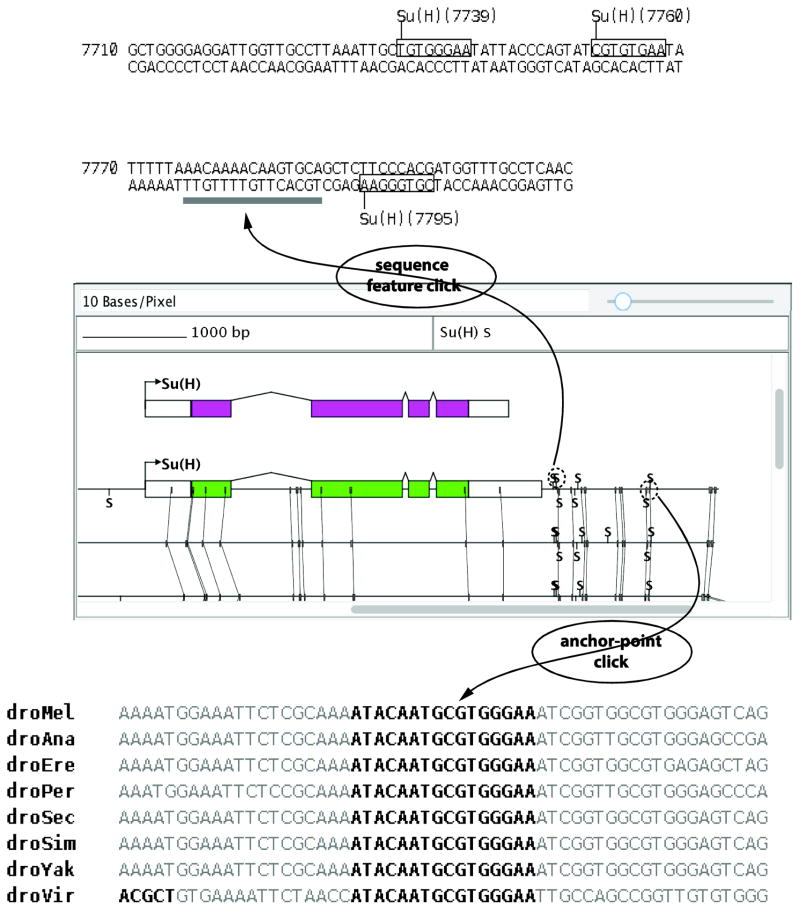
In addition to presenting the sequence alignment graphically, the interface has been designed for interactive browsing (Figure 4). Clicking on an anchor-point in the graphical display elicits several useful functions from the interface. First, it causes the clicked anchor-point to be highlighted and centered in the Graphical View. Second, an alignment of the clicked anchor-point is presented in the Markup View (Figure 4). Finally, the sequence of the clicked anchor is selected in the Sequence Display. When multiple sequences are being compared, each sequence is selectable from a drop-down menu in the Sequence Display (Figure 1). Clicking an anchor-point toggles this drop-down menu to the species whose anchor-point was clicked and highlights the sequence of the clicked anchor-point to be selected, providing rapid access to its native context.
Figure 4. Mouse clicks in the Graphical View will elicit several responses from the interface that integrate sequence alignment data.
Clicking on a sequence feature, such as a transcription factor binding site, will generate a Markup View that annotates the position of conserved anchor-points. On the other hand, clicking on an anchor-point will cause the Graphical View to re-center on the clicked anchor-point, select the sequence of the anchor-point in the Sequence Display, and generate a short alignment of the anchor-point and surrounding region in the Markup View.
A second way of interacting with anchor-points is provided through interactions between the Graphical View and Markup View. By clicking on any feature that is present on the sequence, or by dragging a box around a region in the Graphical View, a Markup View is generated, in which any overlapping anchor-points are drawn as a gray box below the sequence that makes up the anchor-point (Figure 4). This facilitates the evaluation of whether a transcription factor binding site or other feature added to the sequence is fully contained within the anchor-point, and is thus perfectly conserved.
One of the major strengths of the GenePalette platform is the ability to save files, and revisit them as experimental results accrue. This allows one to save primer sequences, candidate binding sites, and now conservation data in a file that can be accessed recurrently. New data, such as the DNA sequences of a plasmid construct, can be easily confirmed using the sequence comparison function. Further, as new results stimulate the next generation of experiments, the need to redesign primers or verify aspects of an experiment’s design often arises. Several improvements to the software have been incorporated to facilitate its active use in ongoing research projects. This includes a menu option to evaluate a selected region as a potential primer sequence, which brings up a window that shows the percent G/C, melting temperature, base composition, and reverse-complement sequence of the candidate primer region. As the addition of alignments to the interface cause the Graphical View to have a greater vertical depth, we have added the ability to hide individual panels of the interface (Figure 1), allowing for one to work more easily with very large vertical displays. Finally, to facilitate the dissemination of the program, we have developed online video tutorials that introduce its basic use, and demonstrate new functions.
2.4 Conclusions and future prospects
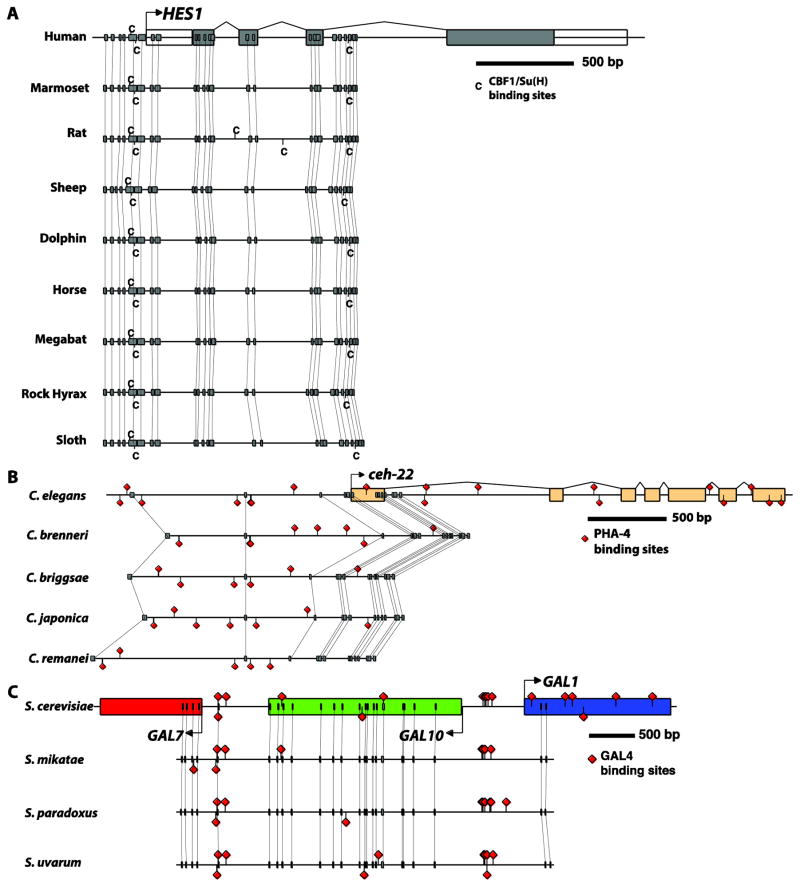
The GenePalette software program has served the developmental and genetics communities for over 10 years, providing the ability to design experiments and diagram findings about individual genes. The new additions described here automate time-consuming tasks that are commonplace in studies of gene function based on conservation, and in evolutionary studies of genetic divergence. These new capabilities also dynamically adapt to genomic resources as they become available in the UC Santa Cruz genome browser, allowing rapid access to sequences from a wide range of species groups (Figure 5). As new methods to infer function based on DNA sequence alone become available, we anticipate incorporating these new approaches into our existing framework.
Figure 5. Examples of anchor-point assisted phylogenetic footprinting in multiple species.
(A) A highly conserved pair of binding sites for CBF1/Su(H) upstream of the vertebrate Hes1 gene, as reported in (Bailey and Posakony, 1995; Rebeiz et al., 2012). (B) Comparative analysis of PHA-4 binding sites that were described upstream of the C. elegans ceh-22 gene (Gaudet and Mango, 2002) reveals their rapid turnover. (C) Conservation of UAS sequences bound by the GAL4 protein (West et al., 1984) in the divergent upstream region of the GAL1 and GAL10 genes. GenePalette was used to download and align the schematized sequences. A Postscript file exported from GenePalette was modified in Adobe Illustrator to enhance the presentation. Yeast genomes represented in (C) were manually obtained through the synteny viewer from SGD (http://www.yeastgenome.org/cgi-bin/FUNGI/FungiMap).
3. Materials and Methods
GenePalette and the OrthologGrabber module are both written with the Java JDK version 1.8. The OrthologGrabber has been compiled as a standalone .jar that can be implemented by other programs. The new version of GenePalette, as well as the standalone OrthologGrabber module and associated source code can be obtained through the www.genepalette.org website.
Highlights.
New capabilities facilitate the assessment of sequence conservation and divergence
An automated module retrieves sequences from the UCSC genome browser database
Interactive graphical alignments aid assessment of conservation and turnover
Acknowledgments
We thank our user community for continual support and input to our efforts. Members of the Rebeiz and Posakony labs provided critical discussions and suggestions that greatly improved the software over its development. This work was supported by the National Institutes of Health (GM107387 to M.R. and GM046993 to J.W.P) and the National Science Foundation (1555906 to M.R.).
Footnotes
Publisher's Disclaimer: This is a PDF file of an unedited manuscript that has been accepted for publication. As a service to our customers we are providing this early version of the manuscript. The manuscript will undergo copyediting, typesetting, and review of the resulting proof before it is published in its final citable form. Please note that during the production process errors may be discovered which could affect the content, and all legal disclaimers that apply to the journal pertain.
References
- Aerts S. Computational Strategies for the Genome-Wide Identification of cis-Regulatory Elements and Transcriptional Targets. Current Topics in Developmental Biology. 2012;98:121–145. doi: 10.1016/B978-0-12-386499-4.00005-7. [DOI] [PubMed] [Google Scholar]
- Alonso ME, Pernaute B, Crespo M, Gomez-Skarmeta J, Manzanares M. Understanding the regulatory genome. Int J Dev Biol. 2009;53:1367–1378. doi: 10.1387/ijdb.072428ma. [DOI] [PubMed] [Google Scholar]
- Bailey AM, Posakony JW. Suppressor of Hairless directly activates transcription of Enhancer of split complex genes in response to Notch receptor activity. Genes Dev. 1995;9:2609–26022. doi: 10.1101/gad.9.21.2609. [DOI] [PubMed] [Google Scholar]
- Barolo S, Walker RG, Polyanovsky AD, Freschi G, Keil T, Posakony JW. A Notch-independent activity of Suppressor of Hairless is required for normal mechanoreceptor physiology. Cell. 2000;103:957–969. doi: 10.1016/s0092-8674(00)00198-7. [DOI] [PubMed] [Google Scholar]
- Berman BP, Pfeiffer BD, Laverty TR, Salzberg SL, Rubin GM, Eisen MB, Celniker SE. Computational identification of developmental enhancers: conservation and function of transcription factor binding-site clusters in Drosophila melanogaster and Drosophila pseudoobscura. Genome Biol. 2004;5:R61. doi: 10.1186/gb-2004-5-9-r61. [DOI] [PMC free article] [PubMed] [Google Scholar]
- Blow MJ, McCulley DJ, Li Z, Zhang T, Akiyama JA, Holt A, Plajzer-Frick I, Shoukry M, Wright C, Chen F, Afzal V, Bristow J, Ren B, Black BL, Rubin EM, Visel A, Pennacchio LA. ChIP-Seq identification of weakly conserved heart enhancers. Nat Genet. 2010;42:806–810. doi: 10.1038/ng.650. [DOI] [PMC free article] [PubMed] [Google Scholar]
- Bulyk ML, McClay D, Hood L, Sarig O, Ziv Y, Barkai N, Smith H, Yandell M, Evans C, Holt R. Computational prediction of transcription-factor binding site locations. Genome Biol. 2003;5:201. doi: 10.1186/gb-2003-5-1-201. [DOI] [PMC free article] [PubMed] [Google Scholar]
- Carroll SB. Evo-devo and an expanding evolutionary synthesis: a genetic theory of morphological evolution. Cell. 2008;134:25–36. doi: 10.1016/j.cell.2008.06.030. [DOI] [PubMed] [Google Scholar]
- Davidson EH, Peter IS. Genomic Control Process, Genomic Control Process. Elsevier; 2015. [Google Scholar]
- Frankel N, Erezyilmaz DF, McGregor AP, Wang S, Payre F, Stern DL. Morphological evolution caused by many subtle-effect substitutions in regulatory DNA. Nature. 2011;474:598–603. doi: 10.1038/nature10200. [DOI] [PMC free article] [PubMed] [Google Scholar]
- Frankel N, Wang S, Stern DL. Conserved regulatory architecture underlies parallel genetic changes and convergent phenotypic evolution. Proc Natl Acad Sci. 2012;109:20975–20979. doi: 10.1073/pnas.1207715109. [DOI] [PMC free article] [PubMed] [Google Scholar]
- Gaudet J, Mango SE. Regulation of Organogenesis by the Caenorhabditis elegans FoxA Protein PHA-4. Science (80-) 2002;295(5556):821–825. doi: 10.1126/science.1065175. [DOI] [PubMed] [Google Scholar]
- Gehrke AR, Schneider I, de la Calle-Mustienes E, Tena JJ, Gomez-Marin C, Chandran M, Nakamura T, Braasch I, Postlethwait JH, Gómez-Skarmeta JL, Shubin NH. Deep conservation of wrist and digit enhancers in fish. Proc Natl Acad Sci U S A. 2015;112:803–808. doi: 10.1073/pnas.1420208112. [DOI] [PMC free article] [PubMed] [Google Scholar]
- Hardison RC. Conserved noncoding sequences are reliable guides to regulatory elements. Trends Genet. 2000;16:369–372. doi: 10.1016/s0168-9525(00)02081-3. [DOI] [PubMed] [Google Scholar]
- Jeong S, Rebeiz M, Andolfatto P, Werner T, True J, Carroll SB. The evolution of gene regulation underlies a morphological difference between two Drosophila sister species. Cell. 2008;132:783–793. doi: 10.1016/j.cell.2008.01.014. [DOI] [PubMed] [Google Scholar]
- Jeong Y, Epstein DJ. Distinct regulators of Shh transcription in the floor plate and notochord indicate separate origins for these tissues in the mouse node. Development. 2003;130:3891–3902. doi: 10.1242/dev.00590. [DOI] [PubMed] [Google Scholar]
- Kent WJ. BLAT--the BLAST-like alignment tool. Genome Res. 2002;12:656–64. doi: 10.1101/gr.229202. [DOI] [PMC free article] [PubMed] [Google Scholar]
- Koshikawa S, Giorgianni MW, Vaccaro K, Kassner VA, Yoder JH, Werner T, Carroll SB. Gain of cis-regulatory activities underlies novel domains of wingless gene expression in Drosophila. Proc Natl Acad Sci. 2015;112:7524–7529. doi: 10.1073/pnas.1509022112. [DOI] [PMC free article] [PubMed] [Google Scholar]
- Levine M. Transcriptional enhancers in animal development and evolution. Curr Biol. 2010;20:R754–R763. doi: 10.1016/j.cub.2010.06.070. [DOI] [PMC free article] [PubMed] [Google Scholar]
- Ludwig MZ, Bergman C, Patel NH, Kreitman M. Evidence for stabilizing selection in a eukaryotic enhancer element. Nature. 2000;403:564–567. doi: 10.1038/35000615. [DOI] [PubMed] [Google Scholar]
- Ludwig MZ, Patel NH, Kreitman M. Functional analysis of eve stripe 2 enhancer evolution in Drosophila: rules governing conservation and change. Development. 1998;125:949–958. doi: 10.1242/dev.125.5.949. [DOI] [PubMed] [Google Scholar]
- Miller SW, Avidor-Reiss T, Polyanovsky A, Posakony JW. Complex interplay of three transcription factors in controlling the tormogen differentiation program of Drosophila mechanoreceptors. Dev Biol. 2009;329:386–399. doi: 10.1016/j.ydbio.2009.02.009. [DOI] [PMC free article] [PubMed] [Google Scholar]
- Miller SW, Rebeiz M, Atanasov JE, Posakony JW. Neural precursor-specific expression of multiple Drosophila genes is driven by dual enhancer modules with overlapping function. Proc Natl Acad Sci. 2014;111:17194–17199. doi: 10.1073/pnas.1415308111. [DOI] [PMC free article] [PubMed] [Google Scholar]
- Nellesen DT, Lai EC, Posakony JW. Discrete Enhancer elements mediate selective responsiveness of Enhancer of split complex genes to common transcriptional activators. Dev Biol. 1999;213:33–53. doi: 10.1006/dbio.1999.9324. [DOI] [PubMed] [Google Scholar]
- Pennacchio LA, Rubin EM. Genomic strategies to identify mammalian regulatory sequences. Nat Rev Genet. 2001;2:100–109. doi: 10.1038/35052548. [DOI] [PubMed] [Google Scholar]
- Rebeiz M, Castro B, Liu F, Yue F, Posakony JW. Ancestral and conserved cis-regulatory architectures in developmental control genes. Dev Biol. 2012;362:282–294. doi: 10.1016/j.ydbio.2011.12.011. [DOI] [PMC free article] [PubMed] [Google Scholar]
- Rebeiz M, Pool JE, Kassner VA, Aquadro CF, Carroll SB. Stepwise modification of a modular enhancer underlies adaptation in a Drosophila population. Science (80-) 2009;326(5960):1663–1667. doi: 10.1126/science.1178357. [DOI] [PMC free article] [PubMed] [Google Scholar]
- Rebeiz M, Posakony JW. GenePalette: a universal software tool for genome sequence visualization and analysis. Dev Biol. 2004;271:431–438. doi: 10.1016/j.ydbio.2004.04.011. [DOI] [PubMed] [Google Scholar]
- Rebeiz M, Stone T, Posakony JW. An ancient transcriptional regulatory linkage. Dev Biol. 2005;281:299–308. doi: 10.1016/j.ydbio.2005.03.004. [DOI] [PubMed] [Google Scholar]
- Stern DL. Evolutionary developmental biology and the problem of variation. Evolution (N Y) 2000;54:1079–1091. doi: 10.1111/j.0014-3820.2000.tb00544.x. [DOI] [PubMed] [Google Scholar]
- Swanson CI, Schwimmer DB, Barolo S. Rapid evolutionary rewiring of a structurally constrained eye enhancer. Curr Biol. 2011;21:1186–1196. doi: 10.1016/j.cub.2011.05.056. [DOI] [PMC free article] [PubMed] [Google Scholar]
- Tagle DA, Koop BF, Goodman M, Slightom JL, Hess DL, Jones RT. Embryonic epsilon and gamma globin genes of a prosimian primate (Galago crassicaudatus). Nucleotide and amino acid sequences, developmental regulation and phylogenetic footprints. J Mol Biol. 1988;203:439–455. doi: 10.1016/0022-2836(88)90011-3. [DOI] [PubMed] [Google Scholar]
- Tyner C, Barber GP, Casper J, Clawson H, Diekhans M, Eisenhart C, Fischer CM, Gibson D, Gonzalez JN, Guruvadoo L, Haeussler M, Heitner S, Hinrichs AS, Karolchik D, Lee BT, Lee CM, Nejad P, Raney BJ, Rosenbloom KR, Speir ML, Villarreal C, Vivian J, Zweig AS, Haussler D, Kuhn RM, Kent WJ. The UCSC Genome Browser database: 2017 update. Nucleic Acids Res. 2017;45:D626–D634. doi: 10.1093/nar/gkw1134. [DOI] [PMC free article] [PubMed] [Google Scholar]
- Wasserman WW, Sandelin A. Applied bioinformatics for the identification of regulatory elements. Nat Rev Genet. 2004;5:276–287. doi: 10.1038/nrg1315. [DOI] [PubMed] [Google Scholar]
- West RW, Yocum RR, Ptashne M, Ptashne M. Saccharomyces cerevisiae GAL1-GAL10 divergent promoter region: location and function of the upstream activating sequence UASG. Mol Cell Biol. 1984;4:2467–2478. doi: 10.1128/mcb.4.11.2467. [DOI] [PMC free article] [PubMed] [Google Scholar]
- Yao Y, Minor PJ, Zhao YT, Jeong Y, Pani AM, King AN, Symmons O, Gan L, Cardoso WV, Spitz F, Lowe CJ, Epstein DJ. Cis-regulatory architecture of a brain signaling center predates the origin of chordates. Nat Genet. 2016;48:575–580. doi: 10.1038/ng.3542. [DOI] [PMC free article] [PubMed] [Google Scholar]


