

Abstract
X chromosome dosage compensation in Drosophila requires chromosome‐wide coordination of gene activation. The male‐specific lethal dosage compensation complex (DCC) identifies and binds to X‐chromosomal high‐affinity sites (HAS) from which it boosts transcription. A sub‐class of HAS, PionX sites, represent first contacts on the X. Here, we explored the chromosomal interactions of representative PionX sites by high‐resolution 4C and determined the global chromosome conformation by Hi‐C in sex‐sorted embryos. Male and female X chromosomes display similar nuclear architecture, concordant with clustered, constitutively active genes. PionX sites, like HAS, are evenly distributed in the active compartment and engage in short‐ and long‐range interactions beyond compartment boundaries. Long‐range, inter‐domain interactions between DCC binding sites are stronger in males, suggesting that the complex refines chromatin organization. By de novo induction of DCC in female cells, we monitored the extent of activation surrounding PionX sites. This revealed a remarkable range of DCC action not only in linear proximity, but also at megabase distance if close in space, suggesting that DCC profits from pre‐existing chromosome folding to activate genes.
Keywords: chromatin, chromosome conformation capture, nuclear architecture
Subject Categories: Chromatin, Epigenetics, Genomics & Functional Genomics
Introduction
The process of dosage compensation in Drosophila melanogaster involves doubling productive transcription of essentially all active genes on the single male X chromosome to match the combined output of the two female Xs. It provides an instructive example of coordinated, chromosome‐wide regulation of transcription (for a review see 1, 2). The regulator of this process, the male‐specific‐lethal dosage compensation complex (MSL‐DCC or just DCC), consists of five protein subunits (MSL1, MSL2, MSL3, MOF, and MLE) and two long, non‐coding RNAs (roX1 and roX2). Targeting the DCC to the X chromosome is thought to occur in at least two steps. The complex first recognizes and binds to about 250 so‐called high‐affinity sites (HAS; also referred to as chromosomal entry sites, CES), from which it “spreads” by an unknown mechanism to acetylate the chromatin of active genes in its vicinity 3, 4, 5, 6, 7. HAS often contain a GA‐rich, low‐complexity sequence motif, the MSL Recognition Element (MRE). We recently found that MSL2, the only male‐specific protein subunit of the DCC, is able to bind MREs with high selectivity 8. This study also revealed that MSL2 uses its CXC domain to identify a distinct sequence motif characterized by a crucial extension of the classical MRE signature, which are highly enriched on the X chromosome. These sites, which we termed “PionX” sites (pioneering sites on the X), are characterized by a novel DNA conformation signature 8. Sites bearing the PionX signature are the first contacts of MSL2 upon de novo induction of DCC assembly in female cells. The mechanism through which the initial binding of DCC to a small number of PionX sites (56 have been defined) initiates the activation of all genes on the X remains unknown. Conceivably, propagation of the DCC's H4K16 acetylation activity may profit from the folding of the X chromosome.
“Chromosome conformation capture” technologies, as well as DNA FISH, revealed that chromosomes are organized at different scales. Chromosomal domains are partitioned into active (A) and inactive (B) compartments, which alternate when mapped onto the linear chromosome, but may cluster in space to organize the interphase nucleus 9, 10, 11, 12. Changes in cell‐type‐specific gene activity during differentiation and the associated epigenetic marks correlate with corresponding changes of compartment patterns 13, 14. Multiplexed FISH experiments and more recent Hi‐C data on haploid single cells revealed that A and B compartments clearly segregate from each other in nuclear space 12, 15. Regions of increased chromosomal interactions can be visualized, termed “topologically associated domains” (TADs). TADs may be thought of as functional units of the hierarchical genome organization in mammals 16, 17 and in Drosophila 18, 19. The appearance of TADs in chromosome conformation mapping may reflect interactions between chromatin segments mediated by insulators or other multivalent structural proteins or interaction boundaries posed by binding of RNA polymerase II 17, 20, 21, 22. Sub‐TAD interactions generally reflect looping interaction of cis‐regulatory elements at active loci 23.
The function of the DCC might contribute to or profit from the three‐dimensional chromatin organization at any of these levels. The DCC interacts with HAS and nucleosomes in transcribed genes through distinct surfaces, and we hypothesized that the complex may “scan” the proximal space for target chromatin while bound to HAS 6. The TAD organization of the Drosophila X chromosome has been characterized in detail and was found stable in cell lines with male or female karyotype and not dependent on active dosage compensation 18, 19.
Given the prominent role of PionX sites in DCC recruitment, we explored the relationship between representative PionX sites and chromosome architecture using high‐resolution 4C in cells and Hi‐C in sex‐sorted Drosophila embryos. An analysis at the level of the chromosomal compartments (based on principal components), which are poorly studied in Drosophila embryos, was very informative. We found that acetylation of histone H4 at lysine 16 (H4K16ac) serves well to mark the active compartment. Despite quantitative differences in H4K16ac levels at male and female X chromosomes, the overall chromosome structure is invariant. PionX and other HAS distribute evenly throughout the active compartment in proximity to clustered active genes. High‐resolution 4C‐seq experiments showed that PionX loci are in spatial contact with many other loci within the active compartment, with no specific requirement for HAS at target sites. Remarkably, these interactions frequently span across large regions of inactive compartments, suggesting that they are enabled by spatial clustering of active domains. These long‐range interactions between PionX sites and between PionX to other HAS are more robust in males compared to females. To more quantitatively assess the extent of DCC action, we induced de novo DCC binding to a small number of PionX sites in female cells, revealing that the DCC activates target genes via transfer through space.
Results
The X chromosome compartment architecture is similar in male and female embryos
Previous Hi‐C data for Drosophila were generated either in mixed‐sex embryos 20 or in cultured cells with known sex 18, 19. The genomes of these cell lines are difficult to compare for sex‐ and dosage compensation‐related differences, because they bear large genomic re‐arrangements or genomic copy number alterations, such that Hi‐C datasets require extensive bias correction 18, 24. To better assess potential sex‐specific chromosome conformation differences, we sorted 16–18 h embryos according to sex and generated Hi‐C libraries (Table EV1).
We created coverage‐normalized contact enrichment maps as well as coverage‐ and distance‐normalized correlation maps with 10 kb resolution (Figs 1A and B, and EV1A; and see Materials and Methods 25). Both normalization approaches reveal very similar contact patterns for the two sexes. To determine the compartment architecture of the genome, we performed principal component analysis (PCA) on the correlation matrix 9. The first principal component (PC1, also called eigenvector) demarcates domains in the A and B compartment (Figs 1C and EV1B and C, and Dataset EV1). We define the sign of the PC1 vector such that regions with positive values are enriched for peaks of acetylation of histone H4 at lysine 16 (H4K16ac), and hence are referred to as active chromatin (also see below). Accordingly, we call the compartment with negative PC1 value “inactive”.
Figure 1. Hi‐C contact maps derived from male and female embryos reveal similar three‐dimensional topology of the X chromosome.

- Coverage‐normalized Hi‐C contact maps of the X chromosome at the region 11–15 Mb in female embryos (upper triangular matrix) and male embryos (lower triangular matrix) (resolution: 10 kb without smoothing). Sidebar indicates the active (red) and the inactive (gray) compartments as defined in panel (C).
- Smoothed, coverage‐ and distance‐normalized correlation matrix of the same region as in (A) (color key: red, positive; blue, negative correlation; resolution: 10 kb with 50 kb smoothing).
- First principal component (PC1) of the correlation matrix in (B). Positive values (red) indicate the active and negative values (gray) the inactive compartment. Right frame: Zoom‐in view of a locus switching compartments between female and male. See PC1 values in Dataset EV1.
Figure EV1. Hi‐C contact maps and the first principal component (PC1) of chromosomes X and 2L.
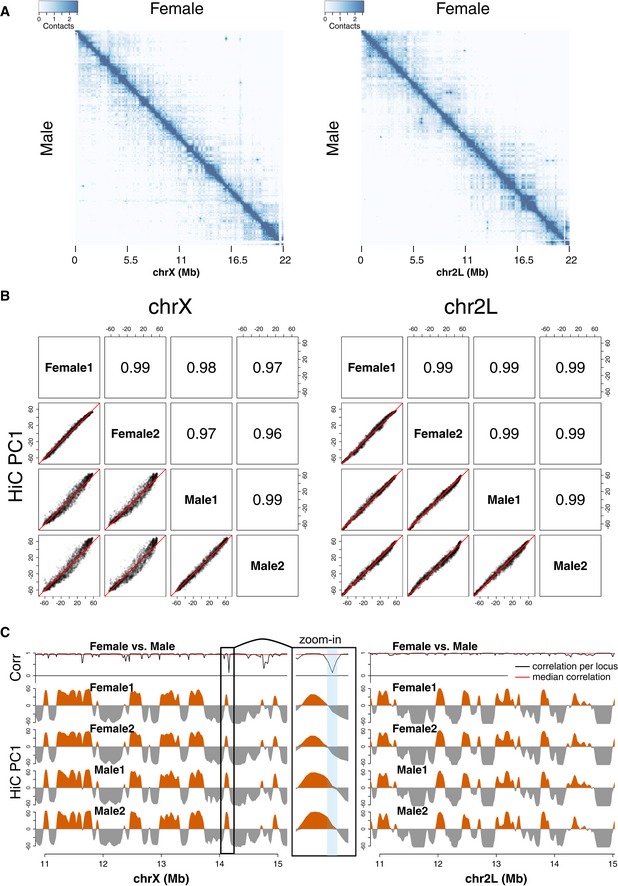
- Coverage‐normalized Hi‐C contact maps of chromosomes X (left) and 2L (right). Upper triangular matrix shows female and lower triangular matrix male embryo data.
- Scatterplots of Hi‐C PC1 values for chromosomes X (left) and 2L (right) in female and male embryos (2 biological replicates). Pearson′s correlation coefficients are shown in the corresponding upper panels. Note curved shape of the plot when comparing female and male PC1 values.
- Comparison of Hi‐C PC1 values for chromosomes X (left) and 2L (right) at the region 11–15 Mb in female and male embryos (2 biological replicates). Top track shows the correlation of contact enrichment between female and male samples for each Hi‐C fragment. “Zoom‐in” shows a view of a locus switching compartments and having low correlation between female and male. Resolution: 10 kb with 50 kb smoothing.
To further characterize the compartment architecture, we defined continuous regions (domains) within the active or inactive compartment. The size distribution of active and inactive domains is in the same range with medians around 100 kb on the X and 2L chromosomes in both sexes. Larger domains tend to be more loosely organized, judged by the inverse relationship between domain size and average intra‐domain contact enrichment (Appendix Fig S1A). Independent of size, the contact enrichment values for inactive domains are always higher than those of active domains, as expected 19 (Appendix Fig S1A and B). We find high correlation between female and male intra‐domain interactions for both compartments (Pearson's r = 0.95–0.99; Appendix Fig S1C).
In summary, the intra‐domain interactions are stronger for inactive compartments compared to active ones and these characteristics do not differ either between female and male embryos or between chromosome X and 2L.
Compartment switching correlates with differential marking of H4K16ac between females and males
Correlation of PC1 between sexes and biological replicates was remarkably high on the X chromosome as well as on chromosome 2L (Pearson′s r = 0.96–0.99; Fig EV1B). However, the PC1 varied more between females and males on the X chromosome compared to chromosome 2L and between replicates (Fig EV1B). We also note that the positive PC1 values are 15–20% higher on the male X compared to female suggesting enhanced interactions throughout the active compartment on this chromosome (Figs 1C and EV1B and C). Besides the overall difference in PC1 values, 7–8% of the X‐chromosomal fragments switch sign between sexes, but only 2–3% between replicates, suggesting that the corresponding loci reside in different compartments in female and male embryos (P‐value < 10−7, Fisher′s exact test; Figs 1C and EV1C).
To verify these differences using another approach, we calculated the correlation on the contact profiles between the two sexes for each Hi‐C fragment one by one and displayed them along the genome. The median correlation was relatively high for both chromosomes (chrX: r ~ 0.93; chr2L: r ~ 0.98); however, 15% of the fragments on the X chromosome have lower than 0.8 correlation of contact enrichment, while this is not the case for chr2L (Fig EV1C, uppermost track). A lower median correlation (r ~ 0.75) characterizes fragments that reside in different compartments in male and female nuclei.
To investigate whether these differences can be related to chromatin marks as suggested for human cells 13, 14, we compared the female or male PC1 values to H3K36me3 and H4K16ac profiles and to gene expression (RNA‐seq) in Kc (female) and S2 (male) cells (Appendix Fig S2). H3K36me3 decorates the gene body of “housekeeping” genes that are constitutively active in tissue culture cells and developing embryos 26. H4K16ac is present at the promoter of these genes independent of cell type, and in addition marks the body of genes selectively on the X chromosome in male cells, due to dosage compensation 27, 28, 29. Fragments with positive PC1 have higher levels of H4K16ac, H3K36me3, and RNA‐seq signal in all cells, which confirms their residency in the active compartment. In addition, H4K16ac levels are higher on the X chromosome, but not on chromosome 2L, in S2 cells compared to Kc cells reflecting dosage compensation (Appendix Figs S2A and S3A) 1, 27, 30. Interestingly, we find a positive correlation between the increase in H4K16ac (higher in S2 over Kc cells) and the difference of PC1 values (higher in males over females) on the X chromosome but not on 2L (Appendix Figs S2A and S3A, rightmost panel, respectively). This suggests a link between three‐dimensional chromatin interactions and the action of the DCC on target gene chromatin. As a control for this male‐specific effect, the difference of PC1 between the two sexes did not correlate with the difference in H3K36me3 or RNA levels (Appendix Figs S2B and C and S3B and C). Zooming in on fragments that not only differ in PC1 but also switch compartments (i.e., change the sign of PC1) reveals that in several cases, the compartment boundaries are shifted in male cells such that the active H4K16ac domain is extended at the expense of the inactive compartment. Curiously, the reverse was not the case: compartment switching fragments with higher PC1 in females do not carry elevated H4K16ac marks. Examples for those switches and a summary of occurrences are shown in Appendix Fig S4. Published data from the modENCODE project show that the correlation between PC1 values and H4K16 acetylation only depends on the sex of the cells and not on their origin (Appendix Figs S2D and S3D).
In summary, we found that the overall architecture of the X chromosome is similar in male and female embryos, and similar to cell lines of male and female genotype, in line with previous observations 18. In addition, we observed that slight differences in the three‐dimensional contacts of X‐chromosomal fragments (i.e., increased PC1 in the active compartment) correlate with higher H4K16ac levels in male compared to female cells.
Hallmarks of the dosage‐compensated compartment on the male X
Compartments (as defined by PCA) overlap with epigenetic domains in Drosophila, in agreement with previous findings 20. For example, domains of constitutive transcription (“yellow” chromatin 26) localize to the active compartment (Appendix Fig S5A and B). New RNA‐seq data, which we obtained from S2 and Kc cells, confirm that genes located in the active compartment are more highly expressed than genes in the inactive compartment (Appendix Fig S5C). The DCC acts on “yellow” chromatin, which is enriched in H3K36 methylation 26, 31, 32. This is confirmed by our RNA‐seq data showing that disrupting DCC in S2 cells by MSL2 depletion or inducing DCC in Kc cells by depleting the repressor of MSL2, SXL, preferentially modifies gene expression levels in the active compartment of the X (Appendix Fig S5D) 5.
The concept that the DCC acts in restricted parts of the genome is supported by the finding that the vast majority of MSL2 binding sites, HAS and PionX sites reside in the active compartment (Fig 2A and B, and Appendix Fig S6A). There they appear roughly evenly distributed, so that larger domains contain more HAS (Appendix Fig S6B). Seventy‐six out of 84 active domains contain at least one, on average three HAS (Fig 2C). Apparently, DCC action on target genes does not require a PionX site within each active domain, since the majority of active domains (50) does not contain any (Fig 2A and C, and Appendix Fig S6A). Domains with PionX sites tend to be larger than domains with only “regular” HAS and, consequently, have lower intra‐domain contact enrichments (Appendix Fig S6C).
Figure 2. Features of dosage compensation localize to the active compartment.

- Top track: First principal component (PC1) of the correlation matrix in male embryos (as in Fig 1). Bottom track: H4K16ac ChIP‐seq signal along the same region in S2 cells (male). PionX sites, high‐affinity sites (HAS) and H4K16ac peak regions are indicated with small bars. Examples of domains with or without PionX sites are framed.
- Fraction of H4K16ac, MSL2, HAS, and PionX sites overlapping domains located in the active (red) and inactive (gray) compartment.
- Left: Number of HAS within domains located in the active (red) and inactive (gray) compartment. Right: Number of PionX sites within domains containing HAS in the active compartment (ocher).
- Inter‐domain average contact enrichment sub‐matrices (150‐kB window centered at the crossing point of two sites in the contact matrix) displayed for pairs of HAS and PionX in females (top) and males (bottom). Enrichment values are reported as z‐scores (i.e., scaled to the mean). Interactions between 250 kb and 2.5 Mb distance are considered, resolution: 5 kb with 25 kb smoothing. Black rectangles indicate distance intervals for which contact enrichments were calculated and represented in (E).
- Inter‐domain average contact enrichments at distances of 70 kb (blue) and 25 kb (orange) from the center and at the center (0 kb, red) of sub‐matrices aligned around pairs of sites (same as in D; F, female and M, male). Top panel shows HAS–HAS, bottom panel PionX–PionX interactions. Boxplots represent mean values of 1,000 iterations (re‐sampling of 30 sites with replacement), where horizontal line indicates the median, box ranges the interquartile range (IQR) and whiskers 1.5x IQR. Contact enrichments are scaled to the corner (70 kb) of sub‐matrices that is considered as background.
Many loci in the Drosophila genome, such as polycomb response elements or enhancers, are engaged in long‐range, inter‐domain interactions 20, 23. It has been shown that HAS are involved in long‐range contacts in various cell lines 18. We find enrichment of pairwise interactions between HAS–HAS, HAS–PionX, and PionX–PionX fragments investigated in a range of 250 kb–2.5 Mb in both female and male embryos (Figs 2D and EV2A). Control fragments (HAS ± 200 kb) do not interact with each other (Fig EV2A). Interestingly, these inter‐domain interactions are stronger in males compared to females (on average 34% for HAS–HAS, 38% for PionX–HAS and 90% for PionX–PionX interactions) (Figs 2E and EV2B). Iterative re‐sampling of sites (30 sites with replacement, 1,000 iterations) confirms the statistical significance of the sex‐specific difference for PionX–PionX and PionX–HAS contacts and to some extent for HAS–HAS interactions (Fig EV2C). Control fragments lacking interactions are not statistically different (Fig EV2C). As HAS are mainly located in “yellow” chromatin, we also monitored the contacts of yellow domains in general (Fig EV2D). The contact enrichments are very similar suggesting that long‐range interactions are a general feature of active chromatin in both sexes.
Figure EV2. Inter‐domain contact enrichment at HAS sub‐classes.

- Inter‐domain average contact enrichment sub‐matrices (150 kB window centered at the crossing point of two sites in the contact matrix) displayed for pairs of PionX‐HAS and control sites (HAS ± 200 kb) in females (top) and males (bottom). Enrichment values are reported as z‐scores (i.e., scaled to the mean). Interactions between 250 kb and 2.5 Mb distance are considered, resolution: 5 kb with 25 kb smoothing.
- Inter‐domain average contact enrichments at 70 kb (blue) and 25 kb (orange) from the center and at the center (0 kb, red) of sub‐matrices aligned around pairs of sites (same as in A; F, female and M, male), where horizontal line indicates the median, box ranges the interquartile range (IQR) and whiskers 1.5x IQR. Top panel shows HAS‐PionX, bottom panel control (HAS ± 200 kb) interactions. Boxplots represent mean values of 1,000 iteration (re‐sampling of 30 sites with replacement). Contact enrichments are scaled to the corner (70 kb) of sub‐matrices that is considered as background.
- Boxplots show the distribution of P‐values of 1,000 re‐sampling iteration (two‐sided Wilcoxon rank‐sum test) comparing female and males at the center of each sub‐matrix (same categories as in Fig 2D and in panel A). In the boxplots, horizontal line indicates the median, box ranges the interquartile range (IQR) and whiskers 1.5x IQR.
- Inter‐domain average contact enrichment sub‐matrices (150‐kB window centered at the crossing point of two sites in the contact matrix) displayed for pairs of “yellow” chromatin domains on chromosomes X (left) and 2L (right) 26. Interactions between 250 kB and 2.5 Mb distance are considered.
Taken together, the DCC resides almost exclusively in the active nuclear compartment that constitutes an environment permissive for long‐range interactions. Long‐range interactions between PionX and PionX–HAS are significantly stronger in males, revealing a tendency to cluster locally in the nucleus.
High‐resolution 4C‐seq reveals interactions between PionX sites and active domains
In order to define the chromosomal interactions of selected PionX sites, we generated high‐resolution profiles by 4C‐seq in S2 cells (See details in Tables EV2 and EV3, and Datasets EV2 and EV3) 23, 33. We chose viewpoints close to either very prominent PionX sites and/or sites that are among the first to be bound by MSL2 in vivo, if dosage compensation is induced in female cells (Table EV4) 8. Female cells repress MSL2 expression and thus the male phenotype through the regulator sex lethal (SXL). If SXL is depleted by RNA interference, and MSL2 and roX expression ensues, the DCC forms and activates genes in the active compartment (Appendix Fig S5D) 5. Reprogramming cells in this way takes several days during which one can map the very first chromosomal contacts of the complex, which bear PionX signature 8. We refer to these sites as “induced” MSL2 binding sites in the later analysis.
4C profiles at eleven selected viewpoints in cell lines were remarkably similar to virtual 4C profiles extracted from the Hi‐C contact maps for the same loci in embryos (median correlation: ~0.65; Fig 3A and Appendix Fig S7A and B). We monitored the interaction network of these viewpoints and found them engaged in a total of 805 interactions (peaks) with an average of 73 interactions per viewpoint (Dataset EV2). The distance between viewpoints and interaction peaks varies greatly with a median of 500 kb including long‐range interactions reaching up to 10 Mb (Appendix Fig S8A). Most viewpoints reside well within active compartments, and most of their chromosomal contacts (on average 80%) are fragments in active domains marked by H4K16ac (Fig 3B and Appendix Fig S8B and C). Two viewpoints make fewer and shorter‐range contacts: the one at 3.8 Mb, close to a boundary, and viewpoint 12.8 Mb, which resides in a very small active domain surrounded by inactive domains (Fig 3 and Appendix Fig S7). The viewpoint at 19.9 Mb resides in the inactive compartment and makes restricted contacts to active and inactive domains surroundings (Fig 3B and Appendix Fig S7). PionX sites do not preferentially contact other HAS. The 4C interaction peaks overlap only moderately with MSL2 bindings sites (55%) and even less so with HAS (~25%) (Fig 3C and Appendix Fig S8C) indicating that the viewpoints are in contact with entire domains and not individual sites.
Figure 3. High‐resolution 4C profiles reveal 3D interactions between HAS and active domains.

- Top tracks: 4C (black, S2 cells) and Hi‐C (dark gray, male embryos) profiles from viewpoints close to PionX sites at 11.5 (roX2) and 12.5 Mb (tomosyn). 4C signal is reported as z‐score. 4C interaction peaks are marked by magenta bars and Hi‐C active domains by red shaded areas. See Dataset EV2. Bottom track: Peak regions of HAS and H4K16ac are indicated as blue and red bars, respectively.
- Fraction of 4C interaction peaks overlapping active (red) and inactive domains (gray) for each viewpoint. Number of peaks is indicated at the top.
- Fraction of 4C interaction peaks overlapping HAS.
Taken together, the 4C‐seq agrees with our Hi‐C findings that HAS including PionX sites in active domains mainly interact with other active domains even at megabase distance, thereby “jumping over” intervening inactive compartment domains. This is consistent with models in which active or inactive compartments form clusters and separate from each other in the nuclear space 11, 12, 15.
Inducing and disrupting dosage compensation do not alter interactions at individual viewpoints
Comparison of Hi‐C maps obtained from female and male embryos (this study) as well as from S2 cells upon MSL2 RNAi suggests that the overall architecture of the X chromosome is independent of sex and dosage compensation 18. However, given the quantitative nature of the dosage compensation process, interactions between individual HAS and adjacent domains may be quantitatively modulated. We therefore extended our high‐resolution 4C‐seq analysis to monitor differential interactions upon disrupting the complex in S2 cells (by MSL2 RNAi) or inducing DCC assembly in Kc cells (by SXL RNAi). We observed remarkably similar 4C profiles for control and RNAi conditions for both loss and gain of dosage compensation (Fig 4 and Appendix Fig S9). Profiles derived from the same viewpoint show very high correlation among biological replicates and among conditions (Pearson′s r ~ 0.98, r ~ 0.97, respectively). Hierarchical clustering on the correlation coefficients clearly separates the viewpoints but not the samples from each other (Appendix Fig S10).
Figure 4. Disrupting and inducing dosage compensation lead to minor changes in 4C signal.

-
A4C‐seq profiles in S2 cells treated with GFP RNAi (black line/gray shading) and MSL2 RNAi (red line) from viewpoints close to HAS at 15.8 and 16.5 Mb. Interaction peaks are marked by magenta bars.
-
BSimilar graphs as in (A) but in Kc cells treated with GFP RNAi (black line/gray shading) and SXL RNAi (red line).
-
C, DSummary statistics (DESeq) of differential 4C fragments between GFP vs. MSL2 RNAi‐treated S2 cells (C) and between GFP vs. SXL RNAi‐treated Kc cells (D). The number of fragments investigated, the differential fragments, the number of interactions (peaks), as well as differential interactions are indicated (cutoff: FDR < 0.01; log2(FC) > 1; n = 2). See Dataset EV3.
In order to monitor quantitative differences, we analyzed the 4C data by DESeq, as described previously (Dataset EV3) 23, 33. We compared the RNAi samples from each cell line (S2: control RNAi vs. MSL2 RNAi and Kc: control RNAi vs. SXL RNAi) to exclude distortions due to the extensive genomic copy number variations between the cell lines. On average, less than one percent of the 4C fragments were significantly different upon depletion of MSL2 in S2 cells (Fig 4C) and for most of the viewpoints the interaction peaks did not change significantly. Two out of the nine viewpoint profiles show a few more differential fragments (i.e., ~3% at 12.7 and 12.8 Mb); however, these changes are likely explained by local variability of adjacent low‐count fragments and also by relatively lower replicate correlations (Appendix Fig S10). Likewise, upon induction of DCC assembly in Kc cells on average, only three percent of the contacts changed without clear directionality (Fig 4D and Appendix Fig S9). We note that the number of differential fragments (not peaks) is higher in the Kc cell datasets compared to S2 cells. However, these fragments usually have low read counts compared to the peak regions and quite often adjacent fragments associated with the same gene change direction.
In summary, we conclude that neither DCC disruption nor induction significantly alters three‐dimensional 4C profiles from individual viewpoints close to PionX signatures.
The DCC activates genes in close intra‐ and inter‐domain 3D proximity
Our chromosome conformation analyses revealed that the overall compartment organization of the X is invariant, but that contacts within the active compartment are reinforced in males. The conformation of the X chromosome appears to serve as a scaffold on which the DCC acts. The functional consequences of an individual long‐distance contact are difficult to evaluate, given the multitude of interactions of many HAS throughout the active compartment (Fig 2A). Indeed, when dosage compensation is induced in female cells by depletion of the SXL repressor, we find that most genes that are activated are less than about 10 kb away from a HAS (Fig 5A). However, under those conditions, the newly formed DCC initially binds only a subset of HAS, with PionX signature (Table EV4) 8. Many domains harbor only a single such induced binding site (15 out of 21; Appendix Fig S11A), allowing us to investigate the effect of an isolated binding event on the transcription of surrounding genes. We find that genes located within 50 kb from these sites get significantly higher activated compared to more distal genes (P‐value < 10−7, two‐sided Wilcoxon rank‐sum test; Fig 5A) even though they reside in same domain with an average size of 200 kb (Appendix Fig S11A).
Figure 5. The dosage compensation complex acts locally around high‐affinity sites.

- Distance‐dependent transcription activation upon SXL RNAi in Kc cells. Top: RNA‐seq log2 fold change (SXL vs. GFP RNAi) related to the distance of genes to HAS (left and right) and SXL RNAi induced MSL2 binding sites (IND, middle) located in domains overlapping HAS (left; n = 1,656), induced sites (middle; n = 674) or inactive (NEG) compartment (right; n = 379). Thresholds for proximal and distal genes are indicated as vertical lines and corresponding P‐values are calculated by two‐sided Wilcoxon rank‐sum test. Bottom: −log10(P‐values) [y‐axis] justifying the threshold chosen for separating proximal and distal genes [x‐axis].
- Example of Hi‐C contact enrichment at viewpoint overlapping induced MSL2 binding site close to 19.5 Mb. Tracks indicate active (red) and inactive (gray) domains as well as domains proximal (light magenta) and distal (dark magenta) to induced sites (IND), proximal and distal negative control inactive regions (NEG, light and dark gray), proximal and distal HAS regions without induced site (light and dark blue) and average Hi‐C contact enrichment (gray profile) from the proximal region as viewpoint. “Induced site domains” larger than 100 kb and other domains larger than 50 kb are considered.
- Left: Intra‐domain and inter‐domain Hi‐C contact enrichments from domains with induced MSL‐2 binding sites. Proximal and distal domains are the same as in (B). Middle and right: RNA‐seq log2 fold change (SXL vs. GFP RNAi) of genes located in the same domains as in (B). Early indicates 3–6, whereas late 6–9 days of RNAi treatment. The number of genes used for statistical tests is indicated below the middle panel. In the boxplots, horizontal line indicates the median, box ranges the interquartile range (IQR) and whiskers 1.5x IQR.
We wished to explore whether activation could also occur through long‐range, inter‐domain interactions. We therefore scanned the profiles for situations where a domain bearing an induced site was in spatial contact with an active domain that lacks such a site, but separated by inactive compartment. We investigated 14 “induced site” domains (carrying 17 sites) that are larger than 100 kb (see Fig 5B and Appendix Fig S11B for examples). Within each domain, a clear distance dependence in contact enrichment from the “induced site” viewpoint can be seen, but also contacts “jumping over” the inactive compartment into the neighboring active domain are scored (Fig 5C, left panel). The activation of genes within the “induced site” domain correlated with their distance from the DCC binding site. Remarkably, we found that genes in the neighboring domain were activated to a similar extent as proximal genes within the same “induced site” domain (Fig 5C, middle and right panel). We also distinguish more distal HAS domains that are activated only later during the time course of RNAi (early: 3–6 vs. late: 6–9 days). This suggests that genes in a separated domain are brought into the radius of DCC activation by chromosome folding and that the range of DCC operation should be considered in nuclear space rather than on a linear chromosome map.
Discussion
Chromosome conformation reflects constitutive transcription in Drosophila
Previous work had shown that the three‐dimensional chromosome topology in Drosophila cell lines and embryos correlates well with chromatin states, RNA polymerase II binding and transcription 19, 20, 22. It appears that, at least in Drosophila, the conformation of chromosomes is an emergent property due to the underlying gene activity pattern 34. Drosophila genes are clustered in constitutively transcribed regions (“yellow” chromatin) interspersed by gene‐poor, long intron‐containing, inactive regions (“black” chromatin). In agreement, we find the active compartment marked with H3K36 trimethylation, H4K16 acetylation, and high level of gene expression (RNA‐seq). The clustering of “alike” chromatin in space not only leads to the formation of TADs 22 but is also evident at the level of compartments, which are formed by inter‐domain interactions between domains of similar activity status. Indeed, A/B compartments in human cells can be modeled based on DNA methylation, DNase hypersensitive sites, or single‐cell ATAC‐seq 14.
Our conclusion from the Hi‐C data that segments of inactive domains engage in more internal contacts than those in active regions, which appear more extended, agrees with earlier analyses of polytene chromosomes of larval salivary glands. There, the more extended interbands correspond to active, whereas the compact bands reflect the inactive TADs 19, 35.
The fact that the three‐dimensional interaction network appears mainly determined by constitutive gene activity explains why we and others 18 find no major differences in the chromosome conformation of female and male cells and no changes due to dosage compensation. Dosage compensation prominently fine‐tunes housekeeping gene transcription 36. According to a plausible model, the high‐affinity binding sites for the MSL‐DCC evolved from CT‐rich intronic splice enhancer precursor sequences 37. Being anchored close to or within active genes, the DCC can profit from the hard‐wired chromosome compartment organization to contact distant, active chromosomal regions. Basing the viewpoints of our high‐resolution 4C‐seq study as closely as possible to selected HAS and PionX sites, we zoomed in on the interaction profiles of HAS/PionX. We found that relatively short HAS‐containing loci interact widely with active domains, independent of the presence of another HAS in target chromatin. Apparently, once recruited to HAS/PionX, the MSL‐DCC can reach out to many loci in their 3D vicinity of the active compartment.
Extension of active domains in males may be due to DCC‐dependent chromosomal interactions
Although the conformation of the X chromosome in male and female embryos is highly similar, the Hi‐C analysis numerically highlighted a shift of interaction frequencies of loci in the active compartment. Occasionally, this even leads to compartment switching, that is, cases where homologous chromosomal loci reside in different compartments in male and female nuclei. Extensive switching of entire domains between active and inactive compartments had been described during lineage specification in human cells 13. Since Drosophila embryos of different sex mainly consist of the same cell types (except for germ line), one would not expect such differences between female and male Hi‐C datasets. The main difference between male and female X chromosomes is that the single X in males is dosage‐compensated, which involves enhanced H4K16 acetylation at transcribed gene bodies. H4K16ac also marks promoters of constitutively active genes in both sexes 28, 29, which is why H4K16ac is also enriched in the active compartment in female cells. We documented several cases where a compartment boundary within a transcribed gene was shifted on the male X chromosome such that the gene body was now part of the active compartment. This modulation of chromosomal interactions in male embryos correlated with high levels of H4K16 acetylation in male cultured cells of embryonic origin. The broad distribution of H4K16ac may interfere with contacts that define the inactive compartment. Alternatively, an extension of the active compartment may be explained by increased interactions from within the active domain to neighboring chromatin. In a popular scenario, the MSL‐DCC binds tightly to HAS and then reaches out by chromatin looping to acetylate active chromatin marked by H3K36me3 31. In such a case, the enhanced contacts may reflect the act of acetylation, rather than the presence of H4K16ac itself. The same principle would lead to a globally increased number of contacts within the active compartment on the male X chromosome.
PionX sites refine X chromosome conformation
One motivation for the current study was to test the hypothesis that PionX sites, which we had identified as first contact points of the DCC on the X chromosome 8, modulate the chromosomal conformation in ways that would facilitate dosage compensation. PionX sites do not appear to be necessary at all compensated loci since most active domains do not contain such sites. High‐resolution 4C‐seq, highlighting interactions between PionX and adjacent active domains, revealed that the chromosomal contacts of segments harboring PionX motifs are highly similar in male and female cells and after acute perturbation or induction of dosage compensation. We note that the lack of statistically significant differences in the 4C profiles could be due low statistical power (as only individual sites can be investigated) or technical noise. In contrast, averaging across all long‐range, inter‐domain PionX‐PionX contacts in the Hi‐C data, we identify significantly increased interactions in male embryos compared to females, which points to an additional refinement of folding of the dosage‐compensated X chromosome. This observation agrees with earlier DNA FISH studies, where very distal HAS (carrying PionX motif) were closer in 3D in male embryonic nuclei in an MSL2‐dependent manner 38.
The MSL‐DCC gene activation profits from chromosome folding
Due to the clustering of genes on the X chromosome and the relatively even distribution of HAS, the genes that are subject to dosage compensation are commonly within on average 10 kb of the next HAS. The clear distance dependence of gene activation can now be interpreted in the context of chromosome organization 4, 18. In order to evaluate the radius of action of an individual HAS, we took advantage of our recent observation that during early times of ectopic induction of dosage compensation in female cells, the DCC preferentially binds to a subset of HAS with PionX signature 8. Combining domain information and PionX sites, we investigated the function of single strong MSL2 binding sites within an active domain. Genes within a 50‐kb window around the binding site were activated significantly better than more distant ones. This determines the functional radius of such a site.
The analysis of gene activation within a domain does not reveal whether the activation over distance involves looping or linear diffusion of the MSL‐DCC from a HAS, possibly facilitated by other HAS or secondary elements of lower affinity. However, the observation that primary binding of MSL‐DCC to a PionX site in one domain can lead to activation of genes in a second domain that is separated by a large inactive domain strongly argues in favor of a transfer through space. Such spatial propagation is facilitated by the compartment organization of the chromosome, which is formed by association of active and inactive domains in space. The functional radius of DCC bound to a given site must be defined as a volume within the active part of the chromosome. The fact that activation can occur over several hundreds of kilobases by spatial transfer and yet most genes have a HAS within tens of kilobases suggests a high level of functional redundancy and flexibility in the precise mechanism of activation.
Model of dosage compensation in the context of nuclear architecture
Our data are consistent with the following model for dosage compensation. Active and inactive X‐chromosomal compartments segregate from each other in a similar fashion in females and males suggesting a hard‐wired architecture (Fig 6). Binding sites of the DCC (i.e., PionX and HAS) reside almost exclusively in the active compartment, targeting the complex to its sites of action. Initially, the DCC binds to a limited number of sites that bear a specific DNA signature (i.e., PionX). Propagation of the DCC from these sites occurs locally within domains but also in space via long‐range interactions within the active compartment. It identifies and modifies actively transcribed genes through a reader–writer module of subunits: MSL3 binds to H3K36‐methylated nucleosomes, which become substrate for the HAT activity of MOF. These interactions of DCC with substrate nucleosomes could lead to an elevated level of contacts within the active compartment, which are particularly significant in the vicinity of PionX sites. The functional consequences of these contacts are scored as transcription activation. The distance dependence of activation reveals that the functional radius of DCC is defined in space rather than on the linear chromosome map.
Figure 6. Model of dosage compensation in the context of nuclear architecture.

Chromosomes are divided into active (red) and inactive (black) domains that cluster to form compartments (red and black shading). This hard‐wired architecture is probably determined by the activity of constitutive genes independently of sex and dosage compensation. High‐affinity sites (blue) reside in the active compartment; however, they are bound by the dosage compensation complex (DCC; green) only in males (rightmost panel) and not in females (leftmost panel). De novo induction of DCC assembly by reprogramming female cells (middle panel) leads to DCC binding to a limited number of “induced” sites from which the DCC acts on genes in the spatial proximity within and between domains (green arrows). DCC action strengthens pre‐existing long‐range contacts within the active compartment and occasionally extends the active compartment in males.
Materials and Methods
Hi‐C analysis
The sex‐sorted embryo Hi‐C data were generated in biological duplicates and are available from GSE94115. The embryo sorting was based on a Y chromosomal GFP reporter (y[1]w[67c23]/Dp(1;Y)y[+],P{w[+mC] = ActGFP}SH1) described in 39. The flies were raised in standard cornmeal yeast extract media at 25°C. Embryos were collected in 0.03% Triton X‐100, 0.4% NaCl 16–18 h after egg laying, then dechorionated for 5 min in fresh bleach. ~3,000 GFP+ (male) and GFP− (female) embryos each were sorted with a Union Biometra COPAS Large Particle Sorter, and then processed for Hi‐C as in 20.
Paired‐end reads were mapped separately to the reference genome (BDGP5.74) using bowtie2 (2.0.2) with “‐local” settings (Table EV1). In general, all Hi‐C data processing and analysis steps were carried out using the Homer software package 25. In detail, paired‐end tag directories were generated either by pooling technical (sequencing) replicates for biological replicate comparisons or also pooling biological replicates to maximize coverage for each condition. Reads were extensively filtered with the recommended parameters, that is, “‐tbp 1 ‐removePEbg ‐fragLength 500 ‐restrictionSite GATC ‐both ‐removeSelfLigation ‐removeSpikes 10000 5” (Table EV1). Background models, coverage‐normalized (“‐simpleNorm”) as well as coverage‐ and distance‐normalized correlation matrices (“‐corr”) were created using various resolutions (“‐res”) and smoothing (“‐superRes”) windows, from which 10 kb resolution with 50 kb smoothing was chosen for downstream analysis. Contact enrichment values were always extracted from the coverage‐normalized matrix. The genome was divided into two compartments based on principal component analysis of the correlation matrix (“runHiCpca.pl”), where H4K16ac regions (peaks) served as a seed to define the sign of the PC1 values (Dataset EV1). Active or inactive domains were defined as continuous regions with positive or negative PC1 values. To directly compare female and male Hi‐C profiles, correlation between interaction profiles of individual loci (fragments) was calculated among the samples (“getHiCcorrDiff.pl”).
Downstream analysis (overlaps, densities, statistical tests etc.) and plotting (heatmaps, profile plots, boxplots etc.) were performed using R and Bioconductor packages. To test whether there is a difference in Hi‐C contact enrichment values between compartments or subsets of domains, nonparametric, two‐sided Wilcoxon rank‐sum tests were performed.
4C‐seq experimental procedures
4C‐seq was carried out on S2‐DRSC cells (DGRC stock: 181) and Kc167 (DGRC stock: 1) in biological duplicates. RNAi was performed as described previously 40 using the following primers for dsRNA PCR template generation:
GFP‐forward: TTAATACGACTCACTATAGGGTGCTCAGGTAGTGGTTGTCG
GFP‐reverse: TTAATACGACTCACTATAGGGCCTGAAGTTCATCTGCACCA
MSL2‐forward: TTAATACGACTCACTATAGGGAGAATGGCCCAGACGGCATAC
MSL2‐reverse: TTAATACGACTCACTATAGGGAGACAGCGATGTGGGCATGTC
SXL‐forward: TAATACGACTCACTATAGGGAGACCCTATTCAGAGCCATTGGA
SXL‐reverse: TAATACGACTCACTATAGGGAGAGTTATGGTACGCGGCAGATT
(SXL from DRSC28896; 5).
After 7 days of RNA interference, cells were resuspended in fresh medium and fixed with 1% formaldehyde for 10 min at room temperature. Fixing was quenched by adding glycine (final concentration 125 mM) and by cooling on ice. Cells were collected in a cooled centrifuge, snap‐frozen in liquid nitrogen, and stored at −80°C. 4C‐seq templates were generated on ~60 million fixed cells per replicate using four‐cutter restriction enzymes DpnII and NlaIII, as described previously 23. Libraries were amplified using 100 ng 4C‐seq templates and Pfu Turbo DNA polymerase in eight PCR replicates, which were pooled for later analysis. Primers were designed to allow a multiplexing of 48 samples (for 12 viewpoints and four conditions) on a sequencing lane (Table EV2). Biological replicates were sequenced on two separate lanes of an Illumina NextSeq 500 sequencer. Datasets are available at GSE94115.
4C‐seq analysis
4C‐seq analysis was essentially based on the FourCSeq Bioconductor package 33. In detail, FASTQ files were de‐multiplexed using a python script available in the package and aligned to the reference genome (BDGP 5.74) using bowtie2 (2.0.2) with “‐local” settings. Reads were filtered for mapping quality (mapq > 1), and non‐digested, self‐ligated fragments were removed (Table EV3). Reads were initially counted for each valid DpnII fragment, and obtained read counts per fragment were summed over larger windows (from 2.5 kb up to 10 kb). Z‐Scores were calculated at each of these of windows with various minimum count thresholds (“getZScores()”). To identify peaks (significant interactions), a Z‐score threshold of 2 and an FDR threshold of 0.05 were applied using the “addPeaks()” function. Final settings of window size and minimum counts were chosen based on the number of peaks obtained (Dataset EV2). Z‐scores and peak coordinates were used for plotting 4C profiles and for overlap analysis. To find significant differences among conditions, DESeq was run on the counts for each fragment (or window) using the “getAllResults()” function of the FourCSeq package (Dataset EV3). Cutoffs were defined with an adjusted P < 0.01 and a change log2(FC)| > 1.
ChIP‐seq datasets and analysis
Datasets related to high‐affinity sites (HAS), CXC‐dependent (PionX) and SXL‐induced site definitions were described in 6 and 8. Briefly, HAS were identified as the co‐localization of MSL‐2 and MLE in in vivo ChIP‐seq 6. PionX sites are in vitro DIP‐seq MSL‐2 sites that lose binding upon deletion of its CXC domain, and SXL‐induced sites were obtained by hierarchical clustering of MSL‐2 sites upon SXL RNAi time course in Kc cells (Table EV4) 8.
In parallel to the SXL RNAi experiments in Kc cells, we generated a new set of MSL2 (4 replicates) and H4K16ac (1 replicate) ChIP‐seq profiles in S2 cells (GSE94115). These ChIP experiments were performed according to 41 adapted to cell lines 8. Briefly, cells were resuspended in ice‐cold homogenization buffer and fixed with 1% formaldehyde for 10 min at room temperature. After quenching with 125 mM glycine, the cells were collected, washed, and sonicated in RIPA buffer with a Covaris sonifier (PIP: 140, DF 20%, CB: 200) for 30 min. MSL2 antibody was previously described in 42, and H4K16ac was acquired from Active Motif (#39167).
H3K36me3 ChIP‐seq was performed on MNase‐digested chromatin as described previously 4 and 43 with some modifications. Cells were fixed in 1% formaldehyde for 1 min at 26°C, followed by quenching with 125 mM glycine and washing with PBS. Nuclei were released by resuspending in TM2+ with NP‐40. MNase digestion was performed in TM2 + IC using 4U MNase (Sigma Aldrich, resuspended in EX50 44) in the presence of CaCl2 for 13 min at 37°C. Reaction was stopped with EGTA, and Triton X‐100, SDS, NaDOC, and NaCl were added to final concentration as in RIPA Buffer. MNase‐digested chromatin was incubated for 1 h at 4°C while slight agitation and chromatin was solubilized by passing ten times through 27‐G needle and centrifuged for 30 min with 15,000 g at 4°C. ChIP was performed from soluble chromatin using H3K36me3 antibody (ab9050, Abcam).
50‐bp single reads were obtained on an Illumina HiSeq sequencer. Reads were mapped to the reference genome (BDGP 5.74) using bowtie2 (2.0.2) with default settings. Peaks were called over corresponding inputs using the Homer Software Package with the parameters “‐style factor” for MSL2 and “‐style histone ‐F 2.5” for H4K16ac. The final set of MSL2 peaks were based on peak calling in at least two out of the four replicates. The single replicate of the H4K16ac regions was compared to previously published profile using the same peak finding software with an overlap of ~90% on the X chromosome 6.
For the comparison of Hi‐C PC1 values to H3K36me3 or H4K16ac, reads were counted at each 10‐kb genomic fragment and were normalized to the total number of reads as well to input and converted to standardized log2 unit, finally averaged over two biological replicates. Otherwise, input‐ and coverage‐normalized tracks for H4K16ac were generated by the Homer Software Package.
RNA‐seq
RNA‐seq was performed on S2‐DRSC and Kc167 cells at least in biological duplicates (GSE94115). In RNAi experiments, the following primers were used for dsRNA PCR template generation:
GFP, MSL2, and SXL (DRSC28896): see under “4C‐seq experimental procedures”; and
SXL from DRSC21490 5:
SXL‐forward: TAATACGACTCACTATAGGGAGAGATCACAGCCGCTGTCC
SXL‐reverse: TAATACGACTCACTATAGGGAGATACCGAATTAAGAGCAAATAATAA
Total RNA was prepared from 4 million cells using RNeasy mini columns (Qiagen), and 2.5 μg of RNA was used for polyA selection. Libraries were prepared using New England Biolabs reagents according to protocols (E7490, E6150, E7525, E6111, E7442, E7335, and 45. 50‐bp single reads were obtained on an Illumina HiSeq sequencer. Alignment was performed using Tophat2 (2.0.5) against the reference genome (BDGP 5.74). Reads were counted at exons and summed for each gene (reference: BDGP5.74.gtf) using the “summarizeOverlaps” function in the Genomic‐Alignments package. Counts were normalized using the “estimateSizeFactors()” function in the DESeq2 package. Gene expression levels were calculated as log2(normalized counts + 1) for all the genes, including genes with zero counts. To estimate genes expression changes between RNAi conditions, the difference of log2(normalized counts + 1) was taken. To test whether there is a difference in gene expression or response to RNAi between subsets of genes, nonparametric, two‐sided Wilcoxon rank‐sum tests were performed.
Author contributions
The 4C‐seq, ChIP‐seq and RNA‐seq experiments with Kc cells were performed by TSc. 4C‐seq was designed and supervised by YG‐H and EEMF. Hi‐C was performed by TSe and supervised by GC. ChIP‐seq on H3K36me3 was carried out by CA. RNA‐seq in S2 cells was performed by CR. Datasets were analyzed and visualized by TSc. The study was conceptualized and supervised by PBB. TSc and PBB wrote the manuscript with contributions from all authors.
Conflict of interest
The authors declare that they have no conflict of interest.
Supporting information
Appendix
Expanded View Figures PDF
Dataset EV1
Dataset EV2
Dataset EV3
Table EV1
Table EV2
Table EV3
Table EV4
Review Process File
Acknowledgements
This work was supported by the European Research Council under the European Union's Seventh Framework Programme (FP7/2007‐2013)/ERC grant agreement no. 293948. We thank S. Krause for technical support. We thank T. Straub for helpful discussions, S. Krebs and H. Blum (LAFUGA at Gene Center, LMU, Munich) and Vladimir Benes (Genomics Core Facility at EMBL, Heidelberg) for outstanding sequencing service. Christian Albig is supported by a DFG fellowship through the Graduate School of Quantitative Biosciences Munich (QBM).
EMBO Reports (2017) 18: 1854–1868
References
- 1. Lucchesi JC, Kuroda MI (2015) Dosage compensation in Drosophila . Cold Spring Harb Perspect Biol 7: a019398 [DOI] [PMC free article] [PubMed] [Google Scholar]
- 2. Keller CI, Akhtar A (2015) The MSL complex: juggling RNA‐protein interactions for dosage compensation and beyond. Curr Opin Genet Dev 31: 1–11 [DOI] [PubMed] [Google Scholar]
- 3. Alekseyenko AA, Peng S, Larschan E, Gorchakov AA, Lee O‐K, Kharchenko P, McGrath SD, Wang CI, Mardis ER, Park PJ et al (2008) A sequence motif within chromatin entry sites directs MSL establishment on the Drosophila X chromosome. Cell 134: 599–609 [DOI] [PMC free article] [PubMed] [Google Scholar]
- 4. Straub T, Grimaud C, Gilfillan GD, Mitterweger A, Becker PB (2008) The chromosomal high‐affinity binding sites for the Drosophila dosage compensation complex. PLoS Genet 4: e1000302 [DOI] [PMC free article] [PubMed] [Google Scholar]
- 5. Alekseyenko AA, Ho JWK, Peng S, Gelbart M, Tolstorukov MY, Plachetka A, Kharchenko PV, Jung YL, Gorchakov AA, Larschan E et al (2012) Sequence‐specific targeting of dosage compensation in Drosophila favors an active chromatin context. PLoS Genet 8: e1002646 [DOI] [PMC free article] [PubMed] [Google Scholar]
- 6. Straub T, Zabel A, Gilfillan GD, Feller C, Becker PB (2013) Different chromatin interfaces of the Drosophila dosage compensation complex revealed by high‐shear ChIP‐seq. Genome Res 23: 473–485 [DOI] [PMC free article] [PubMed] [Google Scholar]
- 7. Ferrari F, Plachetka A, Alekseyenko AA, Jung YL, Ozsolak F, Kharchenko PV, Park PJ, Kuroda MI (2013) ‘Jump Start and Gain’ model for dosage compensation in Drosophila based on direct sequencing of nascent transcripts. Cell Rep 5: 629–636 [DOI] [PMC free article] [PubMed] [Google Scholar]
- 8. Villa R, Schauer T, Smialowski P, Straub T, Becker PB (2016) PionX sites mark the X chromosome for dosage compensation. Nature 537: 244–248 [DOI] [PubMed] [Google Scholar]
- 9. Lieberman‐Aiden E, van Berkum NL, Williams L, Imakaev M, Ragoczy T, Telling A, Amit I, Lajoie BR, Sabo PJ, Dorschner MO et al (2009) Comprehensive mapping of long‐range interactions reveals folding principles of the human genome. Science 326: 289–293 [DOI] [PMC free article] [PubMed] [Google Scholar]
- 10. Dekker J, Marti‐Renom MA, Mirny LA (2013) Exploring the three‐dimensional organization of genomes: interpreting chromatin interaction data. Nat Rev Genet 14: 390–403 [DOI] [PMC free article] [PubMed] [Google Scholar]
- 11. Sexton T, Cavalli G (2015) The role of chromosome domains in shaping the functional genome. Cell 160: 1049–1059 [DOI] [PubMed] [Google Scholar]
- 12. Stevens TJ, Lando D, Basu S, Atkinson LP, Cao Y, Lee SF, Leeb M, Wohlfahrt KJ, Boucher W, O'Shaughnessy‐Kirwan A et al (2017) 3D structures of individual mammalian genomes studied by single‐cell Hi‐C. Nature 589: 2931 [DOI] [PMC free article] [PubMed] [Google Scholar]
- 13. Dixon JR, Jung I, Selvaraj S, Shen Y, Antosiewicz‐Bourget JE, Lee AY, Ye Z, Kim A, Rajagopal N, Xie W et al (2015) Chromatin architecture reorganization during stem cell differentiation. Nature 518: 331–336 [DOI] [PMC free article] [PubMed] [Google Scholar]
- 14. Fortin J‐P, Hansen KD (2015) Reconstructing A/B compartments as revealed by Hi‐C using long‐range correlations in epigenetic data. Genome Biol 16: 289 [DOI] [PMC free article] [PubMed] [Google Scholar]
- 15. Wang S, Su J‐H, Beliveau BJ, Bintu B, Moffitt JR, Wu C‐T, Zhuang X (2016) Spatial organization of chromatin domains and compartments in single chromosomes. Science 353: 598–602 [DOI] [PMC free article] [PubMed] [Google Scholar]
- 16. Nora EP, Lajoie BR, Schulz EG, Giorgetti L, Okamoto I, Servant N, Piolot T, van Berkum NL, Meisig J, Sedat J et al (2012) Spatial partitioning of the regulatory landscape of the X‐inactivation centre. Nature 485: 381–385 [DOI] [PMC free article] [PubMed] [Google Scholar]
- 17. Dixon JR, Selvaraj S, Yue F, Kim A, Li Y, Shen Y, Hu M, Liu JS, Ren B (2012) Topological domains in mammalian genomes identified by analysis of chromatin interactions. Nature 485: 376–380 [DOI] [PMC free article] [PubMed] [Google Scholar]
- 18. Ramírez F, Lingg T, Toscano S, Lam KC, Georgiev P, Chung H‐R, Lajoie BR, de Wit E, Zhan Y, de Laat W et al (2015) High‐affinity sites form an interaction network to facilitate spreading of the MSL complex across the X chromosome in Drosophila . Mol Cell 60: 146–162 [DOI] [PMC free article] [PubMed] [Google Scholar]
- 19. Ulianov SV, Khrameeva EE, Gavrilov AA, Flyamer IM, Kos P, Mikhaleva EA, Penin AA, Logacheva MD, Imakaev MV, Chertovich A et al (2016) Active chromatin and transcription play a key role in chromosome partitioning into topologically associating domains. Genome Res 26: 70–84 [DOI] [PMC free article] [PubMed] [Google Scholar]
- 20. Sexton T, Yaffe E, Kenigsberg E, Bantignies F, Leblanc B, Hoichman M, Parrinello H, Tanay A, Cavalli G (2012) Three‐dimensional folding and functional organization principles of the Drosophila genome. Cell 148: 458–472 [DOI] [PubMed] [Google Scholar]
- 21. Rowley MJ, Corces VG (2016) The three‐dimensional genome: principles and roles of long‐distance interactions. Curr Opin Cell Biol 40: 8–14 [DOI] [PMC free article] [PubMed] [Google Scholar]
- 22. Hug CB, Grimaldi AG, Kruse K, Vaquerizas JM (2017) Chromatin architecture emerges during zygotic genome activation independent of transcription. Cell 169: 216–228.e219 [DOI] [PubMed] [Google Scholar]
- 23. Ghavi‐Helm Y, Klein FA, Pakozdi T, Ciglar L, Noordermeer D, Huber W, Furlong EEM (2014) Enhancer loops appear stable during development and are associated with paused polymerase. Nature 512: 96–100 [DOI] [PubMed] [Google Scholar]
- 24. Lee H, McManus C, Cho D‐Y, Eaton M, Renda F, Somma M, Cherbas L, May G, Powell S, Zhang D et al (2014) DNA copy number evolution in Drosophila cell lines. Genome Biol 15: R70 [DOI] [PMC free article] [PubMed] [Google Scholar]
- 25. Heinz S, Benner C, Spann N, Bertolino E, Lin YC, Laslo P, Cheng JX, Murre C, Singh H, Glass CK (2010) Simple combinations of lineage‐determining transcription factors prime cis‐regulatory elements required for macrophage and B cell identities. Mol Cell 38: 576–589 [DOI] [PMC free article] [PubMed] [Google Scholar]
- 26. Filion GJ, van Bemmel JG, Braunschweig U, Talhout W, Kind J, Ward LD, Brugman W, de Castro IJ, Kerkhoven RM, Bussemaker HJ et al (2010) Systematic protein location mapping reveals five principal chromatin types in Drosophila cells. Cell 143: 212–224 [DOI] [PMC free article] [PubMed] [Google Scholar]
- 27. Prestel M, Feller C, Straub T, Mitlöhner H, Becker PB (2010) The activation potential of MOF is constrained for dosage compensation. Mol Cell 38: 815–826 [DOI] [PubMed] [Google Scholar]
- 28. Feller C, Prestel M, Hartmann H, Straub T, Söding J, Becker PB (2011) The MOF‐containing NSL complex associates globally with housekeeping genes, but activates only a defined subset. Nucleic Acids Res 40: 1509–1522 [DOI] [PMC free article] [PubMed] [Google Scholar]
- 29. Lam KC, Mühlpfordt F, Vaquerizas JM, Raja SJ, Holz H, Luscombe NM, Manke T, Akhtar A (2012) The NSL complex regulates housekeeping genes in Drosophila . PLoS Genet 8: e1002736 [DOI] [PMC free article] [PubMed] [Google Scholar]
- 30. Kind J, Vaquerizas JM, Gebhardt P, Gentzel M, Luscombe NM, Bertone P, Akhtar A (2008) Genome‐wide analysis reveals MOF as a key regulator of dosage compensation and gene expression in Drosophila . Cell 133: 813–828 [DOI] [PubMed] [Google Scholar]
- 31. Larschan E, Alekseyenko AA, Gortchakov AA, Peng S, Li B, Yang P, Workman JL, Park PJ, Kuroda MI (2007) MSL complex is attracted to genes marked by H3K36 trimethylation using a sequence‐independent mechanism. Mol Cell 28: 121–133 [DOI] [PubMed] [Google Scholar]
- 32. Sural TH, Peng S, Li B, Workman JL, Park PJ, Kuroda MI (2008) The MSL3 chromodomain directs a key targeting step for dosage compensation of the Drosophila melanogaster X chromosome. Nat Struct Mol Biol 15: 1318–1325 [DOI] [PMC free article] [PubMed] [Google Scholar]
- 33. Klein FA, Pakozdi T, Anders S, Ghavi‐Helm Y, Furlong EEM, Huber W (2015) FourCSeq: analysis of 4C sequencing data. Bioinformatics 31: 3085–3091 [DOI] [PMC free article] [PubMed] [Google Scholar]
- 34. Corrales‐Berjano M, Rosado Diez A, Cortini R, van Arensbergen J, van Steensel B, Filion GJ (2017) Clustering of Drosophila housekeeping promoters facilitates their expression. Genome Res 27: 1153–1161 [DOI] [PMC free article] [PubMed] [Google Scholar]
- 35. Eagen KP, Hartl TA, Kornberg RD (2015) Stable chromosome condensation revealed by chromosome conformation capture. Cell 163: 934–946 [DOI] [PMC free article] [PubMed] [Google Scholar]
- 36. Gilfillan GD, Straub T, de Wit E, Greil F, Lamm R, van Steensel B, Becker PB (2006) Chromosome‐wide gene‐specific targeting of the Drosophila dosage compensation complex. Genes Dev 20: 858–870 [DOI] [PMC free article] [PubMed] [Google Scholar]
- 37. Quinn JJ, Zhang QC, Georgiev P, Ilik IA, Akhtar A, Chang HY (2016) Rapid evolutionary turnover underlies conserved lncRNA–genome interactions. Genes Dev 30: 191–207 [DOI] [PMC free article] [PubMed] [Google Scholar]
- 38. Grimaud C, Becker PB (2009) The dosage compensation complex shapes the conformation of the X chromosome in Drosophila . Genes Dev 23: 2490–2495 [DOI] [PMC free article] [PubMed] [Google Scholar]
- 39. Hayashi S (2010) Male‐specific GFP marker strain of Drosophila melanogaster. Drosophila Inform Ser 93: 224–225 [Google Scholar]
- 40. Straub T, Neumann MF, Prestel M, Kremmer E, Kaether C, Haass C, Becker PB (2005) Stable chromosomal association of MSL2 defines a dosage‐compensated nuclear compartment. Chromosoma 114: 352–364 [DOI] [PubMed] [Google Scholar]
- 41. Schauer T, Schwalie PC, Handley A, Margulies CE, Flicek P, Ladurner AG (2013) CAST‐ChIP maps cell‐type‐specific chromatin states in the Drosophila central nervous system. Cell Rep 5: 271–282 [DOI] [PMC free article] [PubMed] [Google Scholar]
- 42. Villa R, Forne I, Müller M, Imhof A, Straub T, Becker PB (2012) MSL2 combines sensor and effector functions in homeostatic control of the Drosophila dosage compensation machinery. Mol Cell 48: 647–654 [DOI] [PubMed] [Google Scholar]
- 43. Kasinathan S, Orsi GA, Zentner GE, Ahmad K, Henikoff S (2013) High‐resolution mapping of transcription factor binding sites on native chromatin. Nat Methods 11: 203–209 [DOI] [PMC free article] [PubMed] [Google Scholar]
- 44. Bonte E, Becker PB (1999) Preparation of chromatin assembly extracts from preblastoderm Drosophila embryos. Methods Mol Biol 119: 187–194 [DOI] [PubMed] [Google Scholar]
- 45. Peleg S, Feller C, Forne I, Schiller E, Sévin DC, Schauer T, Regnard C, Straub T, Prestel M, Klima C et al (2016) Life span extension by targeting a link between metabolism and histone acetylation in Drosophila . EMBO Rep 17: 455–469 [DOI] [PMC free article] [PubMed] [Google Scholar]
Associated Data
This section collects any data citations, data availability statements, or supplementary materials included in this article.
Supplementary Materials
Appendix
Expanded View Figures PDF
Dataset EV1
Dataset EV2
Dataset EV3
Table EV1
Table EV2
Table EV3
Table EV4
Review Process File