Abstract
The development of many sporadic cancers is directly initiated by carcinogen exposure. Carcinogens induce malignancies by creating DNA lesions (i.e., adducts) that can result in mutations if left unrepaired. Despite this knowledge, there has been remarkably little investigation into the regulation of susceptibility to acquire DNA lesions. In this study, we present the first quantitative human genome‐wide map of DNA lesions induced by ultraviolet (UV) radiation, the ubiquitous carcinogen in sunlight that causes skin cancer. Remarkably, the pattern of carcinogen susceptibility across the genome of primary cells significantly reflects mutation frequency in malignant melanoma. Surprisingly, DNase‐accessible euchromatin is protected from UV, while lamina‐associated heterochromatin at the nuclear periphery is vulnerable. Many cancer driver genes have an intrinsic increase in carcinogen susceptibility, including the BRAF oncogene that has the highest mutation frequency in melanoma. These findings provide a genome‐wide snapshot of DNA injuries at the earliest stage of carcinogenesis. Furthermore, they identify carcinogen susceptibility as an origin of genome instability that is regulated by nuclear architecture and mirrors mutagenesis in cancer.
Keywords: Cancer, chromatin, lamin, mutagenesis, UV damage
Subject Categories: Cancer; Chromatin, Epigenetics, Genomics & Functional Genomics; DNA Replication, Repair & Recombination
Introduction
Environmental genotoxins are a primary risk factor for several cancers. Indeed, exposure to environmental carcinogens contributes to 75–80% of cancer diagnoses each year (Colditz & Wei, 2012). The most pervasive carcinogen in our natural environment is ultraviolet (UV) radiation in sunlight, which can initiate cancer following prolonged exposure. In particular, melanoma associated with UV exposure has the highest number of somatic mutations per tumor, followed by lung cancer caused by tobacco smoke (Alexandrov et al, 2013; Lawrence et al, 2013). The imprint of these carcinogens can be found in the genetic signature that remains after DNA mutation. For example, recent sequencing of skin cancer cells identified the “solar signature” pattern of mutations (primarily C>T) that strongly links UV exposure and melanoma (Hodis et al, 2012; Alexandrov et al, 2013; Lawrence et al, 2013).
The two major classes of mutagenic DNA lesions induced by UV radiation are cis‐syn‐cyclobutane pyrimidine dimers (CPDs) and 6–4 photoproducts (6–4 PPs). CPDs are by far the most abundant UV‐induced DNA lesion more causal to mutagenesis and malignant transformation (You, 2001; Jans et al, 2005; Brash, 2015). If left unrepaired, cytosines and 5‐methyl‐cytosines within these unstable pyrimidine dimers deaminate to uracil and thymidine, respectively (Ikehata & Ono, 2011). (Deamination of a cytosine within a UV‐induced pyrimidine dimer occurs with a half‐life of between 2 and 100 h versus 30,000 years for an intact cytosine.)
Interestingly, the distribution of these UV‐induced mutations in melanoma is not uniform across the genome. Thus, genomic and epigenomic features surrounding these mutation sites are believed to regulate mutagenesis. For example, in many cancer cells, regions of high mutability are associated with late replication timing and heterochromatin enriched in methylated H3K9 (Stamatoyannopoulos et al, 2009; Schuster‐Böckler & Lehner, 2012; Lawrence et al, 2013; Polak et al, 2015). Proposed reasons for this increase in mutagenesis include deficiencies in repair and/or replication caused by an inability to negotiate heterochromatin, and/or depleted nucleotides occurring at the end of S‐phase, resulting in aberrant DNA structures (Stamatoyannopoulos et al, 2009). In addition, transcriptional activity is strongly inversely correlated with mutation frequency, owing to the activity of transcription‐coupled repair (Bohr et al, 1985; Mellon et al, 1987; Hanawalt & Spivak, 2008; Hu et al, 2015; Adar et al, 2016).
Collectively, current research supports a model whereby inadequate repair and DNA processing are dominant mechanisms of mutagenesis in sporadic cancer. However, several published studies suggest that chromatin and chromatin‐bound factors influence susceptibility to acquire UV‐induced lesions prior to repair. For example, DNA assembled into nucleosomes in vitro displays a distinct pattern of CPD acquisition after UV exposure (Gale et al, 1987). This consists of a 10.3 base periodicity corresponding to positioning of the lesion away from the center of the nucleosomal core, reflecting the curvature of nucleosomal DNA. In Saccharomyces cerevisiae, nucleosomes and DNA‐bound transcription factors influence susceptibility to UV‐induced DNA lesions (Selleck & Majors, 1987; Mao et al, 2016). Susceptibility differences have also been observed among genic features and proximal to repetitive elements in mammalian cells (Zavala et al, 2014). The non‐stochastic distribution of DNA lesions may also influence acquisition of other carcinogen‐induced adducts. For example, cytosine methylation at the p53 gene locus correlates with acquisition of lesions formed by benzo(a)pyrene diolepoxide (BPDE), a potent carcinogen in tobacco smoke (Denissenko et al, 1996, 1997).
However, despite these findings and the unquestionable contribution of carcinogen‐induced mutagenesis to cancer, the relationship between carcinogen susceptibility and mutation heterogeneity has not been previously explored. Indeed, factors that regulate localized genomic carcinogen susceptibility have profound consequences in carcinogenesis by defining probabilities for mutation, thereby causing disparities throughout the genome that can impact genome stability and disease.
In this study, we present the first genome‐wide map of carcinogen‐induced DNA lesions in the human genome and find significant variation in lesion distribution. Specifically, lamin association and chromosomal positioning within the nucleus are features closely associated with carcinogen susceptibility. Remarkably, the pattern of UV‐induced lesions mirrors the mutation frequency in malignant melanoma, demonstrating the dominant influence of carcinogen susceptibility as a source of mutation heterogeneity in cancer genomes. This pattern of carcinogen susceptibility is observed in primary cells following a single exposure to UV light, illustrating intrinsic properties of susceptibility prior to the onset of malignant characteristics. Moreover, highly mutated genes in melanoma, including several cancer driver genes, are particularly susceptible to carcinogen‐induced damage, likely accelerating mutagenesis. Collectively, these results demonstrate that the epigenome architecture regulates carcinogen susceptibility and presents a primary barrier to cancer development.
Results
Carcinogen susceptibility is inversely correlated with genome accessibility
In order to investigate the effects of carcinogen exposure on DNA lesion acquisition, genome‐wide analyses were performed on DNA containing UV‐induced CPDs from primary cells. Figure 1A demonstrates the dose‐dependent accumulation of CPD lesions in response to UV exposure. The 100 J/m2 dose was chosen for subsequent analysis because it is well below the level of genome saturation and estimated to induce one DNA lesion every 534–672 base pairs given previous quantifications of pyrimidine dimer frequency that assume homogenous genome distribution (van Zeeland et al, 1981; Mitchell et al, 1989, 1991).
Figure 1. Whole‐genome mapping of UV‐induced DNA lesions.
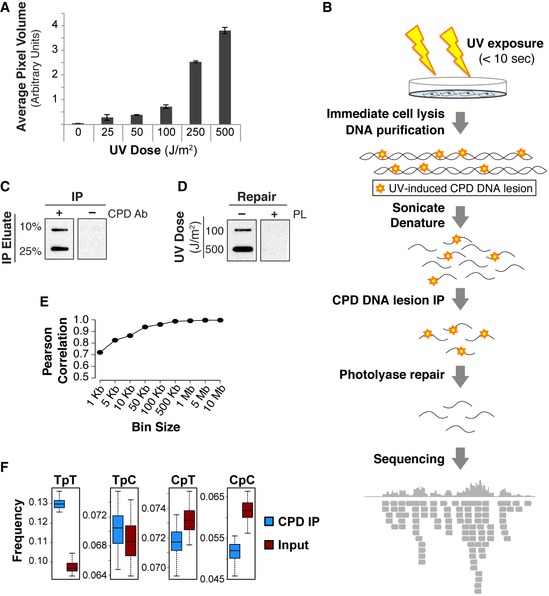
- Average pixel volumes of slot blot analysis using purified DNA from IMR90 cells treated with indicated UVC doses. Standard deviation of three technical replicates is shown.
- Illustration of experimental method. Briefly, IMR90 primary cells were irradiated with 100 J/m2 UVC for <10 s, cells immediately lysed and DNA purified. Cyclobutane pyrimidine dimer (CPD)‐containing fragments were immunoprecipitated (IP'ed) followed by repair of CPDs and 6–4 photoproducts (6–4 PPs) with photolyases. DNA photoproducts were then sequenced via Illumina sequencing.
- Slot blot of eluate from mock IP (−Ab) and CPD‐IP (+Ab) using CPD antibody.
- Slot blot using CPD antibody of mock (−photolyase, PL) and repaired (+PL) IP'ed DNA irradiated with either 100 or 500 J/m2 UVC. Repair efficiency was determined to be greater than 95%.
- Pearson's correlation between sequencing replicates with indicated bin sizes.
- Boxplots indicating frequency of indicated pyrimidine dimers within sequenced reads. Middle quartiles are represented by boxes, top and bottom quartiles are represented by whiskers. IP replicates are merged. Wilcox test indicates that TpT and TpC are statistically enriched (P‐value < 0.0001) in IP versus input.
To map UV‐induced DNA lesions genome‐wide, cells were quickly exposed to UV light, and DNA was immediately harvested. Less than 10 s elapsed from the time of UV exposure to cell lysis with 1% SDS buffer. Repair of CPD lesions is marginally detectable (< 5% of all lesions) within 1 h following UV exposure (Moser et al, 2005; Verbruggen et al, 2014; Adar et al, 2016). Thus, these experiments were designed to assess immediate CPD formation rather than DNA repair kinetics. DNA pyrimidine dimers were then immunoprecipitated and repaired in vitro with >95% repair efficiency before sequencing (Fig 1B–D). Broad domains of UV lesion abundance were observed with consistency between sequencing replicates at multiple bin sizes from 1 kb to over 1 Mb (Fig 1E). Reads were highly enriched in dipyrimidines, with TpT being the most abundant dimer, followed by TpC (Fig 1F). Similar patterns for dipyrimidine formation have been observed in vitro (Douki & Cadet, 2001), which suggests an intrinsic propensity of DNA to form UV‐induced lesions.
Epigenomic features associated with carcinogen susceptibility were then determined by comparing the genome‐wide abundance of UV‐induced lesions with an expansive set of chromatin modifications compiled by the Roadmap Epigenomics Consortium (Roadmap Epigenomics Consortium et al, 2015). The Roadmap Consortium defined distinct chromatin states using a hidden Markov model trained on all epigenomic features available (16 histone modifications, H2AZ, RNA abundance, and DNase hypersensitivity) from 60 epigenomes of different cell types and lineages. These individual chromatin states represent varied DNA‐templated functions, such as active transcription and heterochromatin formation, which are regulated by chromatin and chromatin‐associated factors.
Interestingly, susceptibility to the UV carcinogen is not random across epigenomic features (P→0, Kruskal–Wallis test); rather, it is inversely correlated with accessible, or “open”, euchromatic features (Figs 2 and EV1). Heterochromatin states with repressed transcription are particularly susceptible to UV irradiation (Figs 2A and EV1A). Paradoxically, although these chromatin states are protected from DNase I digestion, they show enhanced vulnerability to UV radiation. These regions are typically gene poor and have an abundance of repetitive elements and repressive H3K9 tri‐methylation (me3). In particular, the constitutively “quiescent” heterochromatin state, enriched in retrotransposon L1 long interspersed nuclear elements (LINEs), accumulates the most UV lesions out of any individual chromatin state in the genome (Fig 2A). Notably, while the frequency of UV‐induced lesions increases proportionally with dipyrimidine content, heterochromatic regions remain more susceptible within regions of similar sequence composition (Figs 2B and EV1B).
Figure 2. Heterochromatin is more susceptible to UV‐induced DNA lesions.
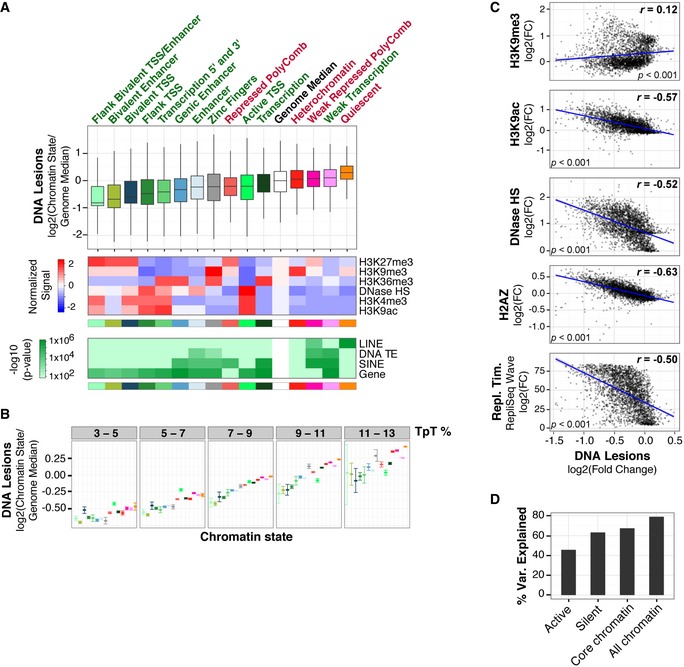
- Top panel: Boxplots of DNA lesion abundance within 15 previously defined chromatin states in IMR90 cells (Roadmap Epigenomics Consortium et al, 2015). Middle quartiles are represented by boxes, top and bottom quartiles are represented by whiskers. Gene‐rich chromatin states are labeled with green text, and gene‐depleted states are labeled with red text. Results are shown as abundance of DNA lesions within individual chromatin states divided by whole‐genome median. Whole‐genome distribution is shown as white box and was determined by pooling DNA lesion abundances from each chromatin state. Statistical outliers are omitted. Flanking and transcriptional start site are abbreviated as Flank and TSS, respectively. Middle panel, mean [log2(fold change/genome fold change average)] of representative histone modifications and DNase I hypersensitivity (HS) for chromatin states. Bottom panel: Enrichment significance of genes and repetitive features, previously defined (ENCODE Project Consortium et al, 2012), within each chromatin state. DNA transposable element, long interspersed nuclear element, and short interspersed nuclear element are abbreviated as TE, LINE, and SINE, respectively. P‐values are based on a hypergeometric distribution (refer to Materials and Methods for details).
- DNA lesion abundance was calculated as in panel (A) after binning by TpT content. Error bars denote the 95% confidence interval of the mean after bootstrapping 1,000 times.
- Fold change (FC) of DNA lesions (IP/input) within 1‐Mb windows compared to histone modification abundance and replication timing (Repl. Tim.) in IMR90 cells previously identified (ENCODE Project Consortium et al, 2012; Roadmap Epigenomics Consortium et al, 2015). Scatter plots with Pearson's correlation (r), linear regression lines (blue), and standard error interval are shown (gray).
- Variance explained from Random Forest Regressions using 10‐fold cross‐correlation is shown for “Active” chromatin (H3K36me3, H3K9ac, H3K4me3, H3K9ac), “Silent” (H3K9me3, H3K9me1, H4K20me1, H3K27me3), “Core Chromatin” (H3K9me3, H3K27me3, H3K4me1, H3K4me3, H3K36me3), and “All Chromatin” (16 histone modifications) (Roadmap Epigenomics Consortium et al, 2015).
Figure EV1. Heterochromatic states are susceptible to the UV carcinogen.
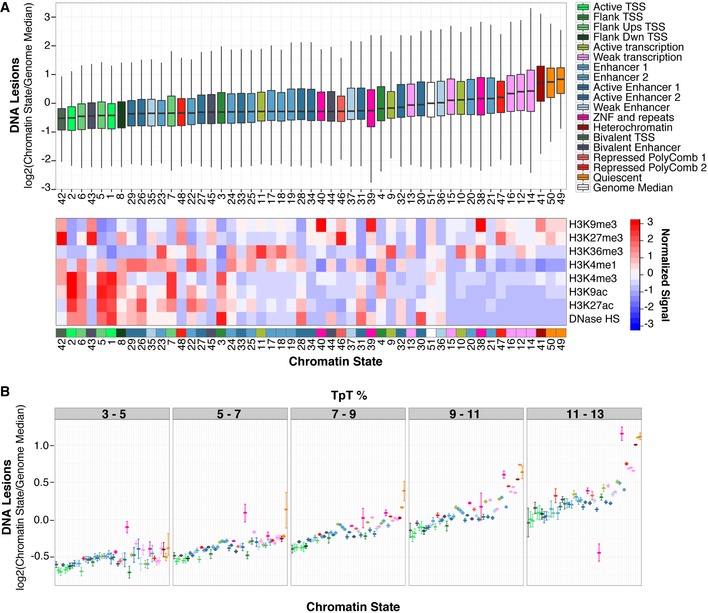
- Same as in Fig 1, except UV lesion abundance was measured within 50 different chromatin states constructed with all IMR90 chromatin marks available in the Roadmap Epigenomics project (Roadmap Epigenomics Consortium et al, 2015). Multiple chromatin states are assigned to individual functional categories. Statistical outliers are omitted.
- UV lesion abundance was calculated as in (A) after binning by TpT content. Error bars denote the 95% confidence interval of the mean based on bootstrapping 1,000 times.
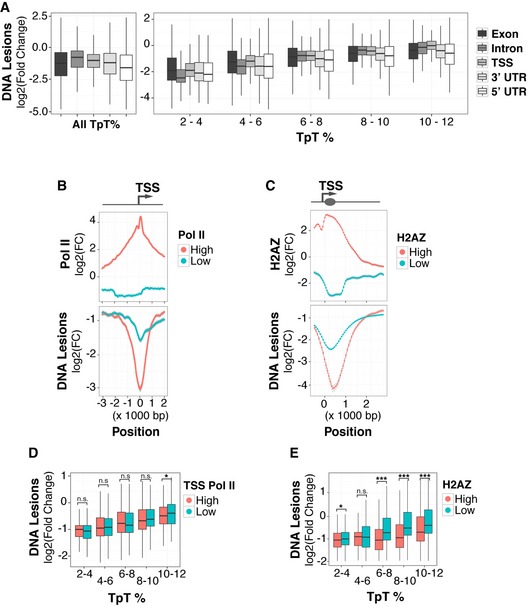
Conversely, gene‐rich regions with active transcription and DNase I hypersensitivity are among the most protected from UV lesion acquisition (Figs 2A and EV1A). These active and poised chromatin states are demarcated by histone modifications including H3K4me3, acetylated H3K9, H3K36me3, and H3K27me3. While these euchromatic states are more protected from UV‐induced lesions than the genome‐wide average, different degrees of protection are observed (Fig EV2). For example, promoter regions upstream of transcriptional start sites (TSSs), with either high RNA polymerase (Pol) II or histone H2AZ variant occupancy, are particularly depleted of lesions (Fig EV2A–C).
Figure EV2. Specific genic features are protected against UV‐induced lesions.
-
AAbundance of UV lesions (IP/input) within genic features of annotated protein‐coding genes binned according to TpT frequency. Transcriptional start site and untranslated region are abbreviated as TSS and UTR, respectively. Middle quartiles are represented by boxes, top and bottom quartiles are represented by whiskers.
-
BUV lesion abundance at TSSs with high (top 10%) and low Pol II occupancy (bottom 10%).
-
CUV lesion abundance at genes with high (top 5%) or low H2AZ occupancy (bottom 5%).
-
D, EUV lesion abundance calculated after binning by TpT content for TSSs (D) and H2AZ‐containing TSSs (E). Mann–Whitney test *P < 0.05, ***P < 0.001, or not significant (n.s.). Outliers are omitted for all boxplots. Middle quartiles are represented by boxes, top and bottom quartiles are represented by whiskers.
The decrease in UV susceptibility at high Pol II‐occupied TSSs is partially due to the frequency of dipyrimidines (Fig EV2D). However, the dramatically reduced susceptibility at H2AZ‐enriched chromatin is independent of DNA sequence and may reflect local protection by a particular chromatin feature (Fig EV2E). Indeed, recent high‐resolution mapping in yeast demonstrates that nucleosomes and chromatin‐bound factors can shield DNA from acquiring UV‐induced lesions (Mao et al, 2016).
Genome‐wide correlations between individual chromatin features and UV lesions further reveal significant differences between euchromatic and heterochromatic histone modifications. Substantially negative correlations are found with H2AZ (r = −0.63), acetylated H3K9 (r = −0.57), H3K4 methylation (r = −0.47), and DNA accessibility (r = −0.52) (Figs 2C and EV3). In addition, genomic regions enriched in other euchromatin and enhancer histone modifications are depleted in UV lesions and include the following: acetylated H3K4, H3K23, H3K27, and H2AK9; H3K36me3; H4K20me1; and H3K79me1,2,3 (Fig EV3). Regions with H3K56 acetylation, which is associated with genome stability during replication (Masumoto et al, 2005), have the weakest correlation of all histone marks investigated (r = 0.08). A negative correlation is also observed with replication timing (r = −0.50), which is known to be influenced by chromatin structure (Bell et al, 2010; Hansen et al, 2010) (Fig 2C). In addition, a modest, yet statistically significant positive correlation is observed with the H3K9me3 heterochromatic mark (r = 0.12).
Figure EV3. UV susceptibility negatively correlates with replication timing and euchromatic histone modifications.
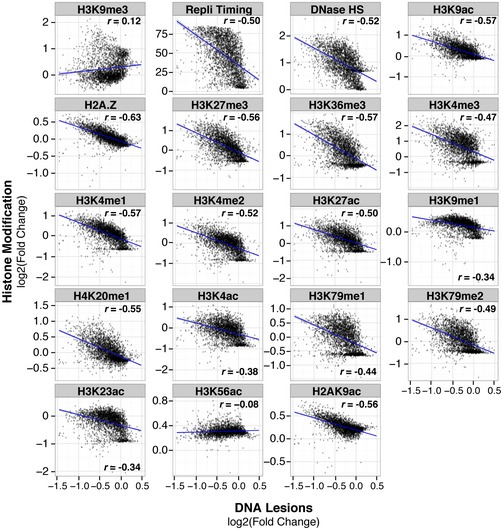
DNA lesions abundance (IP/input) quantified within 1‐Mb windows compared to abundance of histone modifications previously identified (Roadmap Epigenomics Consortium et al, 2015). Pearson's correlation is shown, and linear regression line (blue) with its associated standard deviation (gray) was fitted to the data. P < 0.001 for all graphs.
To examine the ability of epigenomic features to predict susceptibility to UV‐induced lesions, a Random Forest Regression was trained on ChIP‐seq of 16 histone posttranslational modifications, H2AZ, and DNA accessibility (Roadmap Epigenomics Consortium et al, 2015). A 10‐fold cross‐validation model reveals that collective epigenomic features predict 79% of carcinogen susceptibility (Fig 2D). Indeed, “active” transcription chromatin modifications explain 45% of the susceptibility, while “silent” chromatin modifications explain 63% of the susceptibility. Remarkably, 67% of UV susceptibility is explained in IMR90 cells when using the “core” set of only five histone modifications mapped across 127 different epigenomes (H3K4me3, H3K4me1, H3K36me3, H3K27me3, H3K9me3) (Roadmap Epigenomics Consortium et al, 2015), Thus, UV susceptibility is largely driven by just a few epigenomic features and can be predicted in different cell types where these histone modification ChIP datasets are available.
LINE‐rich lamina‐associated domains (LADs) at the nuclear periphery show increased carcinogen susceptibility
As mentioned, while euchromatic features substantially demarcate UV‐protected regions of the genome, the only investigated epigenomic feature that has a genome‐wide positive correlation with UV‐induced damage is the heterochromatic H3K9me3 modification (Fig 2C). In order to identify other factors positively associated with susceptibility, heterochromatin‐associated proteins were also investigated.
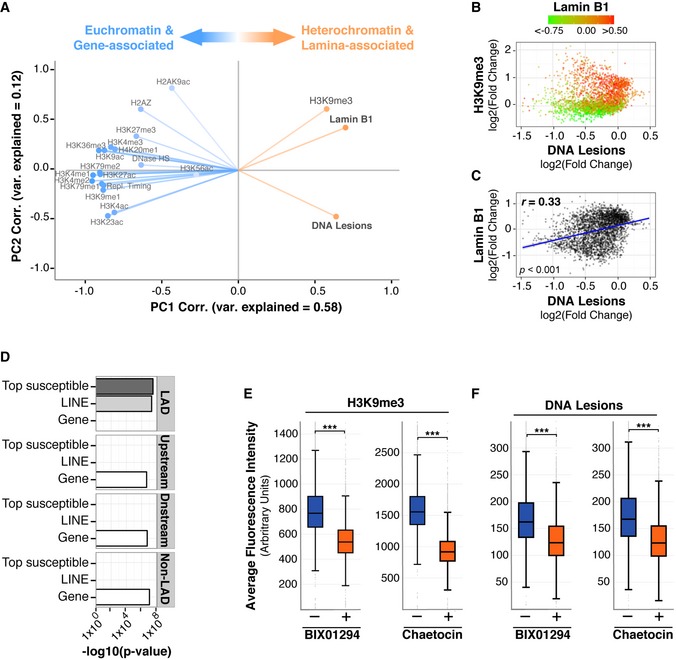
One such heterochromatin‐associated protein is lamin B1, a component of the nuclear lamina. Lamin B1 interacts with chromatin in lamina‐associated domains (LADs), which are enriched in H3K9me3 and play critical roles in genome organization and structure (Amendola & van Steensel, 2014). Principal component analysis (PCA), a statistical method that explains variation in complex datasets, was performed on all available Roadmap Consortium chromatin features as well as lamin B1. As shown in Figs 3A and EV4A, PC1 explains a majority of the variance (58%) and confirms that UV lesions do not segregate with gene‐related and euchromatic features but are more associated with H3K9me3. Notably, of all examined features, lamin B1 has the closest association with UV lesions (Fig 3A).
Figure 3. UV susceptibility is elevated in lamin‐associated chromatin.
-
APrincipal component analysis. Correlation of abundance for indicated features to principal component (PC) 1 and PC2 values across the entire genome. Degree of variance (var) explained is indicated within each PC.
- B
-
CScatter plot comparing lamin B1 association (Guelen et al, 2008) and DNA lesion abundance (IP/input) at 1 Mb resolution.
-
DEnrichment significance (−log 10 (P‐value hypergeometric test)) for the overlap in bps of the indicated genomic features and LADs, 100‐kb upstream, 100‐kb downstream, and a non‐LAD random control. “Top susceptible” are genomic regions with the top 5% of UV lesion abundance using 1 Mb windows.
-
E, FIMR90 primary cells were treated with Chaetocin or BIX01294 for 72 h. Cells were irradiated with 100 J/m2 UVC for <10 s and immediately fixed and stained using antibodies against H3K9me3 (E) or CPD lesions (F). Box plots of average fluorescence intensity determined by FACS analysis are shown. Middle quartiles are represented by boxes, top and bottom quartiles are represented by whiskers. Minimum of 20,000 cells were used for each sample. Chi‐square test is ***P < 0.0001 for each plot.
Figure EV4. UV susceptibility is correlated with heterochromatin and lamin B1 and is not sequence‐dependent.
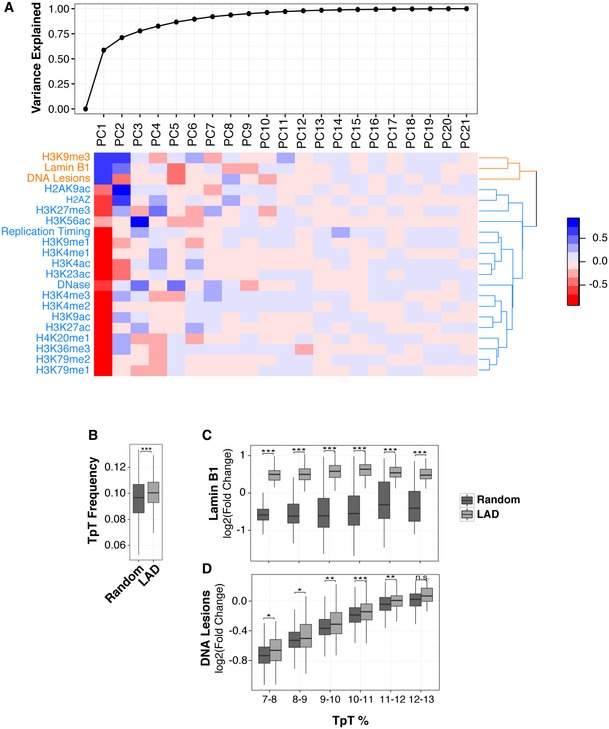
- Principal component analysis was performed with the indicated features at a 1‐Mb scale (refer to Materials and Methods for more details). Top, cumulative variance explained by all principal components (PCs). Bottom, the correlation heatmap is shown. Rows in heatmap were reordered based on a hierarchical clustering using Euclidean distance.
- The TpT content of LADs and randomly selected regions of equal size.
- Lamin B1 abundance distribution in LADs and a random control after binning based on TpT dinucleotide content.
- DNA lesion signal distribution (IP/input) in same groups as in (B). Random control was generated by arbitrarily sampling non‐LAD regions of the genome of the same number, size, and chromosomal distribution of LADs.
The correlation between UV lesions and H3K9me3 was then re‐analyzed to illustrate levels of lamin B1 (Fig 3B). As expected, lamin B1 is enriched within many genomic loci that also contain H3K9me3. Furthermore, the correlation of DNA lesions with lamin B1 (r = 0.33) is stronger than with methylated H3K9 (r = 0.12) (Figs 3C and 2C). The top 5% of all UV susceptible regions and LINEs are significantly enriched within LADs, as opposed to regions outside of LADs, or a non‐LAD random control (Fig 3D). Notably, the increased UV susceptibility observed in LADs is not dependent on dipyrimidine frequency (Fig EV4B–D). Cells were then treated with methyltransferase inhibitors for H3K9me3 (Chaetocin, a Suvar3–9 inhibitor) and H3K9me2 (BIX01294, a G9a methyltransferase inhibitor). These inhibitors alter the formation of LADs (Greiner et al, 2005; Kubicek et al, 2007; Illner et al, 2010; Kind et al, 2013) and, as expected, result in decreased H3K9me3 levels (Fig 3E). Strikingly, both inhibitors also lead to a dramatic reduction in the accumulation of UV lesions (Fig 3F). These results indicate that lamin‐associated heterochromatin plays a causal role in carcinogen susceptibility.
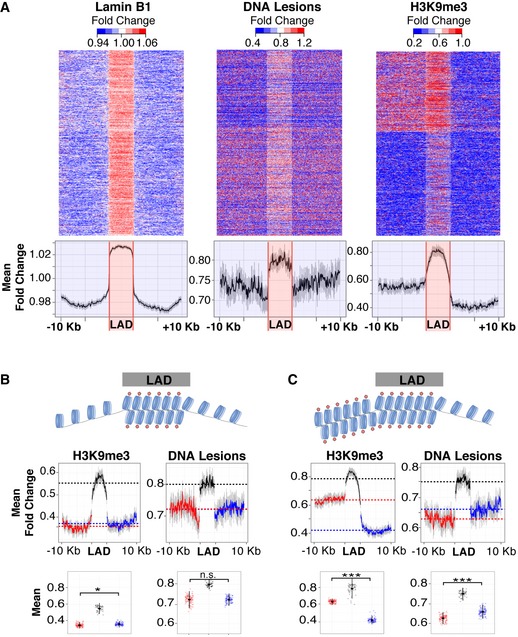
In order to compare the distribution profiles of lamin B1, H3K9 methylation, and UV lesions, enrichment heatmaps were produced for all 1,344 LADs aligned with 100 kb of flanking sequence (Guelen et al, 2008). As shown in Fig 4A, DNA lesions are abundant in LADs compared to flanking regions. H3K9me3 is also predominantly enriched within LADs; however, flanking regions have disparate abundances. Thus, further analysis was performed to assess whether lamina association or H3K9 methylation per se correlates better with UV lesion susceptibility. Specifically, UV lesion abundance was compared in LADs with relatively low levels of H3K9 methylation in both flanking regions (Fig 4B) or enriched H3K9 in just one flanking region (Fig 4C). No significant increase was observed in the flanking region with more H3K9 methylation. Rather, we observed a decrease, suggesting that LAD proximal regions with relative high H3K9me3 accumulate less DNA lesions compared to low H3K9me3 regions (Fig 4C). Collectively, these results demonstrate that, compared to H3K9 methylation, nuclear localization and lamin association are dominant features associated with susceptibility to UV damage.
Figure 4. Lamin association, versus H3K9 methylation, is a dominant feature of carcinogen susceptibility.
-
AHeatmaps of 1,344 individual LADs (top), previously determined (Guelen et al, 2008), and average traces (bottom) of lamin B1 association (left), UV lesions (center), and H3K9me3 (right). UV lesions, quantified by measuring fold change of IP/input, are significantly enriched in LADs compared to flanking regions (1.05‐fold change, s.e.m. 0.00007, paired t‐test P‐value→0). LADs are ordered according to H3K9me3 abundance, irrespective of 5′ to 3′ orientation. Signal in neighboring regions was calculated using 1‐kb non‐overlapping windows. Signal in LADs of variable size was calculated in 50 windows. Heatmap represents the range of values from the 10th to the 90th percentile.
-
B, CLADs with low H3K9me3 in flanking regions (B), and LADs with high H3K9me3 in one flanking region (C). Average traces (middle) and jitter plots (bottom) with mean values of H3K9me3 (left) and UV lesion signal (right). Welch two sample t‐test: n.s. = not significant, *P < 0.01, ***P < 0.0001. Error bars in average traces and jitter plots represent the 95% confidence interval of the mean after bootstrapping 1,000 times.
Previous studies demonstrate that lamin B1 is positively correlated with intranuclear radial position of chromosomes (r = 0.57), and chromosomes at the nuclear periphery are enriched in lamin B1 association (Guelen et al, 2008). Given the prevalence of UV lesions in lamin B1 LADs, we investigated carcinogen susceptibility on chromosomes with variable spatial positioning within the nucleus. The abundance of UV lesions was first examined on individual chromosomes with different radial positions relative to the nuclear center, previously determined by in situ three‐dimensional fluorescence microscopy (Bolzer et al, 2005). Notably, a significant positive correlation was observed between chromosome radial position and mean UV lesion abundance (Fig 5A, r = 0.62).
Figure 5. Chromosomes at the nuclear periphery are more susceptible to the UV carcinogen.
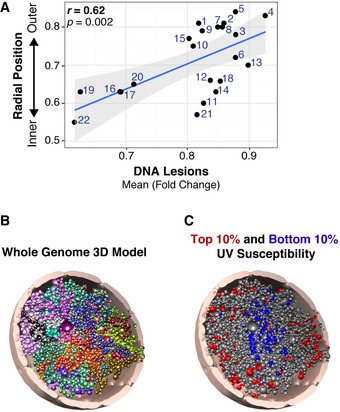
- Chromosomal mean UV lesion abundance (IP/input) compared to mean radial position of each chromosome previously determined (Bolzer et al, 2005). Regression lines (blue) and standard error interval are shown (gray).
- Optimized Chrom3D model of the IMR90 primary human fibroblast genome. Each bead represents a TAD, and each chromosome is distinctively colored within a nucleus diameter of 10 μm.
- Tomographic view of the model in (B), showing the top 10% (red) and bottom 10% (blue) log2(fold change (FC)) enrichment of UV lesions.
Source data are available online for this figure.
UV susceptibility throughout the nucleus was then examined using three‐dimensional (3D) computational genome modeling. Chrom3D incorporates LAD positioning and Chromosome Conformation Capture (Hi‐C) to create a 3D model that recapitulates spatial positioning of topologically associated domains (TADs) in the nucleus (Paulsen et al, 2017). TADs form throughout the genome via chromosome “looping” that brings distal genomic loci along linear chromosomes within close physical proximity (Rao et al, 2014). Chrom3D was used to create a whole‐genome model of individual TADs in IMR90 fibroblasts (Fig 5B and Movie EV1). This model was then utilized to reveal the radial position of the top and bottom 10% of UV susceptible regions (Fig 5C and Movie EV2). These models show that carcinogen susceptibility is elevated within TADs placed at the nuclear periphery and reduced in the nuclear interior. Collectively, these results illustrate the dramatic differences in carcinogen susceptibility that correspond to chromosomal radial nuclear position.
Carcinogen susceptibility mirrors mutation frequency in melanoma
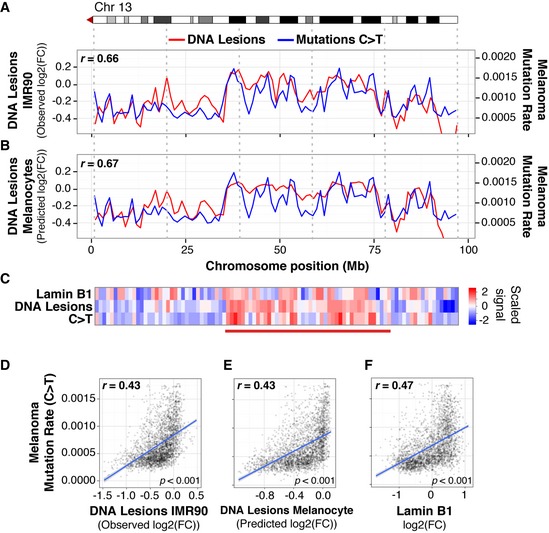
Methylated H3K9 and replication timing have been associated with increased mutation frequency in several cancers, including melanoma (Schuster‐Böckler & Lehner, 2012; Lawrence et al, 2013; Sima & Gilbert, 2014; Polak et al, 2015). The overwhelming majority of these mutations harbor the C>T “solar signature” associated with UV‐induced lesions (Hodis et al, 2012; Alexandrov et al, 2013). These mutations evolve from a combination of carcinogen susceptibility, repair deficiency, and positive selection. In order to address the specific contribution of UV susceptibility to cancer mutagenesis, nucleotide variation in melanoma was compared to the distribution of UV‐induced DNA lesions. Figure 6A–C demonstrates a strong positive correlation between accumulation of DNA lesions and C>T mutations along chromosome 13 in malignant melanomas. Moreover, this correlation is found with both observed UV lesions in IMR90 fibroblasts (Fig 6A, r = 0.66) and predicted UV lesions in precursor melanocytes (Fig 6B, r = 0.67), when using a regression model with the previously described “core” histone modifications that explain a majority of variance in UV lesion distribution (Fig 2D).
Figure 6. UV lesion distribution in primary cells mirrors mutation rates in malignant melanoma.
-
A, BUV lesion abundance (red) and C>T mutation frequency (blue) in malignant melanoma along the right arm of chromosome 13 at a 1‐Mb scale. UV lesions are quantified by measuring fold change (FC) of IP/input. Observed UV lesion abundance in IMR90 cells (A) and predicted UV lesion abundance in melanocytes, obtained by a Random Forest Regression using melanocyte chromatin marks (described in Fig 2D) and DNase I hypersensitivity as predictor variables (B).
-
CHeatmap showing scaled signal (refer to Materials and Methods) of UV lesion, lamin B1, and C>T mutations along right arm of chromosome 13 at a 1‐Mb scale.
-
D–FGenome‐wide mutation frequency in melanoma compared to UV lesion abundance (D); predicted UV lesion abundance in melanocytes (E); and lamin B1 association (F). Y‐axes are truncated at the 99th percentile.
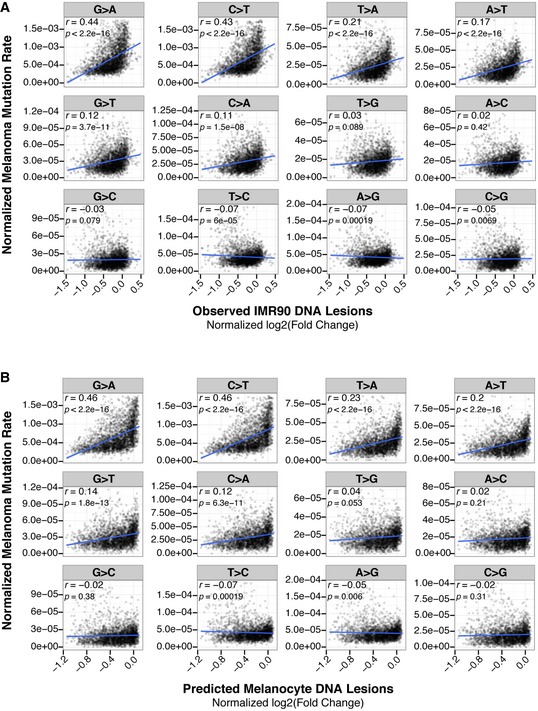
Furthermore, in broad chromosomal regions with increased C>T mutations, enrichments of both DNA lesions and lamin B1 are also observed (Fig 6C). Genome‐wide abundance of UV lesions is positively correlated with C>T mutations in melanoma, for both observed lesions in IMR90 cells (r = 0.43; Fig 6D) and predicted lesions in melanocytes (r = 0.43; Fig 6E). A similar positive correlation is also observed between lamin B1 enrichment and C>T mutation frequency in melanomas (r = 0.47, Fig 6F). As expected, mutations that are not initiated by UV exposure are both less abundant in melanoma and less correlated with UV‐induced DNA lesions (Fig EV5). Collectively, these results suggest that the origin of mutational heterogeneity in melanoma genomes is significantly contributed by the intrinsic properties of carcinogen susceptibility, which is regulated by epigenome architecture.
Figure EV5. Correlation between UV‐induced DNA lesions and mutation frequency in melanoma.
-
A, BGenome‐wide mutation frequency in melanoma compared to UV lesion abundance (IP/input) observed in IMR90 cells (A), and predicted in melanocytes (B). Y‐axes are truncated at the 99th percentile.
Cancer driver genes have elevated carcinogen susceptibility
Whole‐genome and exome cancer sequencing studies reveal that specific genes tend to be recurrently mutated across samples from different individuals, suggesting conserved genetic alterations that aid in malignant transformation. To specifically assess the contribution of carcinogen susceptibility to mutagenesis of cancer‐related genes, the abundance of UV lesions was quantified on frequently mutated genes from over 11,000 different melanoma samples (Forbes et al, 2015). Figure 7A shows that as mutation frequency of individual genes increases within the melanoma samples, so does abundance of UV lesions in primary cells, compared to a random control. Conversely, genes with no identified mutation in melanoma samples accumulate significantly less lesions.
Figure 7. Genes frequently mutated in melanoma have increased UV susceptibility.
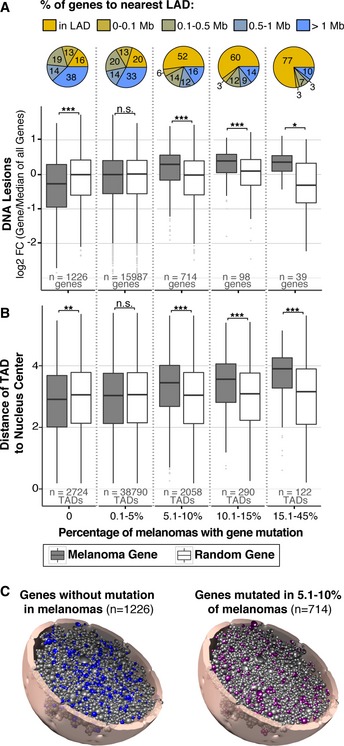
- Abundance of UV‐induced DNA lesions on all genes (Melanoma Gene, gray boxes) binned by the frequency of mutation in melanoma samples, available from the cancer browser in the COSMIC database (Forbes et al, 2015). n = number of genes per bin. Abundance is measured as fold change (FC) of binned genes/median of all genes in genome. Controls (Random Genes, white boxes) for each bin contain a random selection of the same number of genes as their corresponding bin. Percentage of genes with designated lamin‐associated domain (LAD) proximity is shown within each bin.
- For genes in (A), distance from center of nucleus was predicted using the Chrom3D model described in Fig 5B. TAD number exceeds gene number because each gene is assigned to two or more TADs due to copy number and genes that span multiple TADs.
- Tomographic view of data shown in (B) showing the 3D location of genes that are not mutated (0%) in melanoma (left model) and genes mutated in 5.1–10% of melanomas (right model). The 5.1–10% model was chosen among others because the number of genes provides a comparative graphical representation to the 0% model.
Lamin‐associated domain enrichment analysis reveals that 77% of genes with the highest mutation frequency (>15%) in melanoma samples are partially or wholly positioned within a LAD (Fig 7A). These results demonstrate that elevated mutation frequency and carcinogen susceptibility are closely linked with lamin association. Furthermore, the radial position of TADs containing these genes was predicted using the Chrom3D model described in Fig 5B and reveals that as distance from the center of the nucleus increases, so does mutation frequency (Fig 7B). Again, genes not mutated in melanoma are more significantly positioned toward the center of the nucleus than random control genes. A 3D genome model of the distribution of non‐mutated genes and mutated genes is shown in Fig 7C (and [Link], [Link]).
Further analysis was then restricted to previously characterized cancer driver genes that have been causally implicated in cancer development (Gonzalez‐Perez et al, 2013). Remarkably, the vast majority of cancer driver genes show higher UV susceptibility than the genome average (Fig 8A). In particular, tumor suppressors are significantly more susceptible, with 88% of tumor suppressor genes above the genome average (Binomial test P‐value = 1.9 × 10⁻⁶). ATRX, PTEN, and ARID2 are the most susceptible tumor suppressors and are mutated in approximately 4, 9, and 10% of melanomas, respectively. Notably, the oncogene with the highest UV susceptibility is BRAF, the most frequently mutated driver gene in melanoma (>60%), and a gene with universally recognized contributions to malignancy. BRAF and many other cancer driver genes are located within (or proximal to) a LAD, further demonstrating the impact of nuclear positioning in carcinogen susceptibility (Figs 8A and B, and Movie EV5). Collectively, these results highlight the contribution of lamin association and chromosomal position to cancer development.
Figure 8. Cancer driver genes have increased UV susceptibility.
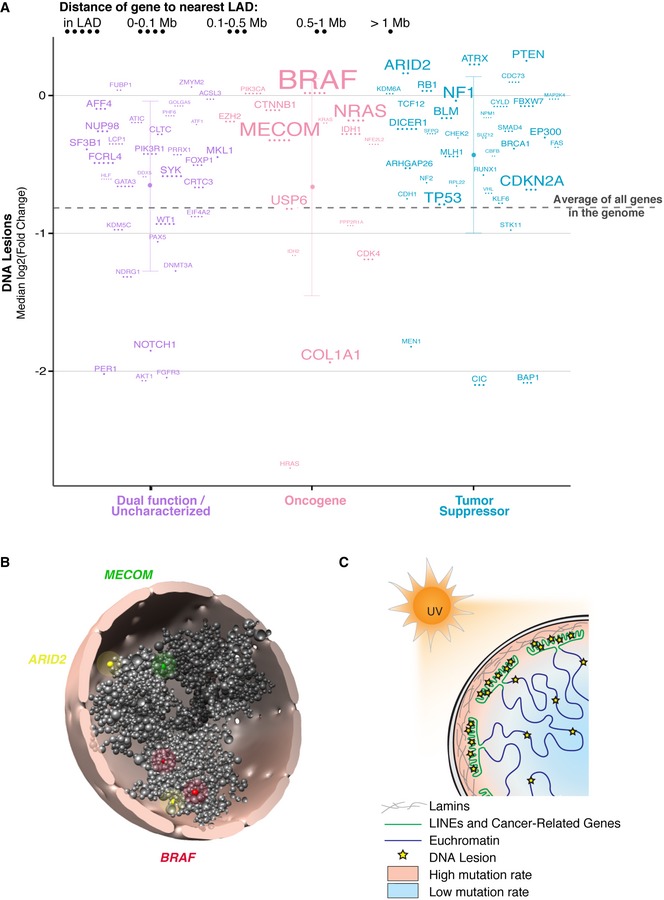
- Median UV‐induced DNA lesion abundance for previously identified melanoma cancer driver genes (Gonzalez‐Perez et al, 2013) separated by activating (oncogene), loss of function (tumor suppressor), or uncharacterized mutation (Schroeder et al, 2014). Mean abundance with standard deviation for each group is shown. Dashed horizontal line is the mean signal for all genes in the genome. Gene names are scaled by mutation frequency (i.e., the percentage of tumors that have a mutated copy of that gene) in melanoma samples.
- Tomographic view of Chrom3D model described in Fig 5B. Shown are selected TADs containing genes (BRAF in red, MECOM in yellow, ARID2 in green) that are highly mutated in melanoma. Areas around beads are highlighted to aid visualization.
- Model for carcinogen susceptibility in primary cells. Chromatin and spatial genome organization within the nucleus define the landscape of carcinogen susceptibility in primary cells.
Source data are available online for this figure.
Discussion
As previously reported, mutation heterogeneity across the genome of advanced cancers, including malignant melanoma, is largely correlated with heterochromatin features of the primary cell of origin rather than cancer cells (Polak et al, 2015). Furthermore, non‐malignant somatic cells from sun‐exposed tissue have the capacity to harbor a mutational burden similar to many cancers (Martincorena et al, 2015). Collectively, these studies suggest that the genome of premalignant cells can accumulate a vast number of mutations before exhibiting any malignant phenotypes. Our results demonstrate that this heterogeneous mutational spectrum is largely predetermined by intrinsic carcinogen susceptibility, which itself is determined by genome architecture (Fig 8C).
The reason why heterochromatic LADs are more prone to acquire lesions is not entirely known and may involve several factors. One possibility is that the physical conformation of DNA within LADs is more amenable to the structural changes caused by UV‐induced pyrimidine dimers (Gale et al, 1987; Gale & Smerdon, 1988; Pehrson & Cohen, 1992). Alternatively, a “bodyguard hypothesis” has previously been proposed (Hsu, 1975), whereby chromatin at the nuclear periphery absorbs genetic injuries from exogenous sources to “shield” the nuclear interior. In this scenario, lamin‐associated heterochromatic repetitive elements would protect essential euchromatic and gene‐rich regions by absorbing the damaging effects of UV radiation.
As shown in this report, repetitive LINE retrotransposons are particularly susceptible to UV‐induced lesions. LINEs began expanding in the primate genome 40 million years ago and currently constitute one‐fifth to one‐third of the human genome (Cordaux & Batzer, 2009). If the genetic accuracy of these elements is dispensable, they could serve as a sink for DNA lesions induced by UV light, an ancient carcinogen. This would help preserve the fidelity of genes required for cell viability and may conserve valuable repair resources that are not needed for the correction of non‐essential repetitive elements. Indeed, evolutionary comparisons of neutral DNA sequences have found higher mutation rates in heterochromatin compared to euchromatin (Prendergast et al, 2007), demonstrating that damage in heterochromatin can be maintained during evolution without significant detriment to survival.
Furthermore, as previously introduced, several studies have shown that heterochromatin is more refractory to UV‐induced repair than euchromatin (Bohr et al, 1985; Mellon et al, 1987; Hanawalt & Spivak, 2008; Hu et al, 2015; Adar et al, 2016). In order to compare genomic sites that accumulate UV‐induced lesions with repair efficiency, results from this study were correlated with those of another study that monitored nucleotide excision repair after UV exposure (Hu et al, 2015; Adar et al, 2016). Figure EV6 reveals a negative correlation between UV lesion abundance and detection of repair genome‐wide, confirming repair deficiencies in heterochromatin. These results suggest that the high mutation rate observed in heterochromatin is not only due to a decrease in repair efficiency but also to an increase in lesion accumulation in these regions, thus revealing carcinogen susceptibility as a new source that contributes to mutational heterogeneity observed in cancer. Collectively, these studies further support the notion that the biological utility of heterochromatin is not entirely dependent on conservation of DNA sequence, yet may be involved in the maintenance of the euchromatic genome by limiting carcinogen susceptibility and consequent mutation.
Figure EV6. UV susceptible regions of the genome have less efficient excision repair.
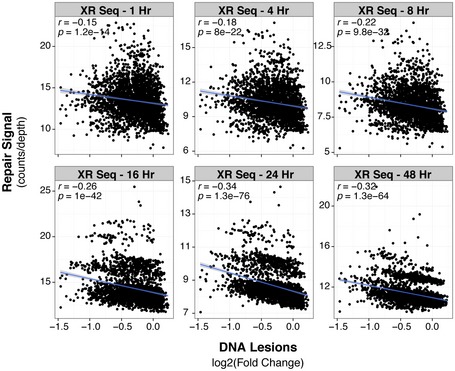
Comparison across all 1‐Mb windows of the genome between DNA lesions (fold change of IP/input) and excision repair rates measured by XR‐seq at indicated time points (Adar et al, 2016). Pearson correlation (r) and its associated P‐value (P) are shown.
Surprisingly, we find that although genic regions are generally protected from carcinogenic insult, the vast majority of cancer driver genes lack substantial protection. Indeed, increased carcinogen susceptibility is likely a fundamental feature that predisposes cancer driver genes to mutation. Furthermore, the evolution of a cancer cell may involve mechanisms to increase carcinogen susceptibility, thereby accelerating mutagenesis, of cancer driver genes. It is also intriguing to speculate that distinct genome architectures among diverse tissues render different cancer driver genes susceptible, thus contributing to variability in mutational spectra across cancers. Additional research will need to be performed to test these possibilities.
Collectively, results from this study demonstrate that epigenome architecture in non‐malignant cells presents a primary barrier to cancer development by regulating susceptibility to carcinogens. Future research may reveal therapeutic strategies to reduce carcinogen susceptibility, thus delaying or preventing the initiation of tumorigenesis.
Materials and Methods
Cell treatment
IMR90 primary fibroblasts were irradiated with 100 J/m2 UVC followed by immediate (< 10 s) cell lysis with 1% SDS buffer. DNA was purified using RNase A and proteinase K treatment, followed by phenol/chloroform and ethanol/sodium acetate precipitation. For immunoprecipitation, purified sonicated single‐strand DNA was incubated with anti‐CPD antibody (Cosmos Bio, clone TDM‐2) and repaired via photolyases (Selby & Sancar, 2012) as previously described (Zavala et al, 2014). For slot blot analysis, 30 ng purified single‐strand DNA was used for each well. Blot was incubated with anti‐CPD antibody (Cosmos Bio, clone TDM‐2), and non‐saturating pixels were quantified using Bio‐Rad XR gel imager with Quantity One software.
IMR‐90 cells were treated with vehicle, 2.5 nM Chaetocin (Sigma), or 1 μM BIX01294 (AdipoGen) for 72 h. Cells were then treated with 100 J/m2 UVC, and fixed and permeabilized before analysis on a Becton Dickson LSRII flow cytometer using antibodies directed against either H3K9me3 (Abcam, cat. no. 8898) or CPD (Cosmos Bio, clone TDM‐2). Single cells were gated, and fluorescent intensity values were analyzed.
Sequence processing
Following photolyase repair, libraries were prepped for Illumina sequencing using second‐strand DNA synthesis, end repair, and adapter ligation with NEBNext Directional Second‐Strand Synthesis (cat. no. E7550), and ChIP‐seq Library Prep Master Mix for Illumina (cat. no. E6240) kits. Libraries were sequenced on an Illumina HiSeq platform, yielding 176 M single‐end, 101‐bp reads. Library quality passed FastQC parameters (Andrews, 2010). Strand correlation analysis also indicated a quality library with highly enriched sequences (RSC>1). All data processing was conducted in accordance with the ENCODE (phase‐3) specifications (ENCODE Project Consortium et al, 2012) for ChIP‐seq, using the AQUAS Transcription Factor and Histone ChIP‐Seq processing pipeline (Zhang et al, 2008). As such, the CPD‐IP/input signal tracks are amenable to comparison with existing Roadmap Epigenomics data (Roadmap Epigenomics Consortium et al, 2015).
Briefly, reads were mapped to the Human Genome version 19 (hg19) using BWA, filtered and de‐duplicated, converted to ENCODE tagAlign, subsampled to a maximum depth of 30 million, and input into MACS2.0 to generate signal tracks. Mean fold change values were then obtained for all non‐overlapping windows in the genome at different size resolutions, and Pearson correlations were computed for each pair of replicates. Processed replicates were merged to produce final DNA lesion abundance (CPD‐IP/input). Sequencing data are available under accession number GSE94434.
Epigenome analysis
Chromatin states were defined as part of the Roadmap Epigenomics Consortium project (Roadmap Epigenomics Consortium et al, 2015) using a hidden Markov model [ChromHMM (Ernst & Kellis, 2012)] trained with all chromatin features compiled for 60 high‐quality epigenomes representing different cell types and lineages. Chromatin features include DNase I hypersensitivity, H2AZ, RNA abundance, DNA methylation, and 16 histone modifications. “Core” chromatin features were compiled for 127 different epigenomes and include H3K4me3, H3K4me1, H3K36me3, H3K27me3, and H3K9me3. State coordinates for IMR90 cells were downloaded from the server of the project (http://egg2.wustl.edu/roadmap/web_portal/). Bin sizes are variable for each state and were determined by the Roadmap Epigenomics Consortium project (Roadmap Epigenomics Consortium et al, 2015). Whole‐genome quantification was determined by pooling DNA lesion abundances from each chromatin state. Fold change (IP/input) signal tracks were downloaded from the Roadmap Epigenomics project for IMR90 cells (E017) and foreskin melanocytes (E059) (Roadmap Epigenomics Consortium et al, 2015). Features available for IMR90 include DNase I hypersensitivity, H2A.Z, and 16 histone marks. Melanocyte features include DNase I hypersensitivity and six histone marks. For the heatmap of histone modification abundance, log2 (median histone IP/input) was normalized by whole‐genome median abundance.
Principal component analysis
Median signal was calculated for features using 1 Mb windows across the entire genome. Log2 fold change (IP/input) was used for all chromatin marks, DNA lesions, and lamin B1. Wavelet‐smoothed signal was used for replication timing. PCA was performed in R using the prcomp function, with center = TRUE and scale = TRUE. In order to assess the contribution of each principal component, their values for all windows were correlated back to the corresponding feature values.
Genomic analysis
Genic features are annotated in ENCODE for the Hg19 reference genome (ENCODE Project Consortium et al, 2012). Annotated genes were restricted to ones with coding sequence associated with their identifier. IMR90 replication timing wavelet‐smoothed signal and its corresponding input were downloaded from ENCODE (ENCODE Project Consortium et al, 2012).
Repeat coordinates for the Hg19 genome identified with repeatMasker v.4.0.5 were downloaded from http://www.repeatmasker.org/species/hg.html. Enrichment of two defined genomic sets was achieved using a hypergeometric distribution, where the overlap between two sets was defined as the number of base pairs shared by the members of the sets and the background as the genome size of 2.7 × 10⁹. The probability of observing the overlap given the background reflects the probability of observing an overlap greater or equal by chance.
Lamin analysis
Lamin B1 signal (log2 lamin B1 binding ratio) and LADs were originally characterized in Tig3 human lung fibroblasts using DNA adenine methyltransferase (Dam) fused to lamin B1 (DamID) (Guelen et al, 2008). Lamin B1 normalized data were downloaded from accession GSE8854, then signal files from 8 microarrays spanning the entire genome were consolidated into one file, and coordinates were converted from Hg18 to Hg19 using the liftOver tool from ENCODE. Enrichment significance (P‐value) was performed for the following features: top 5% 1‐Mb susceptible regions, all protein‐coding genes, and all LINE elements. A hypergeometric test was used to assess significance for the number of base pairs overlapping between those features and LADs, 100‐kb upstream and downstream, and a random control group containing the same regions sizes as all LADs. Background number of base pairs was set to the genome size of 2.7 × 10⁹ bps. For heatmap visualization, each LAD (0.1–10 Mb) was fragmented into 50 windows and flanking regions were divided into 1‐kb windows.
Random forest regression
Random forest is a non‐parametric machine‐learning method that uses a set of predictor variables to construct a regression model of a continuous response variable. Each regression model was constructed using Breiman's random forest algorithm with 1,000 trees; predictor variables were chromatin features from either IMR90 cells or melanocytes, and the response variable was the observed DNA lesion signal across all 1‐Mb windows of the genome. Accuracy of Random Forest Regression was assessed using a 10‐fold cross‐correlation. Percentage of variance explained is represented by a pseudo R‐squared [calculated as (1–mse)/var(y), where y is the response vector (DNA lesion IP signal) and mse is the vector of mean square errors].
3D genome modeling
A model of the IMR90 3D genome in fibroblasts was generated using Chrom3D (https://github.com/CollasLab/Chrom3D) (Paulsen et al, 2017). In short, genomic positions of TADs were based on IMR90 contact domains identified from Hi‐C data accessed under GEO GSE63525 (Rao et al, 2014). Overlapping TADs were merged into single domains, and regions not covered by a TAD were assigned a bead of size proportional to the corresponding genomic region. Bead sizes were scaled so that total bead volume constituted 15% of the volume of a 10‐μm‐diameter modeled nucleus. TADs overlapping with LADs determined from lamin B1 DamID data (Guelen et al, 2008) (6498 lamin B1‐associated TADs) were constrained toward the nuclear periphery by optimizing the distance from a “dummy bead” assigned in the nucleus center. Interactions were defined from high‐resolution Hi‐C data for IMR90 cells (Rao et al, 2014). Statistically significant interactions between beads were identified using a non‐central hypergeometric distribution (Paulsen et al, 2014), as previously described (Paulsen et al, 2017), and yielded 4,208 interactions. These interactions constrain pairs of beads toward each other by minimizing the distance between them. Optimization of bead‐periphery and bead‐bead distances was done using Monte Carlo optimization of a loss‐score function (Paulsen et al, 2017). Source Data for Fig 5 contains both UV lesion abundance (mean fold change, CPD‐IP/input) and radial position for the entire genome in 1‐Mb bins. Each gene is assigned to two or more TADs due to copy number and genes that span multiple TADs.
Melanoma analyses
Mutation density was calculated using whole‐genome sequencing data from 25 melanoma tumor samples (Berger et al, 2012). General research access of the Melanoma Genome Sequencing Project was approved by the National Center for Biotechnology Information Genotypes and Phenotypes Database (NCBI dbGaP, accession no. phs000452.v2.p1). All possible melanoma mutation types (e.g., C>T) were separately counted in the Watson strand for all 1‐Mb non‐overlapping windows of the genome and divided by a million and normalized by the corresponding nucleotide content (e.g., by C content for C>T mutations). For mutation analyses, DNA lesions were normalized by TpT content. Scaled signals for C>T mutation, lamin B1, and DNA lesions were computed by subtracting the mean (centering) and dividing by the centered standard deviation (scaling) in 1‐Mb windows.
The percentage of gene mutation in melanoma samples was downloaded from the cancer browser in the COSMIC database (http://cancer.sanger.ac.uk/cosmic/browse/tissue) (Forbes et al, 2015), using all available malignant melanoma datasets (n = 11,350). Cancer driver genes shown in Fig 7B were obtained from the Intogen database (https://www.intogen.org) (Gonzalez‐Perez et al, 2013). Classification as oncogene, tumor suppressor, or uncharacterized was determined by the OncodriveROLE algorithm (Schroeder et al, 2014) and manually updated with extensive literature mining. DNA lesion signal for each gene was obtained by calculating the median fold change (CPD‐IP/input) value along the entire gene body.
Distance to closest LAD is calculated as the minimum distance from the start or end of a gene to the start or end of any LAD previously defined (Guelen et al, 2008). A gene is considered to be in a LAD when all or part of it is within a LAD.
Source Data for Figs 7 and 8 contain data for all annotated genes, chromosomal region, UV lesion abundance, melanoma mutation frequency, radial position, LAD proximity, cancer driver gene designation, and OncodriveROLE (Schroeder et al, 2014).
Nucleotide excision repair
Repair rates were measured in NHF1 cells by eXcision Repair‐sequencing (XR‐seq), which is the sequencing of TFIIH‐bound DNA fragments produced during nucleotide excision repair (Adar et al, 2016). Samples were collected at 1, 4, 8, 16, 24, and 48 h post‐UV treatment. XR‐seq median values were analyzed in 1‐Mb bins in 25‐bp fixed steps after averaging both Watson and Crick strands. XR‐seq data are available under accession GSE76391.
Author contributions
Individual author contributions include the following: AJM and REH conceived the study; PEG‐N, EKS, REH, and AJM contributed to research direction; EKS and DAK performed UV lesion immunoprecipitation and library preparation; PEG‐N and DAK analyzed data and performed statistical analysis; JP and PC created 3D genome modeling; REH performed histone methyltransferase inhibition assays; AJM wrote the manuscript; all authors edited and approved the manuscript.
Conflict of interest
The authors declare that they have no conflict of interest.
Supporting information
Expanded View Figures PDF
Movie EV1
Movie EV2
Movie EV3
Movie EV4
Movie EV5
Review Process File
Source Data for Figure 5
Source Data for Figure 7
Source Data for Figure 8
Acknowledgements
We thank Aziz Sancar and Jinchuan Hu for the gift of the photolyases. We appreciate manuscript advice from Phil Hanawalt, Or Gozani, and the class of Bio301, and data analysis advice from Anshul Kundaje and Hunter Fraser. This work was supported by NIH grants (CA178529 and CA171050) and Sidney Kimmel for Cancer Research Award to A.J.M, NIH training grant fellowship (NRSA CA09302) to E.K.S., National Science Foundation fellowship (DGE 1656518) to D.A.K, and Coca‐Cola Foundation Fellowship and Sr. Luis Alberto Vega Ricoy research support to P.E.G.N.
See also: EC Beckwitt & B Van Houten (October 2017)
References
- Adar S, Hu J, Lieb JD, Sancar A (2016) Genome‐wide kinetics of DNA excision repair in relation to chromatin state and mutagenesis. Proc Natl Acad Sci USA 113: E2124–E2133 [DOI] [PMC free article] [PubMed] [Google Scholar]
- Alexandrov LB, Nik‐Zainal S, Wedge DC, Aparicio SAJR, Behjati S, Biankin AV, Bignell GR, Bolli N, Borg A, Børresen‐Dale A‐L, Boyault S, Burkhardt B, Butler AP, Caldas C, Davies HR, Desmedt C, Eils R, Eyfjörd JE, Foekens JA, Greaves M et al (2013) Signatures of mutational processes in human cancer. Nature 500: 415–421 [DOI] [PMC free article] [PubMed] [Google Scholar]
- Amendola M, van Steensel B (2014) Mechanisms and dynamics of nuclear lamina–genome interactions. Curr Opin Cell Biol 28: 61–68 [DOI] [PubMed] [Google Scholar]
- Andrews S (2010) FastQC: a quality control tool for high throughput sequence data. https://www.bioinformatics.babraham.ac.uk/projects/fastqc/
- Bell O, Schwaiger M, Oakeley EJ, Lienert F, Beisel C, Stadler MB, Schübeler D (2010) Accessibility of the Drosophila genome discriminates PcG repression, H4K16 acetylation and replication timing. Nature 17: 894–900 [DOI] [PubMed] [Google Scholar]
- Berger MF, Hodis E, Heffernan TP, Deribe YL, Lawrence MS, Protopopov A, Ivanova E, Watson IR, Nickerson E, Ghosh P, Zhang H, Zeid R, Ren X, Cibulskis K, Sivachenko AY, Wagle N, Sucker A, Sougnez C, Onofrio R, Ambrogio L et al (2012) Melanoma genome sequencing reveals frequent PREX2 mutations. Nature 485: 502–506 [DOI] [PMC free article] [PubMed] [Google Scholar]
- Bohr VA, Smith CA, Okumoto DS, Hanawalt PC (1985) DNA repair in an active gene: Removal of pyrimidine dimers from the DHFR gene of CHO cells is much more efficient than in the genome overall. Cell 40: 359–369 [DOI] [PubMed] [Google Scholar]
- Bolzer A, Kreth G, Solovei I, Koehler D, Saracoglu K, Fauth C, Müller S, Eils R, Cremer C, Speicher MR, Cremer T (2005) Three‐dimensional maps of all chromosomes in human male fibroblast nuclei and prometaphase rosettes. PLoS Biol 3: e157 [DOI] [PMC free article] [PubMed] [Google Scholar]
- Brash DE (2015) UV signature mutations. Photochem Photobiol 91: 15–26 [DOI] [PMC free article] [PubMed] [Google Scholar]
- Colditz GA, Wei EK (2012) Preventability of cancer: the relative contributions of biologic and social and physical environmental determinants of cancer mortality. Annu Rev Public Health 33: 137–156 [DOI] [PMC free article] [PubMed] [Google Scholar]
- Cordaux R, Batzer MA (2009) The impact of retrotransposons on human genome evolution. Nat Rev Genet 10: 691–703 [DOI] [PMC free article] [PubMed] [Google Scholar]
- Denissenko MF, Pao A, Tang M, Pfeifer GP (1996) Preferential formation of benzo[a]pyrene adducts at lung cancer mutational hotspots in P53. Science 274: 430–432 [DOI] [PubMed] [Google Scholar]
- Denissenko MF, Chen JX, Tang MS, Pfeifer GP (1997) Cytosine methylation determines hot spots of DNA damage in the human P53 gene. Proc Natl Acad Sci USA 94: 3893–3898 [DOI] [PMC free article] [PubMed] [Google Scholar]
- Douki T, Cadet J (2001) Individual determination of the yield of the main UV‐induced dimeric pyrimidine photoproducts in DNA suggests a high mutagenicity of CC photolesions. Biochemistry 40: 2495–2501 [DOI] [PubMed] [Google Scholar]
- ENCODE Project Consortium , Bernstein BE, Birney E, Dunham I, Green ED, Gunter C, Snyder M (2012) An integrated encyclopedia of DNA elements in the human genome. Nature 489: 57–74 [DOI] [PMC free article] [PubMed] [Google Scholar]
- Ernst J, Kellis M (2012) ChromHMM: automating chromatin‐state discovery and characterization. Nat Methods 9: 215–216 [DOI] [PMC free article] [PubMed] [Google Scholar]
- Forbes SA, Beare D, Gunasekaran P, Leung K, Bindal N, Boutselakis H, Ding M, Bamford S, Cole C, Ward S, Kok CY, Jia M, De T, Teague JW, Stratton MR, McDermott U, Campbell PJ (2015) COSMIC: exploring the world's knowledge of somatic mutations in human cancer. Nucleic Acids Res 43: D805–D811 [DOI] [PMC free article] [PubMed] [Google Scholar]
- Gale JM, Nissen KA, Smerdon MJ (1987) UV‐induced formation of pyrimidine dimers in nucleosome core DNA is strongly modulated with a period of 10.3 bases. Proc Natl Acad Sci USA 84: 6644–6648 [DOI] [PMC free article] [PubMed] [Google Scholar]
- Gale JM, Smerdon MJ (1988) Photofootprint of nucleosome core DNA in intact chromatin having different structural states. J Mol Biol 204: 949–958 [DOI] [PubMed] [Google Scholar]
- Gonzalez‐Perez A, Perez‐Llamas C, Deu‐Pons J, Tamborero D, Schroeder MP, Jene‐Sanz A, Santos A, Lopez‐Bigas N (2013) IntOGen‐mutations identifies cancer drivers across tumor types. Nat Methods 10: 1081–1082 [DOI] [PMC free article] [PubMed] [Google Scholar]
- Greiner D, Bonaldi T, Eskeland R, Roemer E, Imhof A (2005) Identification of a specific inhibitor of the histone methyltransferase SU(VAR)3‐9. Nat Chem Biol 1: 143–145 [DOI] [PubMed] [Google Scholar]
- Guelen L, Pagie L, Brasset E, Meuleman W, Faza MB, Talhout W, Eussen BH, de Klein A, Wessels L, de Laat W, van Steensel B (2008) Domain organization of human chromosomes revealed by mapping of nuclear lamina interactions. Nature 453: 948–951 [DOI] [PubMed] [Google Scholar]
- Hanawalt PC, Spivak G (2008) Transcription‐coupled DNA repair: two decades of progress and surprises. Nat Rev Mol Cell Biol 9: 958–970 [DOI] [PubMed] [Google Scholar]
- Hansen RS, Thomas S, Sandstrom R, Canfield TK, Thurman RE, Weaver M, Dorschner MO, Gartler SM, Stamatoyannopoulos JA (2010) Sequencing newly replicated DNA reveals widespread plasticity in human replication timing. Proc Natl Acad Sci USA 107: 139–144 [DOI] [PMC free article] [PubMed] [Google Scholar]
- Hodis E, Watson IR, Kryukov GV, Arold ST, Imielinski M, Theurillat J‐P, Nickerson E, Auclair D, Li L, Place C, Dicara D, Ramos AH, Lawrence MS, Cibulskis K, Sivachenko A, Voet D, Saksena G, Stransky N, Onofrio RC, Winckler W et al (2012) A landscape of driver mutations in melanoma. Cell 150: 251–263 [DOI] [PMC free article] [PubMed] [Google Scholar]
- Hsu TC (1975) A possible function of constitutive heterochromatin: the bodyguard hypothesis. Genetics 79(Suppl): 137–150 [PubMed] [Google Scholar]
- Hu J, Adar S, Selby CP, Lieb JD, Sancar A (2015) Genome‐wide analysis of human global and transcription‐coupled excision repair of UV damage at single‐nucleotide resolution. Genes Dev 29: 948–960 [DOI] [PMC free article] [PubMed] [Google Scholar]
- Ikehata H, Ono T (2011) The mechanisms of UV mutagenesis. J Radiat Res 52: 115–125 [DOI] [PubMed] [Google Scholar]
- Illner D, Zinner R, Handtke V, Rouquette J, Strickfaden H, Lanctôt C, Conrad M, Seiler A, Imhof A, Cremer T, Cremer M (2010) Remodeling of nuclear architecture by the thiodioxoxpiperazine metabolite chaetocin. Exp Cell Res 316: 1662–1680 [DOI] [PubMed] [Google Scholar]
- Jans J, Schul W, Sert Y‐G, Rijksen Y, Rebel H, Eker APM, Nakajima S, van Steeg H, de Gruijl FR, Yasui A, Hoeijmakers JHJ, van der Horst GTJ (2005) Powerful skin cancer protection by a CPD‐photolyase transgene. Curr Biol 15: 105–115 [DOI] [PubMed] [Google Scholar]
- Kind J, Pagie L, Ortabozkoyun H, Boyle S, de Vries SS, Janssen H, Amendola M, Nolen LD, Bickmore WA, van Steensel B (2013) Single‐cell dynamics of genome‐nuclear lamina interactions. Cell 153: 178–192 [DOI] [PubMed] [Google Scholar]
- Kubicek S, O'Sullivan RJ, August EM, Hickey ER, Zhang Q, Teodoro ML, Rea S, Mechtler K, Kowalski JA, Homon CA, Kelly TA, Jenuwein T (2007) Reversal of H3K9me2 by a small‐molecule inhibitor for the G9a histone methyltransferase. Mol Cell 25: 473–481 [DOI] [PubMed] [Google Scholar]
- Lawrence MS, Stojanov P, Polak P, Kryukov GV, Cibulskis K, Sivachenko A, Carter SL, Stewart C, Mermel CH, Roberts SA, Kiezun A, Hammerman PS, McKenna A, Drier Y, Zou L, Ramos AH, Pugh TJ, Stransky N, Helman E, Kim J et al (2013) Mutational heterogeneity in cancer and the search for new cancer‐associated genes. Nature 499: 214–218 [DOI] [PMC free article] [PubMed] [Google Scholar]
- Mao P, Smerdon MJ, Roberts SA, Wyrick JJ (2016) Chromosomal landscape of UV damage formation and repair at single‐nucleotide resolution. Proc Natl Acad Sci USA 113: 9057–9062 [DOI] [PMC free article] [PubMed] [Google Scholar]
- Martincorena I, Roshan A, Gerstung M, Ellis P, Van Loo P, McLaren S, Wedge DC, Fullam A, Alexandrov LB, Tubio JM, Stebbings L, Menzies A, Widaa S, Stratton MR, Jones PH, Campbell PJ (2015) High burden and pervasive positive selection of somatic mutations in normal human skin. Science 348: 880–886 [DOI] [PMC free article] [PubMed] [Google Scholar]
- Masumoto H, Hawke D, Kobayashi R, Verreault A (2005) A role for cell‐cycle‐regulated histone H3 lysine 56 acetylation in the DNA damage response. Nature 436: 294–298 [DOI] [PubMed] [Google Scholar]
- Mellon I, Spivak G, Hanawalt PC (1987) Selective removal of transcription‐blocking DNA damage from the transcribed strand of the mammalian DHFR gene. Cell 51: 241–249 [DOI] [PubMed] [Google Scholar]
- Mitchell DL, Vaughan JE, Nairn RS (1989) Inhibition of transient gene expression in Chinese hamster ovary cells by cyclobutane dimers and (6‐4) photoproducts in transfected ultraviolet‐irradiated plasmid DNA. Plasmid 21: 21–30 [DOI] [PubMed] [Google Scholar]
- Mitchell DL, Jen J, Cleaver JE (1991) Relative induction of cyclobutane dimers and cytosine photohydrates in DNA irradiated in vitro and in vivo with ultraviolet‐C and ultraviolet‐B light. Photochem Photobiol 54: 741–746 [DOI] [PubMed] [Google Scholar]
- Moser J, Volker M, Kool H, Alekseev S, Vrieling H, Yasui A, van Zeeland AA, Mullenders LHF (2005) The UV‐damaged DNA binding protein mediates efficient targeting of the nucleotide excision repair complex to UV‐induced photo lesions. DNA Repair 4: 571–582 [DOI] [PubMed] [Google Scholar]
- Paulsen J, Rødland EA, Holden L, Holden M, Hovig E (2014) A statistical model of ChIA‐PET data for accurate detection of chromatin 3D interactions. Nucleic Acids Res 42: e143 [DOI] [PMC free article] [PubMed] [Google Scholar]
- Paulsen J, Sekelja M, Oldenburg AR, Barateau A, Briand N, Delbarre E, Shah A, Sørensen AL, Vigouroux C, Buendia B, Collas P (2017) Chrom3D: three‐dimensional genome modeling from Hi‐C and nuclear lamin‐genome contacts. Genome Biol 18: 21 [DOI] [PMC free article] [PubMed] [Google Scholar]
- Pehrson JR, Cohen LH (1992) Effects of DNA looping on pyrimidine dimer formation. Nucleic Acids Res 20: 1321–1324 [DOI] [PMC free article] [PubMed] [Google Scholar]
- Polak P, Karlić R, Koren A, Thurman R, Sandstrom R, Lawrence MS, Reynolds A, Rynes E, Vlahoviček K, Stamatoyannopoulos JA, Sunyaev SR (2015) Cell‐of‐origin chromatin organization shapes the mutational landscape of cancer. Nature 518: 360–364 [DOI] [PMC free article] [PubMed] [Google Scholar]
- Prendergast JGD, Campbell H, Gilbert N, Dunlop MG, Bickmore WA, Semple CAM (2007) Chromatin structure and evolution in the human genome. BMC Evol Biol 7: 72 [DOI] [PMC free article] [PubMed] [Google Scholar]
- Rao SSP, Huntley MH, Durand NC, Stamenova EK, Bochkov ID, Robinson JT, Sanborn AL, Machol I, Omer AD, Lander ES, Aiden EL (2014) A 3D map of the human genome at kilobase resolution reveals principles of chromatin looping. Cell 159: 1665–1680 [DOI] [PMC free article] [PubMed] [Google Scholar]
- Roadmap Epigenomics Consortium , Kundaje A, Meuleman W, Ernst J, Bilenky M, Yen A, Heravi‐Moussavi A, Kheradpour P, Zhang Z, Wang J, Ziller MJ, Amin V, Whitaker JW, Schultz MD, Ward LD, Sarkar A, Quon G, Sandstrom RS, Eaton ML, Wu Y‐C et al (2015) Integrative analysis of 111 reference human epigenomes. Nature 518: 317–330 [DOI] [PMC free article] [PubMed] [Google Scholar]
- Schroeder MP, Rubio‐Perez C, Tamborero D, Gonzalez‐Perez A, Lopez‐Bigas N (2014) OncodriveROLE classifies cancer driver genes in loss of function and activating mode of action. Bioinformatics 30: i549–i555 [DOI] [PMC free article] [PubMed] [Google Scholar]
- Schuster‐Böckler B, Lehner B (2012) Chromatin organization is a major influence on regional mutation rates in human cancer cells. Nature 488: 504–507 [DOI] [PubMed] [Google Scholar]
- Selby CP, Sancar A (2012) The second chromophore in Drosophila photolyase/cryptochrome family photoreceptors. Biochemistry 51: 167–171 [DOI] [PMC free article] [PubMed] [Google Scholar]
- Selleck SB, Majors J (1987) Photofootprinting in vivo detects transcription‐dependent changes in yeast TATA boxes. Nature 325: 173–177 [DOI] [PubMed] [Google Scholar]
- Sima J, Gilbert DM (2014) Complex correlations: replication timing and mutational landscapes during cancer and genome evolution. Curr Opin Genet Dev 25: 93–100 [DOI] [PMC free article] [PubMed] [Google Scholar]
- Stamatoyannopoulos JA, Adzhubei I, Thurman RE, Kryukov GV, Mirkin SM, Sunyaev SR (2009) Human mutation rate associated with DNA replication timing. Nat Cell Biol 41: 393–395 [DOI] [PMC free article] [PubMed] [Google Scholar]
- Verbruggen P, Heinemann T, Manders E, von Bornstaedt G, van Driel R, Höfer T (2014) Robustness of DNA repair through collective rate control. PLoS Comput Biol 10: e1003438 [DOI] [PMC free article] [PubMed] [Google Scholar]
- You YH (2001) Cyclobutane pyrimidine dimers are responsible for the vast majority of mutations induced by UVB irradiation in mammalian cells. J Biol Chem 276: 44688–44694 [DOI] [PubMed] [Google Scholar]
- Zavala AG, Morris RT, Wyrick JJ, Smerdon MJ (2014) High‐resolution characterization of CPD hotspot formation in human fibroblasts. Nucleic Acids Res 42: 893–905 [DOI] [PMC free article] [PubMed] [Google Scholar]
- van Zeeland AA, Smith CA, Hanawalt PC (1981) Sensitive determination of pyrimidine dimers in DNA of UV‐irradiated mammalian cells. Introduction of T4 endonuclease V into frozen and thawed cells. Mutat Res 82: 173–189 [DOI] [PubMed] [Google Scholar]
- Zhang Y, Liu T, Meyer CA, Eeckhoute J, Johnson DS, Bernstein BE, Nussbaum C, Myers RM, Brown M, Li W, Liu XS (2008) Model‐based analysis of ChIP‐Seq (MACS). Genome Biol 9: R137 [DOI] [PMC free article] [PubMed] [Google Scholar]
Associated Data
This section collects any data citations, data availability statements, or supplementary materials included in this article.
Supplementary Materials
Expanded View Figures PDF
Movie EV1
Movie EV2
Movie EV3
Movie EV4
Movie EV5
Review Process File
Source Data for Figure 5
Source Data for Figure 7
Source Data for Figure 8


