Abstract
Autophagy (macroautophagy) is a highly conserved eukaryotic degradation pathway in which cytosolic components and organelles are sequestered by specialized autophagic membranes and degraded through the lysosomal system. The autophagic pathway maintains basal cellular homeostasis and helps cells adapt during stress; thus, defects in autophagy can cause detrimental effects. It is therefore crucial that autophagy is properly regulated. In this study, we show that the cysteine protease Atg4B, a key enzyme in autophagy that cleaves LC3, is an interactor of the small GTPase Rab7b. Indeed, Atg4B interacts and co‐localizes with Rab7b on vesicles. Depletion of Rab7b increases autophagic flux as indicated by the increased size of autophagic structures as well as the magnitude of macroautophagic sequestration and degradation. Importantly, we demonstrate that Rab7b regulates LC3 processing by modulating Atg4B activity. Taken together, our findings reveal Rab7b as a novel negative regulator of autophagy through its interaction with Atg4B.
Keywords: Atg4B, autophagy, LC3, Rab GTPases, Rab7b
Subject Categories: Autophagy & Cell Death, Membrane & Intracellular Transport
Introduction
Macroautophagy (hereafter referred to as autophagy) is a catabolic cellular process essential in several physiological processes such as maintenance of basal homeostasis, stress adaptation, for example, in starvation, cell differentiation and development, clearance of aberrant structures, tumor suppression, and innate and adaptive immunity 1, 2, 3, 4. During autophagy, cytosolic components are sequestered by unique double‐membrane structures called phagophores, which expand and close to form autophagosomes 5. Outer membranes of autophagosomes fuse with late endosomes or lysosomes to form amphisomes or autolysosomes, respectively, in which both the inner autophagic membrane and the content are degraded by the action of lysosomal enzymes 3.
Rab proteins constitute the largest family of small GTPases with almost 70 members in humans. They are master regulators of intracellular trafficking 6, 7, and there is also growing evidence that several Rabs play important roles at different stages of autophagy, such as in formation and maturation of autophagic vesicles 8, 9.
The small GTPase Rab7b was assigned because of its similarity (shares about 50% identity and 65% similarity) to Rab7a (often referred to as Rab7), and its localization to late endosomes and lysosomes 10. Unlike Rab7a, Rab7b has been poorly studied and is located to the trans‐Golgi network (TGN) and Golgi apparatus. Here, it serves in the regulation of transport from late endosomes to the TGN 11, 12. Additionally, via a direct interaction with myosin II, Rab7b controls actin organization and affects cell migration 13.
In this study, we looked for Rab7b effectors by yeast two‐hybrid screening and identified autophagy‐related protein (Atg) 4B as an interaction partner. Atg4B is a cysteine protease responsible for cleaving the precursor form of the autophagosomal protein microtubule‐associated protein 1 light chain 3, LC3 (pro‐LC3) 14, 15, 16. Cleavage exposes a C‐terminal glycine residue on LC3 (LC3‐I) that enables conjugation to phosphatidylethanolamine (PE) and thereby insertion into autophagic membranes (lipidated LC3, LC3‐PE, or LC3‐II). This process is reversible as Atg4B can also delipidate LC3‐II to LC3‐I, releasing it from outer autophagic membranes. Atg4B can also cleave and delipidate LC3‐related proteins of the GABARAP family 15, 16.
In controlling the priming and lipidation state of LC3 and GABARAP proteins, Atg4B has a central role in autophagy. Stabilization of Atg4B protein levels by inactivation of the E3 ligase RNF5, which mediates degradation of a membrane‐associated pool of Atg4B, increases LC3 processing and thereby promotes formation and maturation of autophagosomes 17. Moreover, the ability of Atg4B to delipidate LC3 is dependent on its phosphorylation state and also on reactive oxygen species 18, 19. However, the regulation of this cysteine protease remains incompletely understood.
Here, we reveal a novel role for Rab7b in autophagy as an interaction partner for Atg4B. We show that depletion of Rab7b increases autophagic flux and the size of autophagosomes and demonstrate that this small GTPase can modulate LC3 processing through the interaction with Atg4B.
Results and Discussion
Atg4B interacts with Rab7b
In view of the paucity of information on Rab7b and to further investigate its biological role, we looked for effectors by yeast two‐hybrid screening. Atg4B was identified as a positive hit suggesting a new role for Rab7b in autophagy (data not shown).
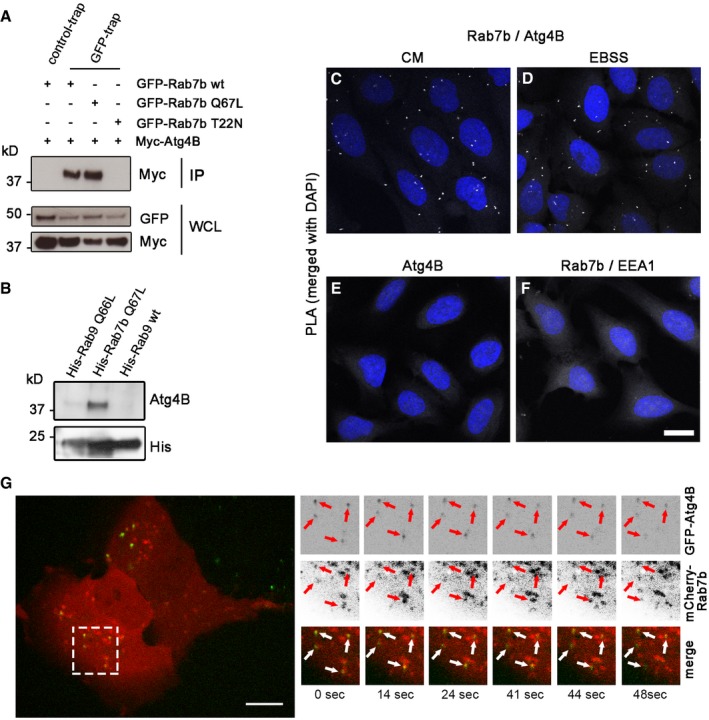
To verify this result, we transiently co‐transfected U2OS cells with myc‐Atg4B and GFP‐Rab7b wt and performed co‐immunoprecipitation (IP) with GFP‐Trap magnetic agarose beads. The cells were either incubated in nutrient‐rich media (CM) or starved for 2 h (Earle's balanced salt solution, EBSS medium) to induce autophagy prior to lysis. Atg4B successfully co‐immunoprecipitated with Rab7b, confirming the result from the yeast two‐hybrid screen (Figs 1A and EV1A).
Figure 1. Atg4B interacts with Rab7b.
-
AU2OS cells were transiently co‐transfected with myc‐Atg4B and either GFP‐Rab7b wt, GFP‐Rab7b Q67L, or GFP‐Rab7b T22N, starved, and lysed, followed by co‐IP with GFP‐Trap magnetic agarose beads. Whole‐cell lysates (WCL) and immunoprecipitates (IP) were subjected to Western blot analysis.
-
BBacterially expressed and purified His‐Rab7b Q67L, His‐Rab9, and His‐Rab9 Q66L were loaded with GTPγS and incubated with cell lysates of human MDDCs. His‐tagged proteins pulled down using cobalt‐coated Dynabeads were subjected to Western blot analysis.
-
C–FProximity ligation assay (PLA) of U2OS cells incubated in CM (C) or starved for 2 h (D), fixed, and stained with anti‐Rab7b, anti‐Atg4B, and DAPI. As negative control, PLA was performed on U2OS cells starved for 2 h and stained with anti‐Atg4B and DAPI only (E) or on cells transiently transfected with HA‐Rab7b wt, starved for 2 h, and stained with anti‐HA, anti‐EEA1, and DAPI (F). Scale bar: 30 μm.
-
GLive‐cell imaging of U2OS cells co‐transfected with GFP‐Atg4B and mCherry‐Rab7b. Red and white arrows indicate vesicles positive for both GFP‐Atg4B and mCherry‐Rab7b. Scale bar: 10 μm.
Figure EV1. Rab7b associates with Atg4B and autophagosomes.

-
AU2OS cells were transiently co‐transfected with myc‐Atg4B and GFP‐Rab7b, incubated in CM or starved for 2 h, and lysed, followed by co‐IP with GFP‐Trap magnetic agarose beads. Whole‐cell lysates (WCL) and immunoprecipitates (IP) were subjected to Western blot analysis using the indicated antibodies.
-
BU2OS cells were transiently co‐transfected with HA‐Rab7b Q67L and myc‐Atg4B, starved for 2 h, and lysed, prior to co‐IP with an antibody against myc or an isotype control (IgG1). Whole‐cell lysates (WCL) and immunoprecipitates (IP) were subjected to Western blot analysis using the indicated antibodies.
-
CCoomassie blue staining of bacterially expressed His‐Rab9 Q66L, His‐Rab7b Q67L, and His‐Rab9 wt purified using cobalt‐coated Dynabeads.
-
DDouble immunogold labeling of U2OS cells stably transfected with GFP‐LC3 and transiently transfected with HA‐Rab7b. HA‐Rab7b (10 nm gold) localizes to outer (open arrowheads) and inner (filled arrowheads) membranes of autophagosomes, identified by LC3 labeling (5 nm gold, arrows) and characteristic ultrastructure (cytoplasmic mass surrounded with electron lucent area representing double membrane). Scale bars: 200 nm.
-
E, FLive‐cell imaging of U2OS cells transiently transfected with mCherry‐LC3 and GFP‐Rab7b T22N (E) or mCherry‐LC3 and GFP‐Rab7b Q67L (F). Red and white arrows indicate vesicles positive for both mCherry‐LC3 and GFP‐Rab7b Q67L. Scale bar: 15 μm.
Rab proteins function as molecular switches, alternating between an active GTP‐bound state and an inactive GDP‐bound state. When active, Rabs are recruited to membranes and preferentially bind effector proteins to carry out various functions 6, 7. To investigate whether the interaction between Atg4B and Rab7b is dependent on the activation state of Rab7b, we co‐transfected cells with myc‐Atg4B and either the constitutively active mutant of Rab7b (GFP‐Rab7b Q67L, with reduced GTPase activity) or the dominant negative mutant of Rab7b (GFP‐Rab7b T22N, which has higher affinity for GDP than GTP) and performed identical co‐IP assays. Interestingly, Rab7b Q67L but not Rab7b T22N co‐immunoprecipitated Atg4B, demonstrating that Atg4B specifically binds the active, membrane‐bound form of Rab7b (Fig 1A).
We further validated these results by showing that also Atg4B immunoprecipitated HA‐Rab7b Q67L (Fig EV1B). We also performed pulldown experiments to verify the ability of Rab7b to bind to endogenous Atg4B using primary human monocyte‐derived dendritic cells (MDDCs). His‐Rab7b Q67L, His‐Rab9, and His‐Rab9 Q66L (used as control for the specificity of the interaction) were expressed in bacteria, purified, and similarly incubated with dendritic cell lysates (Fig EV1C). Only His‐Rab7b Q67L bound to endogenous Atg4B, showing that the interaction is specific for Rab7b (Fig 1B).
To further corroborate our findings, we performed a proximity ligation assay (PLA) 20. U2OS cells were either incubated in nutrient‐rich media or starved for 2 h, fixed, and stained for PLA with primary antibodies against Rab7b and Atg4B. As negative controls, cells were stained with anti‐Atg4B only or transiently transfected with HA‐Rab7b and stained with anti‐HA and anti‐early endosome antigen 1 (EEA1, marker for early endosomes). Confocal microscopy revealed fluorescent spots in the cells stained with anti‐Rab7b and anti‐Atg4B (Fig 1C and D), but not in the negative controls (Fig 1E and F). This further demonstrates that Rab7b and Atg4B co‐localize and interact at endogenous levels in cells.
Rab7b‐positive vesicles are dynamically associated with autophagic membranes
Since Atg4B interacts with the active form of Rab7b, we investigated whether Rab7b plays a role in autophagy. As a first approach to verify this, we studied the intracellular dynamics of Rab7b and Atg4B by live‐cell imaging. We found that in cells transfected with GFP‐Atg4B and mCherry‐Rab7b, the proteins co‐localized on vesicles (Fig 1G, Movie EV1), and in line with our previous data, this indicates that Atg4B interacts with membrane‐bound Rab7b.
To investigate the dynamics of Rab7b on autophagic membranes, U2OS cells stably transfected with GFP‐LC3 were transiently transfected with mCherry‐Rab7b, or U2OS cells were transiently co‐transfected with mCherry‐LC3 and GFP‐Rab7b, and starved for 2 h prior to imaging. We observed LC3 and Rab7b either on the same vesicles or on different vesicles dynamically interacting (Fig 2A and C, Movie EV2). We further quantified the period of interaction between Rab7b‐ and LC3‐positive vesicles and found the average interaction time to be ~122 s (± 25 s). The frequency distribution diagram of the interaction time shows that 92% of the interactions lasted between 50 and 200 s (Fig 2B). By creating a three‐dimensional reconstruction of optical sections, we could identify LC3‐ and Rab7b‐positive vesicles in contact and overlapping with each other. Intriguingly, in many cases Rab7b appeared to be located inside LC3‐positive vesicles (Fig 2C).
Figure 2. Rab7b dynamically interacts with autophagic membranes.
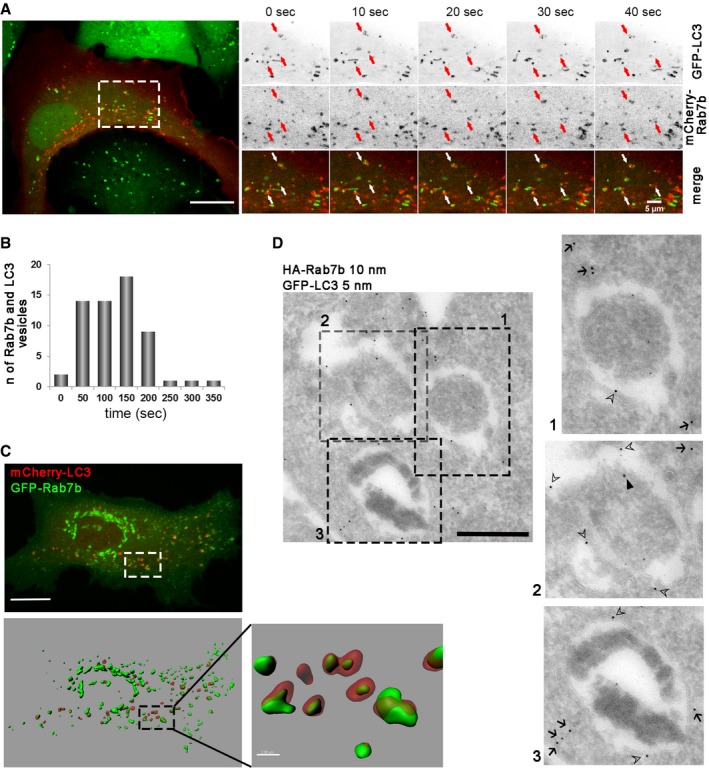
- Live‐cell imaging of U2OS GFP‐LC3 cells transiently transfected with mCherry‐Rab7b. The arrows indicate Rab7b‐ and LC3‐positive vesicles moving together. Scale bars: 15 μm and 5 μm.
- Frequency histogram representing the quantification of how long Rab7b‐ and LC3‐positive vesicles move together before separating. Total number of objects counted (n) is shown for 60 different cells from three independent experiments.
- Live‐cell imaging of U2OS cells transiently transfected with GFP‐Rab7b and mCherry‐LC3. 3D volume rendering (top) and the relative Imaris isosurface 3D rendering (bottom) are shown. Scale bar: 15 μm. Magnification of the boxed area is shown in the inset on the right (scale bar: 2 μm).
- Double immunogold labeling of U2OS cells stably transfected with GFP‐LC3 and transiently transfected with HA‐Rab7b. HA‐Rab7b (10 nm gold) localizes to outer (open arrowheads) and inner (filled arrowheads) membranes of autophagosomes, identified by LC3 labeling (5 nm gold) and characteristic ultrastructure (cytoplasmic mass surrounded with electron lucent area representing double membrane), or to small vesicles close to autophagosomes (arrows). Scale bar: 500 nm.
To study the relationship between these vesicles at ultrastructural levels, we performed immunogold labeling on U2OS cells stably transfected with GFP‐LC3 and transiently transfected with HA‐Rab7b. This confirmed the presence of Rab7b on both the inner and outer autophagosomal membranes, as well as on smaller vesicles in close proximity to autophagosomes (Figs 2D and EV1D). The presence of a Rab protein on the inner membrane of autophagosomes is not surprising. Indeed, another Rab protein, Rab24, was also observed on both the outer and inner membranes of autophagosomes 21, suggesting that these Rabs are recruited to autophagosomal membranes before completion of the autophagosome.
We also investigated the localization of the constitutively active and the dominant negative mutants of Rab7b in comparison with autophagosomes in live cells. Similar to Rab7b wt, Rab7b Q67L was also targeted to LC3‐positive vesicles (Fig EV1F, Movie EV3). In agreement with previous results, the dominant negative mutant of Rab7b was cytosolic 11, 22 and therefore not targeted to autophagosomes (Fig EV1E). Taken together, these findings show that the active form of Rab7b interacts with autophagosomal membranes in a dynamic manner, and further suggest a role for Rab7b in autophagy.
Rab7b depletion increases the size of autophagic structures and autophagic flux
If Rab7b has a role in autophagy, its depletion should influence the number or size of autophagic structures. We tested this hypothesis using LC3 as a marker for autophagic membranes.
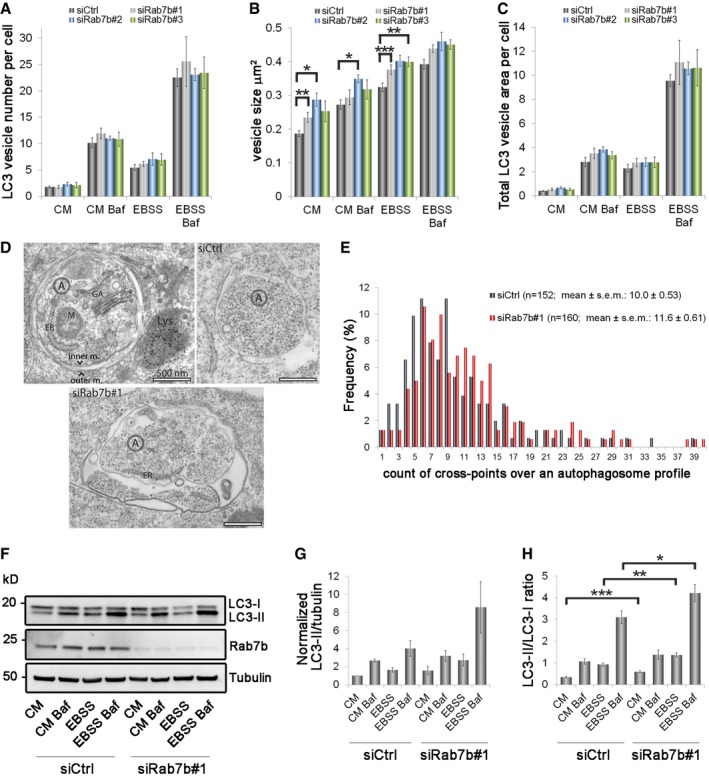
U2OS cells transfected with control siRNA or with three different siRNAs against Rab7b (siRab7b #1, siRab7b #2, and siRab7b #3) were incubated for 2 h in either complete medium (CM), starvation medium (EBSS), complete medium with the lysosomal acidification inhibitor bafilomycin A1 (BafA1), or starvation medium with BafA1 as control (BafA1 is a known inhibitor of autophagosomal degradation 23). The cells were fixed and stained with anti‐LC3 antibody and analyzed by confocal microscopy. Depletion of Rab7b by each of the three siRNAs increased the size of LC3‐positive puncta under basal and starvation conditions, but the number of individual puncta was unchanged (Figs 3A–C and EV2). Using point counting over autophagosome profiles in thin sections imaged by transmission electron microscopy 24, we further confirmed a 16% enlargement of autophagosomes induced by Rab7b knockdown after starvation (Fig 3D and E).
Figure 3. Rab7b knockdown affects the size of autophagic structures and causes LC3‐II accumulation.
-
A–CU2OS cells transfected with control siRNA (siCtrl) or three different siRNAs against Rab7b (#1, #2, or #3) were incubated for 2 h in either CM, CM with BafA1, EBSS, or EBSS with BafA1, before fixation and staining with anti‐LC3 and Hoechst. The graphs represent the quantification of the number (A), size (B), and total area (C) of endogenous LC3‐positive vesicles per cell. Data represent the mean ± s.e.m. of at least four independent experiments (n > 60 cells).
-
DUltrastructural analysis of autophagosomes by transmission electron microscopy. Autophagosomes (A) were identified as membrane‐bound compartments containing morphologically intact cytoplasm, usually represented by ribosomes and endoplasmic reticulum (ER), and sometimes containing other organelles, such as mitochondria (M) or Golgi apparatus (GA). They did not contain colloidal BSA‐gold 5 nm (outlined with a dashed line), which was pulse‐chased to late endosomes and lysosomes (Lys). Examples of autophagosomes in control and samples knocked down for Rab7b are shown. Scale bar: 500 nm.
-
ESemi‐quantitative analysis of the autophagosome size by TEM shown as frequency distributions. Total number of autophagosomes counted (n) is shown for images collected from five different sections, representing different cell populations, for each of the indicated samples. The Student's two‐sample t‐test P‐value was 0.0504.
-
FCell lysates from cells transfected with control siRNA or siRNA against Rab7b were subjected to Western blot analysis with the indicated antibodies.
-
G, HQuantification of LC3‐II levels normalized against the amount of tubulin and plotted relative to the intensities obtained in cells transfected with control siRNA in CM (G) and of LC3‐II/LC3‐I ratio (H). Data represent the mean ± s.e.m. of at least four independent experiments.
Figure EV2. Depletion of Rab7b increases the size of LC3‐positive puncta.
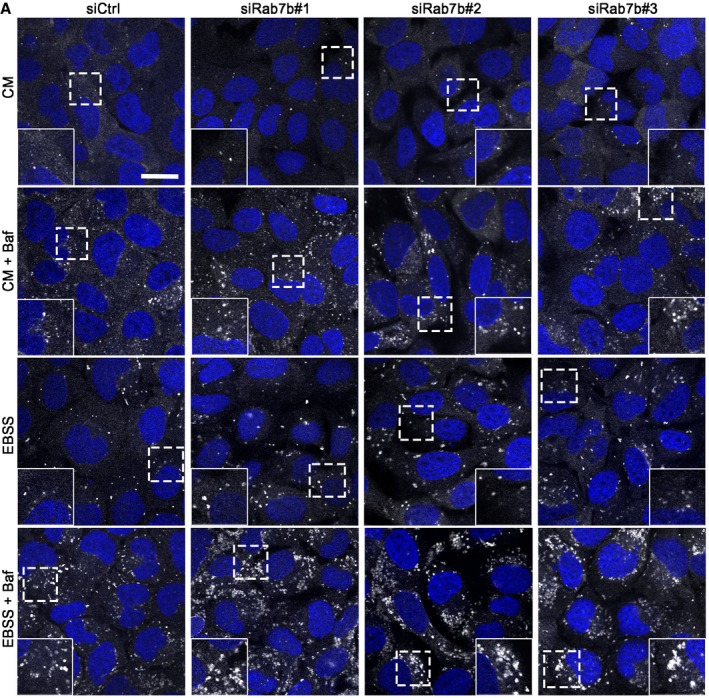
- U2OS cells transfected with control siRNA (siCtrl) or three different siRNAs against Rab7b (#1, #2, or #3) were incubated for 2 h in either CM, CM with BafA1, EBSS, or EBSS with BafA1, before fixation and staining with anti‐LC3 and Hoechst. The insets show magnifications of the boxed areas. Scale bar: 20 μm.
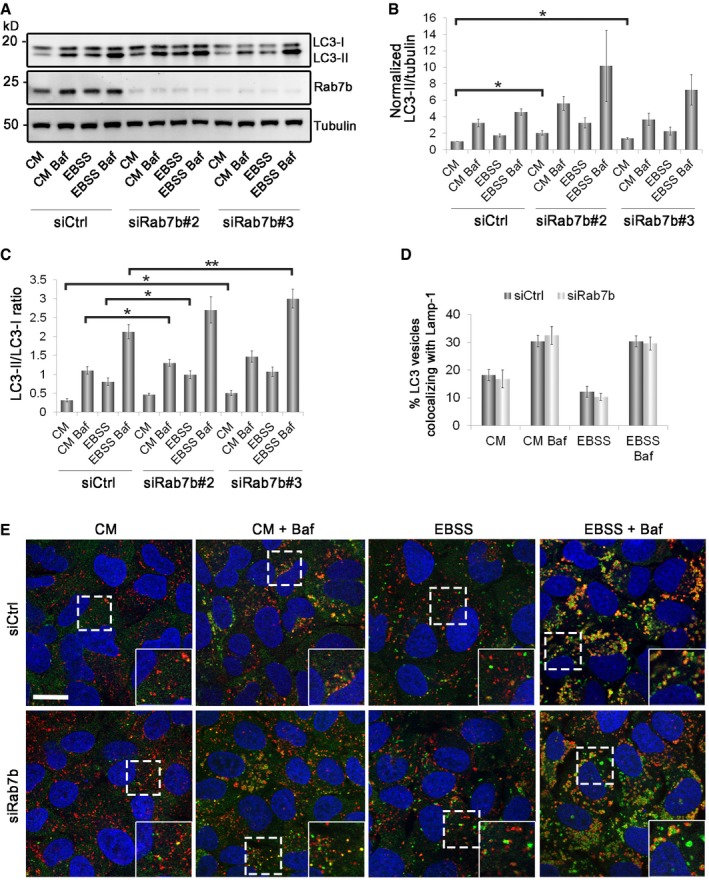
By Western blot analysis, we found a substantial increase in the amount of lipidated LC3 (LC3‐II) in Rab7b‐depleted cells compared with control cells, almost twofold under basal conditions and after starvation (Figs 3F and G, and EV3A and B). The LC3‐II/LC3‐I ratio also increased with almost twofold under both basal conditions and almost 1.5‐fold upon starvation (Figs 3F–H and EV3A–C). These results indicate a higher amount of LC3 conjugated to PE in Rab7b‐depleted cells, consistent with increased size of the autophagosomal membranes positive for LC3.
Figure EV3. Rab7b depletion causes LC3‐II accumulation but does not affect the fusion of autophagosomes with lysosomes.
-
ACell lysates from cells transfected with control siRNA or siRNAs against Rab7b were subjected to Western blot analysis with the indicated antibodies.
-
B, CQuantification of LC3‐II levels normalized against tubulin and plotted relative to the intensities obtained in cells transfected with control siRNA in CM (B) and of LC3‐II/LC3‐I ratio (C). Data represent the mean ± s.e.m. of four independent experiments.
-
DU2OS cells transfected with control siRNA (siCtrl) or siRNA against Rab7b #1 (siRab7b) were incubated for 2 h in either CM, CM with BafA1, EBSS, or EBSS with BafA1, fixed, and stained with antibodies against LC3 and Lamp‐1. The percentage of LC3 vesicles also positive for Lamp‐1 per cell is represented in the graph. Data represent the mean ± s.e.m. of four independent experiments (n > 60 cells).
-
ERepresentative confocal fluorescence images showing LC3 (green), Lamp‐1 (red), and Hoechst (blue) under normal or starvation conditions (with or without BafA1) in control cells transfected with a non‐targeting siRNA or in cells depleted of Rab7b. The insets show magnifications of the boxed areas. Scale bar: 20 μm.
To determine whether the elevated level of LC3‐II is caused by upregulation of autophagosome formation or blockage of autophagic degradation, the accumulation of LC3‐II in the presence of BafA1 was measured 25, 26. The addition of BafA1 blocks lysosomal degradation of LC3‐II and leads to its accumulation. The difference in the amount of LC3‐II between samples in the presence and absence of BafA1 therefore reflects the amount of LC3 delivered to lysosomes for degradation, that is, autophagic LC3 flux 25. In BafA1‐treated cells, the amount of accumulated LC3‐II increased in Rab7b‐depleted cells compared to control cells (Figs 3F–H and EV3A–C). This suggests that loss of this Rab increases autophagic flux rather than blocking autophagic degradation. As all the three different siRNAs targeting Rab7b gave similar results, excluding the possibility of off‐target effects, we next continued our study using siRab7b #1, which from here on is referred to as siRab7b.
To further confirm that Rab7b depletion does not inhibit autophagosome–lysosome fusion, we counted the number of autophagosomes stained with LC3 that were also positive for the lysosomal marker lysosome‐associated membrane glycoprotein 1 (Lamp‐1). Vesicles positive for both LC3 and Lamp‐1 indicate autophagosomes that have fused with lysosomes to form autolysosomes. The percentage of LC3‐positive vesicles also positive for Lamp‐1 was not affected by Rab7b knockdown, indicating that Rab7b depletion does not affect fusion of autophagosomes with lysosomes (Fig EV3D and E).
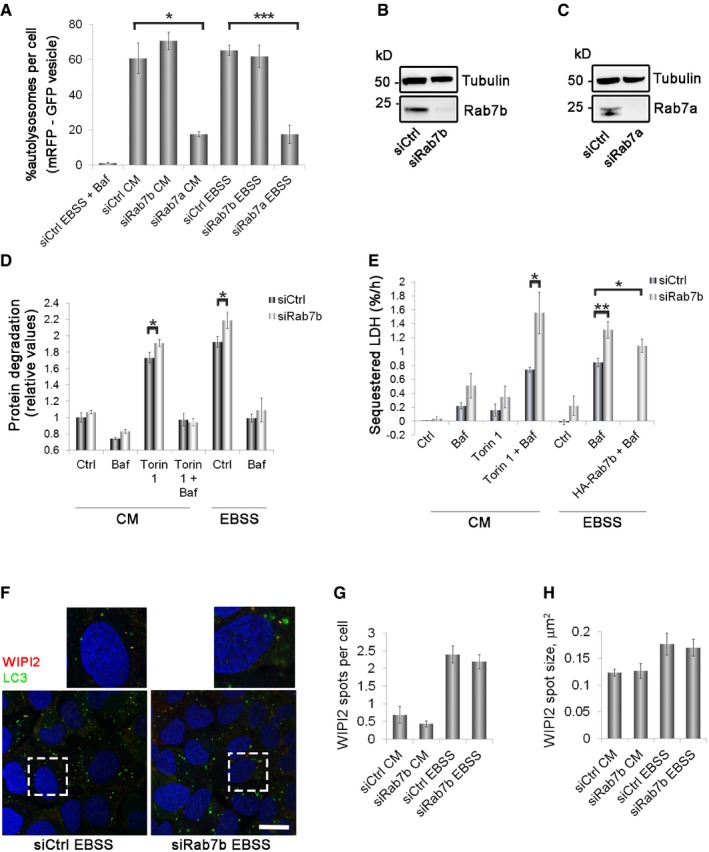
We next verified that Rab7b depletion does not affect the acidification of autophagosomes by utilizing the tandem mRFP‐GFP‐LC3 assay 27. We also compared the effects of Rab7a and Rab7b silencing as Rab7a knockdown blocks fusion between autophagosomes and lysosomes 27, 28, 29. U2OS cells stably transfected with mRFP‐GFP‐LC3 and knocked down for Rab7a or Rab7b were incubated for 2 h in either CM, EBSS, or EBSS with BafA1 as control. As expected, after Rab7a depletion the number of acidic LC3 vesicles decreased by more than threefold compared to the control cells. Interestingly, no significant difference in the percentage of red vesicles was measured after Rab7b knockdown, further confirming that acidification of autophagosomes is not affected (Figs 4A–C and EV4).
Figure 4. Rab7b depletion increases autophagic flux and sequestration rate.
-
AU2OS mRFP‐GFP‐LC3 cells were transfected with either control siRNA or siRNA against Rab7b or Rab7a and incubated for 2 h in CM, EBSS, or EBSS with BafA1 before fixing. The percentage of autolysosomes (vesicles positive for RFP but not GFP) per cell is represented in the graph. Data represent the mean ± s.e.m. for three independent experiments (n > 60 cells).
-
B, CCell lysates from U2OS cells treated with control siRNA and siRNA against Rab7b (B) or Rab7a (C) were subjected to Western blot analysis with the indicated antibodies.
-
DU2OS cells transfected with control siRNA or siRNA against Rab7b were subjected to a LLPD assay. The quantification of the degradation rate for long‐lived proteins is presented as mean ± s.e.m. of at least four independent experiments.
-
EU2OS cells transfected with control siRNA, siRNA against Rab7b, or depleted of Rab7b and then transfected with HA‐Rab7b were subjected to a LDH sequestration assay. In the graph, the net sequestered LDH per hour (%/h) is represented as mean ± s.e.m. of at least three independent experiments.
-
FU2OS cells transfected with control siRNA or siRNA against Rab7b were starved or not for 2 h before fixation and then stained with antibodies against LC3 and WIPI2. The insets show magnifications of the boxed areas. Scale bar: 20 μm.
-
G, HQuantification of the number (G) and size (H) of WIPI2‐positive spots per cell. The data represent the mean ± s.e.m. of three independent experiments (n > 60 cells).
Figure EV4. Rab7b does not influence acidification of autophagosomes.
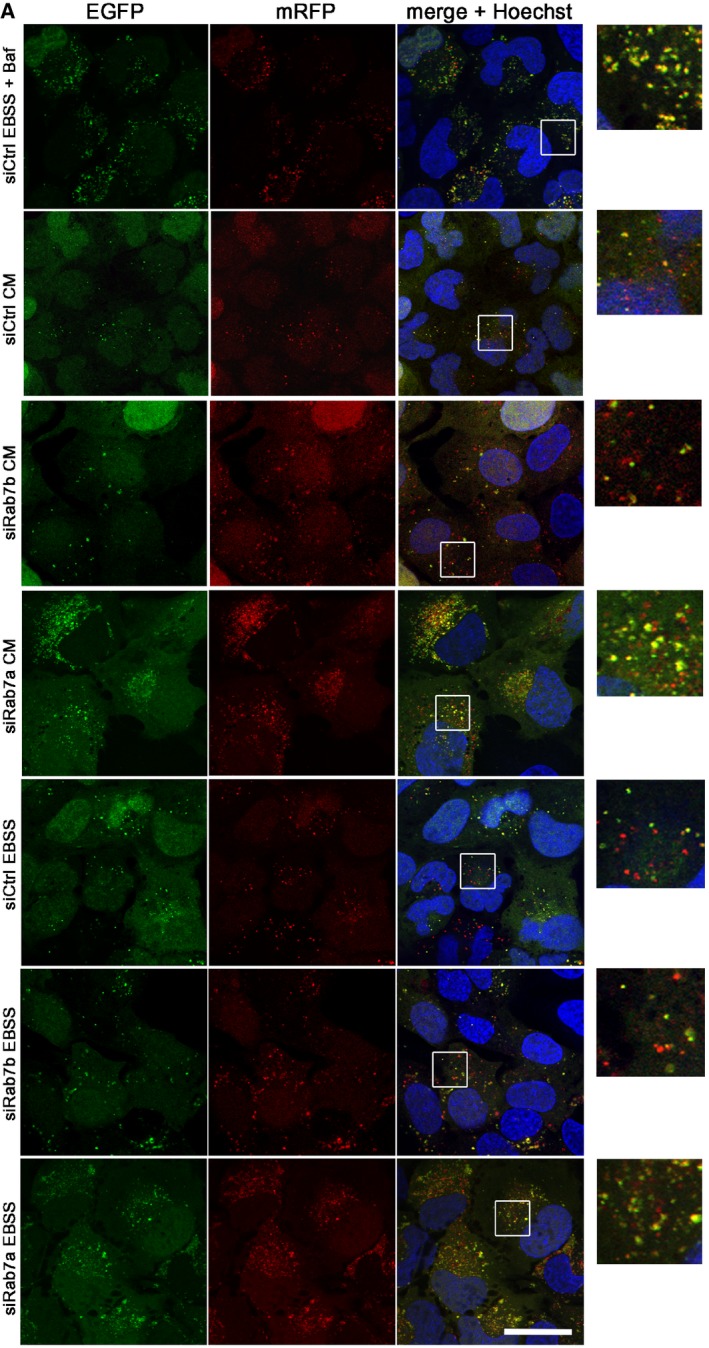
- U2OS cells stably expressing mRFP‐GFP‐LC3 were transfected with either control siRNA (siCtrl) or siRNA against Rab7b or Rab7a and incubated for 2 h in CM, EBSS, or EBSS with BafA1. Subsequently, cells were fixed and stained with Hoechst (blue). The insets on the right side show magnifications of the boxed areas. Scale bar: 30 μm.
The result from the tandem assay clearly indicates that Rab7a and Rab7b have different functions in autophagy. This is in line with the roles of these two small GTPases in different intracellular pathways, where Rab7a controls degradative pathways toward late endosomes and lysosomes while Rab7b is responsible for late endosome‐to‐Golgi retrograde transport 11, 30, 31.
Taken together, these results show that neither fusion nor acidification of autophagosomes is affected by Rab7b depletion, refuting the possibility that a block in autophagosomal degradation is causing the increased size of autophagic structures. The increase in size, together with the accumulation of LC3‐II, is, however, in line with an increase in autophagic flux in Rab7b‐depleted cells.
Using LC3 to study flux is a measure of the amount of lipidated LC3 (LC3‐II), thus excluding autophagosomal membranes that do not contain LC3. There is accumulating evidence that LC3‐II is involved in several non‐autophagic processes via interactions with non‐autophagy‐related proteins 32. Also, macroautophagy progresses normally in the absence of autophagic–lysosomal LC3 flux as well as independently of all LC3 isoforms 33, 34. Therefore, to assess whether Rab7b depletion increases the autophagic cargo flux, we measured the bulk degradation of long‐lived proteins (LLPD) as an end‐point assay for autophagic activity 35. This overcomes the limitations of only studying a single autophagic marker such as LC3.
Rab7b depletion led to a significant augmentation of starvation‐induced LLPD, as well as of that induced by treatment with the mTOR inhibitor Torin1 (Fig 4D). This effect was associated with lysosomal rather than proteasomal degradation, since Rab7b depletion did not elevate LLPD in the presence of the lysosomal inhibitor BafA1. As expected, LLPD was strongly reduced by knockdown of a critical component of the autophagic machinery, FAK family kinase‐interacting protein of 200 kDa (FIP200) 36, or by knockdown of Rab7a (Fig EV5A) 28, 29. This further confirms the differential functions of Rab7a and Rab7b also in autophagy and demonstrates that Rab7b depletion increases bulk autophagic cargo flux all the way to completion of the process.
Figure EV5. Effect of Rab7a or FIP200 depletion on LLPD and LDH sequestration.
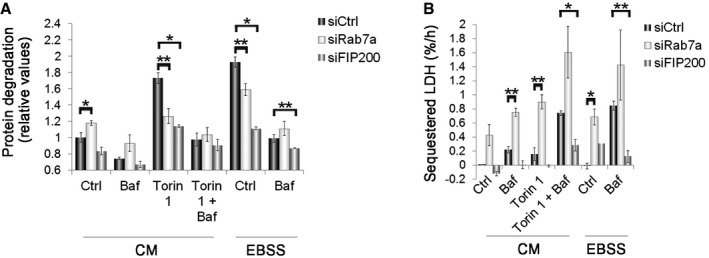
- U2OS cells transfected with control siRNA or siRNA against Rab7a or FIP200 were subjected to a LLPD assay. The quantification of the degradation rate for long‐lived proteins is presented as mean ± s.e.m. of at least three independent experiments.
- U2OS cells transfected with control siRNA or siRNA against Rab7a or FIP200 were subjected to a LDH sequestration assay. In the graph, the net sequestered LDH per hour (%/h) is represented as mean ± s.e.m. of at least three independent experiments.
Rab7b depletion increases autophagic sequestration
The increase in LC3 flux and LLPD after Rab7b knockdown, together with the increase in size of LC3‐positive vesicles, suggests that sequestration of content into autophagosomes should also be increased. To investigate this, we measured the transfer of the autophagic cargo marker enzyme lactate dehydrogenase (LDH) from the cytosol to autophagosomes 36. In this assay, BafA1 is added to prevent autolysosomal degradation of LDH, thus allowing the assessment of autophagic sequestration activity per se, instead of the net effect of autophagic sequestration and degradation.
Rab7b depletion led to a significant increase in LDH sequestration under starvation conditions, as well as after treatment with Torin1 (more than 1.5‐fold increase and twofold increase respectively; Fig 4E). Expression of HA‐Rab7b after Rab7b silencing significantly reversed the effect of Rab7b depletion on LDH sequestration, demonstrating the specificity of the Rab7b siRNA (Fig 4E). Of note, we observed a tendency of increased LDH sequestration after Rab7b knockdown also under basal conditions, although this was not statistically significant (P = 0.1138; Fig 4E). As controls, we observed a strong reduction in LDH sequestration upon knockdown of FIP200 and increase after Rab7a silencing (Fig EV5B).
The increase in cytosolic protein sequestration and degradation, as well as in the size, but not in the number of autophagosomes after Rab7b depletion, suggests that Rab7b functions in the step after phagophore initiation but prior to autophagosome completion (since sequestration activity is affected). This is also supported by the immuno‐EM results, showing that Rab7b is present on both the outer and inner membranes of the autophagosomes (Figs 2D and EV1D).
The amount of Atg8, the yeast orthologue of LC3, has been shown to regulate the level of autophagy by specifically modulating autophagosome size, whereas the number of autophagosomes was unaffected 37. Separate studies show that LC3 is involved in expansion of the phagophore membrane 38. As Rab7b interacts with Atg4B, a protease that modulates LC3, we speculated that Rab7b regulates LC3 processing and thereby the size of the autophagosomes through this interaction. If true, then the earlier steps in the autophagic pathway such as initiation should not be affected.
To investigate this, we immunostained cells depleted of Rab7b with the early autophagic marker WD repeat domain, phosphoinositide interacting 2 (WIPI2) that functions in the progression of omegasomes into autophagosomes 39. WIPI2 is required for the formation of LC3‐positive autophagosomes and dissociates from these structures before they mature 39. As expected, we observed an increase in both the number and size of WIPI2 spots after autophagy induction, but this effect was not Rab7b‐dependent (Fig 4F–H). These results therefore indicate that Rab7b depletion does not affect the induction or initiation of the autophagic process.
Taken together with the results from the sequestration assay and immuno‐EM, this finding strongly indicates that the change in size of autophagic structures observed after Rab7b depletion is caused by an effect downstream of autophagosome initiation but upstream of autophagosome completion. Notably, this interval in the autophagic pathway includes the expansion of the phagophore.
Rab7b regulates Atg4B activity
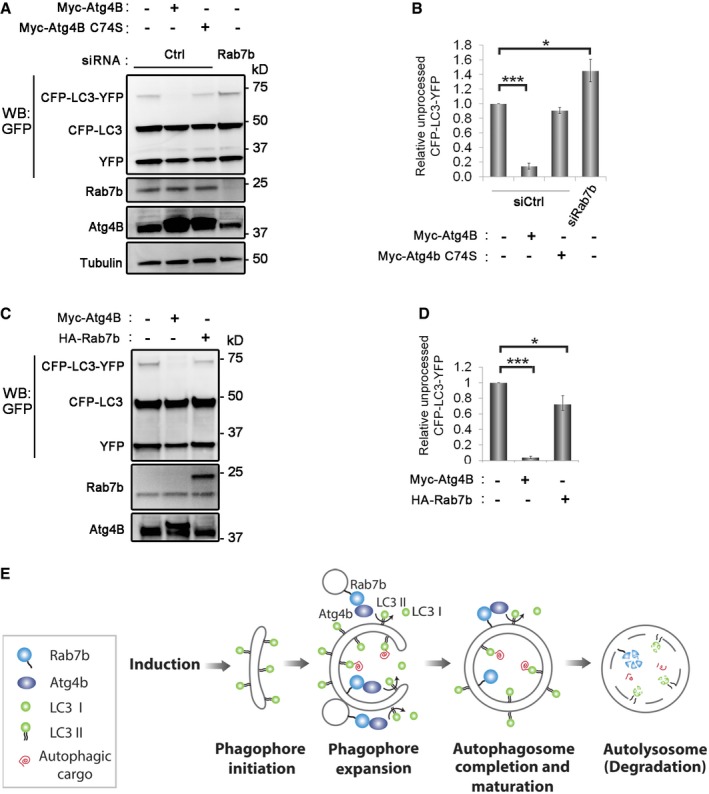
To determine whether Rab7b is able to regulate Atg4B activity, we used a recombinant LC3 construct tagged with an N‐terminal YFP tag and a C‐terminal CFP tag to assess LC3 cleavage 15, 40, 41. As expected, overexpression of wild‐type Atg4B increased LC3 processing 16, while the inactive mutant Atg4B C74S had no effect 15, 16. Strikingly, unprocessed LC3 increased by ~1.5‐fold in siRNA Rab7b cells, indicating a decrease in Atg4B activity (Fig 5A and B). In line with this result, overexpression of Rab7b increased the processing of LC3 by almost 30% (Fig 5C and D). Together, our findings suggest that Rab7b can interact with and activate Atg4B.
Figure 5. Rab7b modulates Atg4B activity.
-
A, BU2OS cells treated with control siRNA or siRNA against Rab7b and transfected with CFP‐LC3‐YFP were starved and lysed. Two controls were in addition transfected with either myc‐Atg4B or myc‐Atg4B C74S catalytic mutant. (A) Cell lysates were subjected to Western blot analysis with antibodies against tubulin (loading control), GFP, Rab7b, and Atg4B. (B) The relative amount of unprocessed CFP‐LC3‐YFP was quantified, and data are represented as mean ± s.e.m. of five independent experiments.
-
CCell lysates from U2OS cells transfected with either CFP‐LC3‐YFP alone or together with myc‐Atg4B or HA‐Rab7b and starved were subjected to Western blot analysis with antibodies against GFP, Rab7b, and Atg4B.
-
DThe relative amount of unprocessed CFP‐LC3‐YFP was quantified, and data are represented as mean ± s.e.m. of four independent experiments.
-
EModel illustrating the role of Rab7b in the autophagic pathway: Rab7b does not affect the initial assembly and maturation of the phagophore. Thus, during the initial stages of autophagosome formation, the phagophore can freely acquire and maintain lipidated LC3, which promotes phagophore expansion. Upon interaction of the expanded, LC3‐decorated phagophore with Rab7b‐containing vesicles, Atg4B is recruited and activated, leading to delipidation of LC3 and thus to a local depletion of LC3 and reduced phagophore expansion.
Our data on LC3‐lipidation in Rab7b‐depleted cells suggest that this Rab is necessary for maximal Atg4B delipidation activity and that this is the effect of the Rab7b–Atg4B interaction in autophagy. Even though reduction in Atg4B protease activity upon depletion of Rab7b might be expected to reduce the production of LC3‐I from pro‐LC3, this does not appear to be rate‐limiting for LC3‐II levels, which are actually increased upon Rab7b depletion. This occurs also in the presence of BafA1, demonstrating that the increase in LC3‐II after Rab7b knockdown is not due to decreased LC3 degradation. Thus, the most likely explanation is that Rab7b depletion reduces Atg4B delipidation activity, leading to an increase in LC3‐II. Interaction between Rab7b‐ and LC3‐positive puncta further indicates that the effect of Rab7b on autophagy is on lipidated LC3.
Altogether, our results support a model where Rab7b enters the autophagic pathway after autophagosome initiation, but prior to autophagosome completion, regulating phagophore expansion and autophagic flux by altering LC3 processing through modulation of Atg4B activity (Fig 5E). This is in line with previous studies showing that LC3 is involved in expansion of the phagophore membrane 38.
The association between Rab7b and mature phagophores may mark a decision point between phagophore closure and continued expansion. This could explain why depletion of Rab7b leads to production of larger autophagosomes, which not only contain more LC3‐II, but also carry more sequestered cytosol and more bulk cargo. In summary, we suggest that Rab7b—via the interaction with Atg4B—plays a role in limiting the expansion of the forming autophagosome, and thus in limiting the amount of non‐selective degradation of cytoplasm during autophagy.
Materials and Methods
Cell culture
U2OS cells were obtained from ATCC. U2OS GFP‐LC3 and U2OS mRFP‐EGFP‐LC3 stable cell lines are a kind gift from Tassula Proikas‐Cezanne (Eberhard Karls University Tübingen, Germany) and Jeff MacKeigan (Van Andel Research Institute, MI, United States), respectively. All cells were grown in Dulbecco's modified Eagle's medium (DMEM; Lonza, BioWhittaker) supplemented with 10% fetal calf serum (FCS), 2 mM l‐glutamine, 100 U/ml penicillin, and 100 μg/ml streptomycin, referred to as CM. For starvation in nutrient‐depleted medium, the cells were incubated in EBSS (Gibco, Life Technologies) for 2 h. BafA1 (AH Diagnostics) was used at 100 nM and Torin1 (R&D Systems) at 50 nM.
Blood components (buffy coats) from healthy blood donors were obtained from the local blood bank (Ullevål University Hospital, Oslo, Norway) according to the guidelines of the local blood bank approved by the Norwegian Regional Committee for Medical Research Ethics. Mononuclear cells were isolated through density gradient centrifugation by using Lymphoprep (Axis Shield). MDDCs were generated through culture for 6 days in RPMI media containing 100 ng/ml granulocyte–macrophage colony‐stimulating factor (GM‐CSF; Immunotools) and 20 ng/ml IL‐4 (Invitrogen, Life Technologies) supplemented with 10% FCS, 2 mM l‐glutamine, 100 U/ml penicillin, and 100 μg/ml streptomycin.
Constructs and antibodies
pEGFP‐Rab7b wt, pEGFP‐Rab7b Q67L, pEGFP‐Rab7b T22N, pcDNA‐2XHA‐Rab7b wt, pcDNA‐2XHA‐Rab7b Q67L, pcDNA‐mCherry‐Rab7b, pGBKT7‐Rab7b∆C, pET16b His‐Rab7b Q67L, pET16b His‐Rab9 wt, and pET16b His‐Rab9 Q66L have been described previously 11, 12, 13. pCMV6‐Myc‐DDK ATG4B was purchased from OriGene, and a mutation present in this construct (Q in position 354 instead of L) was corrected with the QuikChange II XL Site‐Directed Mutagenesis Kit (Agilent Technologies) using the following primers: sense, 5′‐tgagctggtggagctgcagccttcacatc‐3′; antisense, 5′‐gatgtgaaggctgcagctccaccagctca‐3′. pCMV6‐AC‐GFP‐ATG4B was constructed by cutting Atg4B from pCMV6‐Myc‐DDK ATG4B with BamHI and XhoI. The insert was cloned into the BamHI and XhoI restriction sites of the pCMV6‐AC‐GFP vector (OriGene). pDest‐mCherry‐LC3B was described previously 42. Myc‐Atg4B C74S and pDest‐ECFP‐LC3‐EYFP were a kind gift from Terje Johansen (University of Tromsø, Norway). Primary antibodies used in the experiments were mouse anti‐Rab7b (H00338382‐M01, Abnova, 1:50), rabbit anti‐Rab7a (#2094S, Cell Signaling, 1:200), rabbit anti‐LC3B for Western blotting (cat. # 2775S, Cell Signaling Technology, 1:1,000), mouse anti‐EEA1 (#610456, BD Biosciences, 1:200), rabbit anti‐LC3B for immunofluorescence (PM036, MBL/Nordic Biosite, 1:500), rabbit anti‐Atg4B (ab72201, Abcam, 1:50), rabbit anti‐HA (ab9110, Abcam, 1:200), mouse anti‐HA (#901502, Biolegend, 1:50), mouse anti‐c‐Myc [9E10] (ab32, Abcam, 1:500), mouse anti‐WIPI2 (MCA5780GA, AbD Serotec, 1:100), mouse anti‐tubulin (13‐8000, Life Technologies, 1:12,000), rabbit anti‐GFP (ab6556, Abcam, 1:100 for EM), and mouse anti‐His (MCA1396, AbD Serotec, 1:10,000). The H4A3 anti‐Lamp antibody (1:1,000), developed by Dr. David R. Soll, c/o DSHB, was obtained from the Developmental Studies Hybridoma Bank, created by the NICHD of the NIH and maintained at The University of Iowa, Department of Biology, Iowa City, IA 52242. Mouse‐IgG1 (×0931, Dako, 1:50) was used as negative controls for co‐IP. Alexa Flour® secondary antibodies (Invitrogen) were used for immunofluorescence analysis at 1:200 dilution. Hoechst (H3569; Life Technologies) was used at 0.2 μg/ml. Secondary antibodies conjugated with horseradish peroxidase (GE Healthcare) were used at 1:5,000 for immunoblotting.
Transfection and RNA interference
Cells were transiently transfected at ~70% confluency using FuGENE 6 (ProMega) according to the manufacturer's protocol for 24 h. Transfection of cells with siRNA was done using the Lipofectamine RNAiMAX Transfection Reagent (Life Technologies) according to the manufacturer's protocol. Briefly, the cells were plated the day prior to transfection and transfected at ~50% confluency, and the experiments were performed 72 h after transfection.
For RNAi depletion studies, we used the following nucleotides from MWG‐Biotech (Ebersberg, Germany):
Rab7a sense sequence 5′‐GGAUGACCUCUAGGAAGAATT‐3′; antisense sequence 5′‐UUCUUCCUAGAGGUCAUCCTT‐3′. As negative control, we used the sense sequence 5′‐ACUUCGAGCGUGCAUGGCUTT‐3′; antisense 5′‐AGCCAUGCACGCUCGAAGUTT‐3′. Rab7b siRNAs were bought from Qiagen (FlexiTube siRNA; Rab7b siRNA #1, cat. no. SI00160041; Rab7b siRNA #2, cat. no. S100160055; Rab7b siRNA #3, cat. no. S103036502). FIP200 siRNA was from Ambion (Silencer Select, cat. no. 4427037‐s18995).
Yeast two‐hybrid screen
A yeast two‐hybrid screen of a human bone marrow cDNA library using Rab7b as bait was performed by DKFZ (German Cancer Research Center) 43.
Co‐IP and pulldown experiments
Dynabead protein G (Life Technologies) was used according to the manufacturer's protocol for IP experiments. Dynabeads (0.6 μg) were washed with RIPA buffer and incubated with anti‐c‐Myc or IgG1 as negative control with end‐over‐end rotation for 60 min at room temperature. After washing, precleared cell lysates were added to the beads and incubated with end‐over‐end rotation for 90 min. Immunoprecipitated samples were loaded on SDS–PAGE gels and analyzed by Western blotting.
GPF‐Trap®_MA for IP of GFP‐fusion proteins (Chromotek) was used according to manufacturer's protocol. For pulldown experiments, His‐tagged Rab proteins were expressed in Escherichia coli BL21 (DE3) (Agilent Technologies) after induction with 0.5 mM IPTG for 4 h at 22°C and purified from the bacterial soluble fraction using His‐tagged isolation Dynabeads (Life Technologies) according to the manufacturer's protocol. Purified proteins (50 μg) were loaded with 0.1 mM GTPγS, bound to Dynabeads, and incubated with precleared cell lysates for 30 min at 4°C and then washed six times with buffer containing 3.25 mM sodium phosphate, pH 7.4, 70 mM NaCl, and 0.01% Tween‐20. Bound proteins were eluted with elution buffer (50 mM sodium phosphate, pH 8.0, 300 mM NaCl, 0.01% Tween‐20, 300 mM imidazole) and analyzed by SDS–PAGE and immunoblotting.
Western blot experiments
For Western blot experiments, proteins were separated by SDS–PAGE, transferred onto a polyvinylidene fluoride (PVDF) membrane (Millipore), and probed with each primary antibody diluted in 2% blotting‐grade non‐fat dry milk (Bio‐Rad) followed by washing and incubation in horseradish peroxidase (HRP)‐conjugated secondary antibodies (GE Healthcare). Proteins were visualized either by using the ECL system (GE Healthcare) and band intensity quantified by densitometry analysis with ImageQuant TL software (GE Healthcare) or by using SuperSignal solution (Thermo Scientific) followed by CCD camera imaging (Kodak Image Station 4000R) and analyzed with the Carestream software.
Quantification of the relative amount of unprocessed CFP‐LC3‐YFP was performed by densitometry, and it was calculated by dividing the amount of uncleaved LC3 (CFP‐LC3‐YFP) by the sum of both uncleaved and cleaved LC3 (CFP‐LC3‐YFP + CFP‐LC3).
Immunofluorescence and live‐cell microscopy
Cells grown on coverslips were fixed with 3% paraformaldehyde, quenched with 50 mM NH4Cl, permeabilized with 0.25% saponin in PBS 1×, blocked with 5% FCS, and incubated for 20 min at room temperature with primary antibodies. After washing with 0.25% saponin, coverslips were incubated with the appropriate secondary antibody for 20 min in darkness at room temperature. The DuoLink samples were prepared according to the DuoLink Kit protocol provided by the manufacturer (Sigma‐Aldrich). Mounted coverslips were examined by using a 60× PlanApo NA 1.4 objective on an Olympus FluoView 1000 confocal laser scanning microscope BX61WI (upright) with the FV1000 software or by using a 60× PlanApo NA 1.35 on an Olympus FluoView 1000 confocal laser scanning microscope IX81 (inverted). For live‐imaging experiments, cells were grown on MatTek glass‐bottomed dishes. Live cells were imaged with a 60× objective NA 1.42 on a CSU22 spinning‐disk confocal unit (Yokogawa), an Ixon EMCCD camera (Andor), and the Andor iQ1.8 software. During imaging, cells were kept at 37°C under 5% CO2 in an incubation chamber (Solent Scientific).
Image processing and analysis
Image processing and analysis for all 2D imaging was performed using ImageJ/Fiji. A mask was manually created for each image if needed to select a region of interest. Median background subtraction was used for the analysis of endogenous LC3. Particles were counted using the Particle Analyzer after setting the threshold manually. Particles smaller than 2 pixels and bigger than 50–70 pixels were excluded.
For the quantification of the tandem mRFP‐GFP‐LC3 fluorescence assay, the RFP channel was used to set the threshold. Particles above threshold were selected and the intensity of the GFP channel within these particles measured after background subtraction. Particles having intensity above the background intensity (measured by GFP channel intensity frequency distribution and intensity in selected noise and signal areas) were quantified and assigned as autophagosomes (non‐acidic). The number of autolysosomes was calculated by subtracting the number of autophagosomes (GFP‐positive) from the total number of RFP‐LC3‐GFP structures (RFP‐positive).
For the count of LC3 spots stained using anti‐LC3 antibody, the number of autophagosomes also positive for Lamp‐1 was estimated by the same method as used in the tandem assay (object‐based co‐localization). Particles positive for LC3 were selected by thresholding, and those having Lamp‐1 intensity above the background value were measured.
For time‐lapse imaging, tracking of vesicles was done using the ImageJ Manual Tracking plug‐in. Imaris software was used for 3D reconstruction.
Transmission electron microscopy
Ultrastructural analysis
Cells were incubated with BSA‐gold 5 nm (at O.D. 5) during a 4‐h pulse, followed by a 2‐h chase, in order to load late endosomes and lysosomes. After a 2‐h incubation in EBSS to induce starvation, cells were fixed with 1% glutaraldehyde in 200 mM HEPES, pH 7.4 overnight. Cells were scraped and embedded in 1% low‐melting‐point agarose, and blocks were postfixed with 2% osmium tetroxide for 2 h, contrasted with 1% tannin for 30 min and with 2% uranyl acetate for 2 h. After dehydration with a graded ethanol series, cells were progressively infiltrated with epoxy resin, followed by overnight incubation at 60–70°C to cure the resin. Sections (70 nm) were contrasted with 0.1% lead citrate for 15 s before imaged in the TEM. For a relative comparison of the autophagosome size in control and Rab7b‐knocked‐down samples, images of autophagosomes were collected by systematic uniform random sampling on five different thin sections, representing different cell populations, for each sample. Cross‐points of the stereological test grid over autophagosomes were counted to obtain an estimate for the average size of the autophagosomal profile.
Immunogold labeling on thin Tokuyasu thawed cryosections
Immunogold labeling and EM analysis of GFP‐LC3 stable U2OS cells transiently transfected with HA‐Rab7b were performed as described in 44. For double labeling, sections were first labeled with rabbit anti‐GFP (Abcam) at 1:100 and protein A gold 5 nm (Cell Microscopy Center, UMC) at 1:50, followed by anti‐HA (Biolegend) at 1:50 and protein A gold 10 nm (Cell Microscopy Center, UMC) at 1:50. Sections were analyzed with a JEM‐1400 TEM microscope (Jeol), and images were recorded with TemCam‐F216 camera using EM MENU software (both from Tvips).
Degradation of long‐lived proteins
Cells were seeded in 24‐well plates and radiolabeled with 0.02 μCi [14C]‐valine (Perkin Elmer, NEC291EU050UC) in 0.5 ml complete RPMI 1640 (with 10% FBS) for 2 days. Cells were washed with 0.5 ml PBS/2.5% FBS to remove unincorporated radioactivity and chased in 0.5 ml complete RPMI 1640 supplemented with 10 mM cold valine (Sigma, V0513) for 18 h. Next, short‐lived protein degradation products were washed out with either 0.5 ml complete RPMI 1640 or EBSS, followed by incubation in 0.25 ml of either complete RPMI 1640 or EBSS (both supplemented with 10 mM cold valine) with various treatments for another 3 h. Plates were cooled down prior to the addition of 50 μl ice‐cold PBS w/2% BSA (Sigma, A7030) and 200 μl ice‐cold 25% TCA (Sigma, T0699) before shaking overnight at 4°C. The well contents were transferred to Eppendorf tubes and sedimented by centrifugation at 5,000 × g for 10 min at 4°C. Precipitates were resolubilized in both wells and tubes in a total of 0.5 ml 0.2 M KOH (Sigma, 221473). Radioactivity was determined both in the supernatant (the TCA‐soluble fraction, containing [14C]‐valine from degraded proteins) and in the pellet fraction by liquid scintillation counting. The degradation rate for long‐lived proteins was calculated as the percentage of radioactivity in the TCA‐soluble fraction relative to the total radioactivity in the TCA‐soluble and non‐soluble fractions, divided by the incubation time.
Measurement of autophagic sequestration activity
Cells were seeded in 6‐well plates, and the activity of autophagic sequestration was measured as the transfer of the cytosolic enzyme LDH to sedimentable autophagic vacuoles, in the presence of 200 nM BafA1 (Enzo, BML‐CM110) with or without starvation (in EBSS medium) for 3 h as previously described 45. Instead of using the high‐density cushion for separating soluble from the sedimentable LDH, the disruptate was diluted 2.5 times with resuspension buffer (50 mM sodium phosphate, 1 mM EDTA, 1 mM DTT) containing 0.5% BSA and 0.01% Tween‐20 and sedimented it for 50 min at 20,000 × g (Beckman Coulter Microfuge 22R). Subsequent steps in processing and LDH measurement were as previously described. After accounting for the dilution factors and calculating the ratio of sedimentable over soluble LDH, the final values presented are net sequestered LDH per hour (%/h), where the background value has been subtracted (LDH amount found in untreated/control samples) and incubation time accounted for 36, 45.
Statistical analysis
Statistical differences unless otherwise stated were assessed by two‐tailed paired Student's t‐test (Excel software). In the figures, statistical significance is indicated as follows: *P < 0.05, **P < 0.01, and ***P < 0.001.
Author contributions
IK performed most of the experiments with assistance from MBD on some experiments. MBD performed co‐IP experiments, FS carried out LDH and LLPD assays, UR performed EM experiments, and CP carried out pulldown. ATJ contributed with the yeast two‐hybrid results. IK, MBD, FS, UR, PH, ATJ, NE, AS, OB and CP contributed in designing experiments, analyzing data, and discussing the results. OB and CP supervised the work. IK and CP wrote the manuscript with input from all authors.
Conflict of interest
The authors declare that they have no conflict of interest.
Supporting information
Expanded View Figures PDF
Movie EV1
Movie EV2
Movie EV3
Review Process File
Acknowledgements
We thank Catherine Anne Heyward, Frode Skjeldal (University of Oslo, Norway), Manfred Koegl, and Frank Schwarz (DKFZ, Germany) for technical assistance; Zvulun Elazar (Weizmann Institute of Science, Israel) for critical reading of the manuscript; and Gareth Griffiths (University of Oslo, Norway) for discussions concerning the EM data. We also thank the NorMIC Oslo imaging platform and the Electron Microscopy Unit for Biological Sciences, Department of Biosciences, University of Oslo. pDEST‐CFP‐LC3B‐YFP and pDEST‐myc‐ATG4B C74S were generous gifts from Mads Skytte Rasmussen and Terje Johansen (University of Tromsø—The Arctic University of Norway). The financial support of the Norwegian Cancer Society [grants 5760850 to C.P. and 4604944 to O.B.], the Leukaemia Research Fund [Grant 04075 to A.T.J.], and the Research Council of Norway [grants 239903 to C.P., 230779 to O.B., and through its Centre of Excellence Funding Scheme, project number 179573] is gratefully acknowledged.
EMBO Reports (2017) 18: 1727–1739
Contributor Information
Oddmund Bakke, Email: oddmund.bakke@ibv.uio.no.
Cinzia Progida, Email: c.a.m.progida@ibv.uio.no.
References
- 1. Boya P, Reggiori F, Codogno P (2013) Emerging regulation and functions of autophagy. Nat Cell Biol 15: 713–720 [DOI] [PMC free article] [PubMed] [Google Scholar]
- 2. Mizushima N (2009) Physiological functions of autophagy. Curr Top Microbiol Immunol 335: 71–84 [DOI] [PubMed] [Google Scholar]
- 3. Abada A, Elazar Z (2014) Getting ready for building: signaling and autophagosome biogenesis. EMBO Rep 15: 839–852 [DOI] [PMC free article] [PubMed] [Google Scholar]
- 4. Choi AM, Ryter SW, Levine B (2013) Autophagy in human health and disease. N Engl J Med 368: 1845–1846 [DOI] [PubMed] [Google Scholar]
- 5. Rubinsztein DC, Shpilka T, Elazar Z (2012) Mechanisms of autophagosome biogenesis. Curr Biol 22: R29–R34 [DOI] [PubMed] [Google Scholar]
- 6. Stenmark H (2009) Rab GTPases as coordinators of vesicle traffic. Nat Rev Mol Cell Biol 10: 513–525 [DOI] [PubMed] [Google Scholar]
- 7. Pfeffer SR (2013) Rab GTPase regulation of membrane identity. Curr Opin Cell Biol 25: 414–419 [DOI] [PMC free article] [PubMed] [Google Scholar]
- 8. Ao X, Zou L, Wu Y (2014) Regulation of autophagy by the Rab GTPase network. Cell Death Differ 21: 348–358 [DOI] [PMC free article] [PubMed] [Google Scholar]
- 9. Szatmari Z, Sass M (2014) The autophagic roles of Rab small GTPases and their upstream regulators: a review. Autophagy 10: 1154–1166 [DOI] [PMC free article] [PubMed] [Google Scholar]
- 10. Yang M, Chen T, Han C, Li N, Wan T, Cao X (2004) Rab7b, a novel lysosome‐associated small GTPase, is involved in monocytic differentiation of human acute promyelocytic leukemia cells. Biochem Biophys Res Commun 318: 792–799 [DOI] [PubMed] [Google Scholar]
- 11. Progida C, Cogli L, Piro F, De Luca A, Bakke O, Bucci C (2010) Rab7b controls trafficking from endosomes to the TGN. J Cell Sci 123: 1480–1491 [DOI] [PubMed] [Google Scholar]
- 12. Progida C, Nielsen MS, Koster G, Bucci C, Bakke O (2012) Dynamics of Rab7b‐dependent transport of sorting receptors. Traffic 13: 1273–1285 [DOI] [PubMed] [Google Scholar]
- 13. Borg M, Bakke O, Progida C (2014) A novel interaction between Rab7b and actomyosin reveals a dual role in intracellular transport and cell migration. J Cell Sci 127: 4927–4939 [DOI] [PMC free article] [PubMed] [Google Scholar]
- 14. Hemelaar J, Lelyveld VS, Kessler BM, Ploegh HL (2003) A single protease, Apg4B, is specific for the autophagy‐related ubiquitin‐like proteins GATE‐16, MAP1‐LC3, GABARAP, and Apg8L. J Biol Chem 278: 51841–51850 [DOI] [PubMed] [Google Scholar]
- 15. Kabeya Y, Mizushima N, Yamamoto A, Oshitani‐Okamoto S, Ohsumi Y, Yoshimori T (2004) LC3, GABARAP and GATE16 localize to autophagosomal membrane depending on form‐II formation. J Cell Sci 117: 2805–2812 [DOI] [PubMed] [Google Scholar]
- 16. Tanida I, Sou YS, Ezaki J, Minematsu‐Ikeguchi N, Ueno T, Kominami E (2004) HsAtg4B/HsApg4B/autophagin‐1 cleaves the carboxyl termini of three human Atg8 homologues and delipidates microtubule‐associated protein light chain 3‐ and GABAA receptor‐associated protein‐phospholipid conjugates. J Biol Chem 279: 36268–36276 [DOI] [PubMed] [Google Scholar]
- 17. Kuang E, Okumura CY, Sheffy‐Levin S, Varsano T, Shu VC, Qi J, Niesman IR, Yang HJ, Lopez‐Otin C, Yang WY et al (2012) Regulation of ATG4B stability by RNF5 limits basal levels of autophagy and influences susceptibility to bacterial infection. PLoS Genet 8: e1003007 [DOI] [PMC free article] [PubMed] [Google Scholar]
- 18. Yang Z, Wilkie‐Grantham RP, Yanagi T, Shu CW, Matsuzawa S, Reed JC (2015) ATG4B (Autophagin‐1) phosphorylation modulates autophagy. J Biol Chem 290: 26549–26561 [DOI] [PMC free article] [PubMed] [Google Scholar]
- 19. Scherz‐Shouval R, Shvets E, Fass E, Shorer H, Gil L, Elazar Z (2007) Reactive oxygen species are essential for autophagy and specifically regulate the activity of Atg4. EMBO J 26: 1749–1760 [DOI] [PMC free article] [PubMed] [Google Scholar]
- 20. Soderberg O, Gullberg M, Jarvius M, Ridderstrale K, Leuchowius KJ, Jarvius J, Wester K, Hydbring P, Bahram F, Larsson LG et al (2006) Direct observation of individual endogenous protein complexes in situ by proximity ligation. Nat Methods 3: 995–1000 [DOI] [PubMed] [Google Scholar]
- 21. Yla‐Anttila P, Mikkonen E, Happonen KE, Holland P, Ueno T, Simonsen A, Eskelinen EL (2015) RAB24 facilitates clearance of autophagic compartments during basal conditions. Autophagy 11: 1833–1848 [DOI] [PMC free article] [PubMed] [Google Scholar]
- 22. Wang Y, Chen T, Han C, He D, Liu H, An H, Cai Z, Cao X (2007) Lysosome‐associated small Rab GTPase Rab7b negatively regulates TLR4 signaling in macrophages by promoting lysosomal degradation of TLR4. Blood 110: 962–971 [DOI] [PubMed] [Google Scholar]
- 23. Yamamoto A, Tagawa Y, Yoshimori T, Moriyama Y, Masaki R, Tashiro Y (1998) Bafilomycin A1 prevents maturation of autophagic vacuoles by inhibiting fusion between autophagosomes and lysosomes in rat hepatoma cell line, H‐4‐II‐E cells. Cell Struct Funct 23: 33–42 [DOI] [PubMed] [Google Scholar]
- 24. Lucocq JM, Hacker C (2013) Cutting a fine figure: on the use of thin sections in electron microscopy to quantify autophagy. Autophagy 9: 1443–1448 [DOI] [PubMed] [Google Scholar]
- 25. Mizushima N, Yoshimori T, Levine B (2010) Methods in mammalian autophagy research. Cell 140: 313–326 [DOI] [PMC free article] [PubMed] [Google Scholar]
- 26. Slobodkin MR, Elazar Z (2013) The Atg8 family: multifunctional ubiquitin‐like key regulators of autophagy. Essays Biochem 55: 51–64 [DOI] [PubMed] [Google Scholar]
- 27. Kimura S, Noda T, Yoshimori T (2007) Dissection of the autophagosome maturation process by a novel reporter protein, tandem fluorescent‐tagged LC3. Autophagy 3: 452–460 [DOI] [PubMed] [Google Scholar]
- 28. Gutierrez MG, Munafo DB, Beron W, Colombo MI (2004) Rab7 is required for the normal progression of the autophagic pathway in mammalian cells. J Cell Sci 117: 2687–2697 [DOI] [PubMed] [Google Scholar]
- 29. Jager S, Bucci C, Tanida I, Ueno T, Kominami E, Saftig P, Eskelinen EL (2004) Role for Rab7 in maturation of late autophagic vacuoles. J Cell Sci 117: 4837–4848 [DOI] [PubMed] [Google Scholar]
- 30. Guerra F, Bucci C (2016) Multiple roles of the small GTPase Rab7. Cells 5: E34 [DOI] [PMC free article] [PubMed] [Google Scholar]
- 31. Bucci C, Bakke O, Progida C (2010) Rab7b and receptors trafficking. Commun Integr Biol 3: 401–404 [DOI] [PMC free article] [PubMed] [Google Scholar]
- 32. Subramani S, Malhotra V (2013) Non‐autophagic roles of autophagy‐related proteins. EMBO Rep 14: 143–151 [DOI] [PMC free article] [PubMed] [Google Scholar]
- 33. Engedal N, Seglen PO (2016) Autophagy of cytoplasmic bulk cargo does not require LC3. Autophagy 12: 439–441 [DOI] [PMC free article] [PubMed] [Google Scholar]
- 34. Szalai P, Hagen LK, Saetre F, Luhr M, Sponheim M, Overbye A, Mills IG, Seglen PO, Engedal N (2015) Autophagic bulk sequestration of cytosolic cargo is independent of LC3, but requires GABARAPs. Exp Cell Res 333: 21–38 [DOI] [PubMed] [Google Scholar]
- 35. Klionsky DJ, Abdelmohsen K, Abe A, Abedin MJ, Abeliovich H, Acevedo Arozena A, Adachi H, Adams CM, Adams PD, Adeli K et al (2016) Guidelines for the use and interpretation of assays for monitoring autophagy (3rd edition). Autophagy 12: 1–222 [DOI] [PMC free article] [PubMed] [Google Scholar]
- 36. Seglen PO, Luhr M, Mills IG, Saetre F, Szalai P, Engedal N (2015) Macroautophagic cargo sequestration assays. Methods 75: 25–36 [DOI] [PubMed] [Google Scholar]
- 37. Xie Z, Nair U, Klionsky DJ (2008) Atg8 controls phagophore expansion during autophagosome formation. Mol Biol Cell 19: 3290–3298 [DOI] [PMC free article] [PubMed] [Google Scholar]
- 38. Weidberg H, Shvets E, Shpilka T, Shimron F, Shinder V, Elazar Z (2010) LC3 and GATE‐16/GABARAP subfamilies are both essential yet act differently in autophagosome biogenesis. EMBO J 29: 1792–1802 [DOI] [PMC free article] [PubMed] [Google Scholar]
- 39. Polson HE, de Lartigue J, Rigden DJ, Reedijk M, Urbe S, Clague MJ, Tooze SA (2010) Mammalian Atg18 (WIPI2) localizes to omegasome‐anchored phagophores and positively regulates LC3 lipidation. Autophagy 6: 506–522 [DOI] [PubMed] [Google Scholar]
- 40. Fass E, Amar N, Elazar Z (2007) Identification of essential residues for the C‐terminal cleavage of the mammalian LC3: a lesson from yeast Atg8. Autophagy 3: 48–50 [DOI] [PubMed] [Google Scholar]
- 41. Scherz‐Shouval R, Sagiv Y, Shorer H, Elazar Z (2003) The COOH terminus of GATE‐16, an intra‐Golgi transport modulator, is cleaved by the human cysteine protease HsApg4A. J Biol Chem 278: 14053–14058 [DOI] [PubMed] [Google Scholar]
- 42. Pankiv S, Clausen TH, Lamark T, Brech A, Bruun JA, Outzen H, Overvatn A, Bjorkoy G, Johansen T (2007) p62/SQSTM1 binds directly to Atg8/LC3 to facilitate degradation of ubiquitinated protein aggregates by autophagy. J Biol Chem 282: 24131–24145 [DOI] [PubMed] [Google Scholar]
- 43. Mohr K, Koegl M (2012) High‐throughput yeast two‐hybrid screening of complex cDNA libraries. Methods Mol Biol 812: 89–102 [DOI] [PubMed] [Google Scholar]
- 44. Kucera A, Borg Distefano M, Berg‐Larsen A, Skjeldal F, Repnik U, Bakke O, Progida C (2016) Spatiotemporal resolution of Rab9 and CI‐MPR dynamics in the endocytic pathway. Traffic 17: 211–229 [DOI] [PubMed] [Google Scholar]
- 45. Luhr M, Szalai P, Saetre F, Gerner L, Seglen PO, Engedal N (2017) A simple cargo sequestration assay for quantitative measurement of nonselective autophagy in cultured cells. Methods Enzymol 587: 351–364 [DOI] [PubMed] [Google Scholar]
Associated Data
This section collects any data citations, data availability statements, or supplementary materials included in this article.
Supplementary Materials
Expanded View Figures PDF
Movie EV1
Movie EV2
Movie EV3
Review Process File


