Abstract
Long noncoding RNAs (lncRNAs) play roles in the development and progression of many cancers; however, the contributions of lncRNAs to human gallbladder cancer (GBC) remain largely unknown. In this study, we identify a group of differentially expressed lncRNAs in human GBC tissues, including prognosis‐associated gallbladder cancer lncRNA (lncRNA‐PAGBC), which we find to be an independent prognostic marker in GBC. Functional analysis indicates that lncRNA‐PAGBC promotes tumour growth and metastasis of GBC cells. More importantly, as a competitive endogenous RNA (ceRNA), lncRNA‐PAGBC competitively binds to the tumour suppressive microRNAs miR‐133b and miR‐511. This competitive role of lncRNA‐PAGBC is required for its ability to promote tumour growth and metastasis and to activate the AKT/mTOR pathway. Moreover, lncRNA‐PAGBC interacts with polyadenylate binding protein cytoplasmic 1 (PABPC1) and is stabilized by this interaction. This work provides novel insight on the molecular pathogenesis of GBC.
Keywords: ceRNA, gallbladder cancer, lncRNA, PAGBC, prognosis
Subject Categories: Cancer, RNA Biology, Signal Transduction
Introduction
Gallbladder carcinoma (GBC) is the most common cancer of the biliary tract and the sixth most common type of gastrointestinal cancer worldwide 1. Because of its non‐specific symptoms and highly invasive character, GBC is often detected at an advanced stage 2. Hence, only a minority of GBC patients are candidates for curative resection, and this cancer therefore carries an extremely poor prognosis. The reported mean survival for this malignancy ranges from 13.2 months to 19 months 3, 4. Although various aberrantly expressed or mutated protein‐coding genes have been identified in GBC, none have been useful for early diagnosis or for the development of targeted clinical therapies 5, 6. Therefore, an understanding of the molecular changes in GBC will be important for early diagnosis and the development of effective targeted therapies, which together will improve the prognosis of GBC patients.
In recent years, studies from different institutions have shown that long noncoding RNAs (lncRNAs) are involved in numerous physiological and pathological processes through various mechanisms 7, 8, especially in the development and progression of different carcinomas 9, 10. Thus, the investigation of the role of lncRNAs in GBC could help with the understanding of tumorigenesis and the identification of novel diagnostic and therapeutic targets. The lncRNAs work in a complicated way as critical regulators of epigenetic modulation, transcription and translation in a spatiotemporal manner 7, 8. Recently, a role of competing endogenous RNAs (ceRNAs) has been proposed. In this model, lncRNA can affect other mRNA or lncRNA transcripts by competitively binding to a miRNA response element (MRE) to influence post‐transcriptional regulation 11, 12. Until now, several lncRNAs, such as MALAT1 (metastasis‐associated lung adenocarcinoma transcript 1), have been identified in GBC 13. However, the overall functions of most lncRNAs in GBC and the detailed mechanism still remain unknown.
In this study, we identified the profile of differentially expressed lncRNAs and mRNAs in GBCs relative to paired peritumoural tissues. Among the deregulated lncRNAs, we characterized a lncRNA‐PAGBC (prognosis‐associated gallbladder cancer lncRNA) which plays a critical role in the GBC development. As a ceRNA, lncRNA‐PAGBC competitively binds to tumour suppressors, microRNA‐133b and microRNA‐511. This competitive role of lncRNA‐PAGBC is required for its ability to activate the AKT/mTOR pathway and thus promote tumour growth and metastasis. Moreover, lncRNA‐PAGBC interacts with and is stabilized by PABPC1. Our results provide novel insight into the disease mechanism of GBC and a potential therapeutic target for this malignancy.
Results
Expression profiles of lncRNAs in GBC
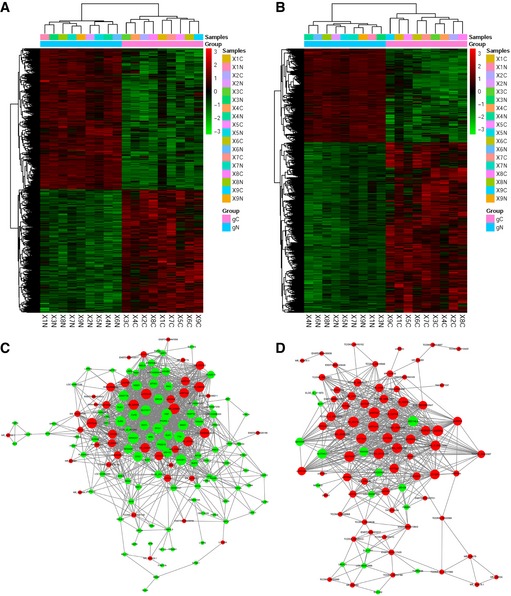
A total of 7,798 lncRNAs and 7,290 protein‐coding RNAs were identified as differentially expressed between nine pairs of GBC and non‐tumour samples. Hierarchical clustering demonstrated systematic variations in the expression levels of the lncRNAs and mRNAs between GBC and the paired non‐tumour samples (Fig EV1A and B, and Dataset EV1). The heatmaps of the top 60 lncRNAs and mRNAs that are differentially expressed in GBC were shown in Fig 1A. To validate the reliability of the microarray results, the expression of four randomly selected lncRNAs and lncRNA‐MALAT1 (an lncRNA reported to be highly expressed in GBC 13) was analysed in 26 additional pairs of GBCs and corresponding non‐tumour samples. The results confirmed that BC010117, NR_038835 and MALAT1 were highly expressed in the GBC samples, whereas AC240664.3 and ENST00000415656 were deregulated in non‐tumour samples (Fig 1B).
Figure EV1. Expanded information for differential expression of lncRNAs in GBC .
-
A, BHierarchical clustering analysis of lncRNAs (A) and protein‐coding RNAs (B) that were differentially expressed between GBC samples (c, cancer tissues) and non‐tumour samples (n, non‐tumour samples). The colour scale shown on the right illustrates the relative expression level of RNA; red represents high expression and green represents low expression.
-
CCoexpression network in GBC tissues. Red nodes represent lncRNAs, and green nodes represent protein‐coding genes.
-
DCoexpression network in non‐tumour tissues. Red nodes represent lncRNAs, and green nodes represent protein‐coding genes.
Source data are available online for this figure.
Figure 1. Differential expression of lncRNAs in GBC .
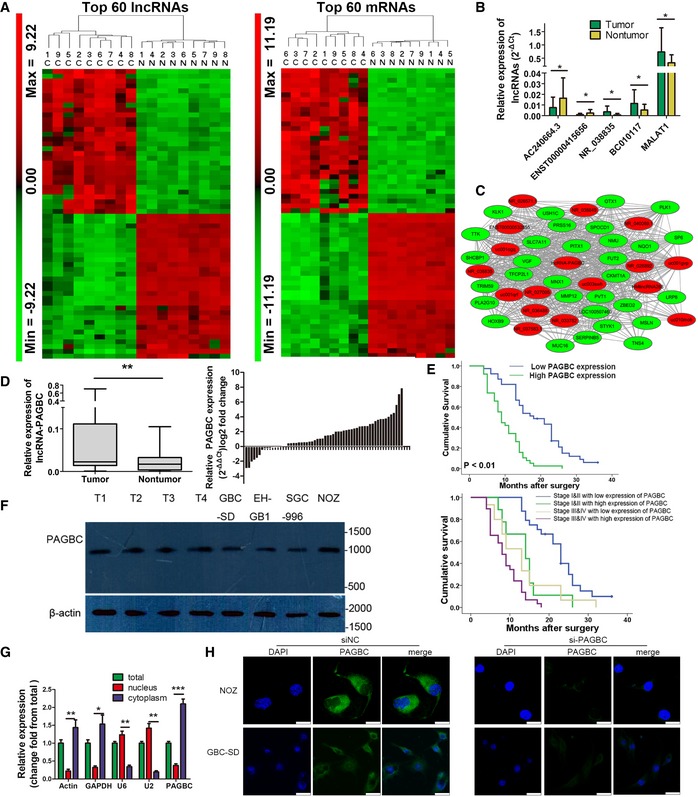
- Heatmaps of the top 60 lncRNAs (left) and protein‐coding RNAs (right) that were differentially expressed between GBC samples (c, cancer tissues) and non‐tumour samples (n, non‐tumour samples). The colour scale shown on the left illustrates the relative expression level of RNA; red represents high expression and green represents low expression.
- The differential expression of four randomly selected lncRNAs and MALAT1 in 26 paired GBC and non‐tumour samples was determined via qRT–PCR. lncRNA expression is expressed as the lncRNA/GAPDH expression ratio (i.e. 2−ΔCt). Data are mean ± SD (n = 26).
- lncRNA‐PAGBC subnetwork in the GBC coexpression network. This subnetwork consists of 17 lncRNAs (red) and 30 protein‐coding genes (green) with fold change ≥ 10.0 and a P‐value ≤ 0.05.
- lncRNA‐PAGBC expression in human GBC tissues and paired non‐tumour tissues was analysed via qRT–PCR. The results are shown by box plots (left) and bar charts (right). In the box plot, horizontal lines in the box plots represent the median, the boxes represent the interquartile range, and whiskers represent the 2.5th and 97.5th percentiles (n = 60).
- Upper panel: The survival rates of 77 HCC patients who underwent surgery were compared between the high‐ and low‐lncRNA‐PAGBC expression groups. Lower panel: Kaplan–Meier survival curves of gallbladder cancer patients with different expression levels of PAGBC stratified by the TNM stage of the tumour. P‐value was obtained by log‐rank test. Stage I and II gallbladder cancers with low expression level of PAGBC versus high expression level of PAGBC, P < 0.01; Stage III and IV gallbladder cancers with low expression level of PAGBC versus high expression level of PAGBC, P < 0.05; Stage I and II gallbladder cancers with high expression level of PAGBC versus Stage III and IV gallbladder cancers with low expression level of PAGBC, P > 0.05.
- Northern blot analysis of lncRNA‐PAGBC in GBC tissues and cells shows the length of the lncRNA‐PAGBC fragment. Molecular weight markers are indicated on the right. β‐actin was used as an internal control.
- qRT–PCR analysis of lncRNA‐PAGBC expression in NOZ cells. The total, nuclear and cytoplasmic RNA fractions were extracted. β‐actin, GAPDH, U2 and U6 were used as endogenous controls. Data are mean ± SD (n = 3).
- Localization of lncRNA‐PAGBC by RNA‐FISH in GBC‐SD and NOZ cells transfected with negative control siRNA(siNC) or PAGBC siRNA. Nuclei are stained blue (DAPI), and lncRNA‐PAGBC is stained green. Scale bars represent 25 μm.
A newly identified lncRNA serves as an independent prognostic factor for the overall survival of GBC patients
A gene‐coexpression network was used to cluster various transcripts into phenotypically relevant coexpression modules 10, 14, 15. The structural differences in the coexpression networks for the GBC and non‐tumour samples indicated the variance in lncRNA and mRNA expression levels in the GBC and non‐tumour samples (Fig EV1C and D). Considering that biologically related gene groups tend to show similar patterns of change during cancer development 10, 14, we focused on the lncRNAs with a high rate of coexpressed protein‐coding RNAs. In particular, lncRNA‐LINC01133 (NR_038849.1) caught our attention and was designated as the prognosis‐associated gallbladder cancer lncRNA (lncRNA‐PAGBC). lncRNA‐PAGBC was highly expressed in GBC tissues and was associated with 17 lncRNAs and 30 protein‐coding genes with fold change ≥ 10.0 and a P‐value ≤ 0.05 involved in tumour growth and metastasis in the coexpression network (Fig 1C, Appendix Table S1).
qRT–PCR was performed on 60 pairs of human GBC tissues and corresponding non‐tumour tissues, and the results indicated that the levels of the lncRNA‐PAGBC transcript were significantly increased in GBC tissues compared with the corresponding non‐tumour tissues (P < 0.01, Fig 1D). We further examined lncRNA‐PAGBC expression in 77 human GBC tissues. Based on the clinical and pathological data, we found that higher levels of lncRNA‐PAGBC expression were associated with more advanced tumour stages (Appendix Table S2). Kaplan‐Meier analysis indicated that GBC patients with higher lncRNA‐PAGBC expression levels exhibited significantly reduced overall survival (OS) (P < 0.001, Fig 1E, upper panel). Multivariate analyses showed that the lncRNA‐PAGBC expression level was an independent prognostic factor for overall patient survival (P < 0.01). When stratified by TNM stage, patients with a low expression level of PABGC had significantly better overall survival results than those with a high expression level of PABGC (P < 0.01 and P < 0.05, respectively; Fig 1E, lower panel).
The full length of lncRNA‐PAGBC was confirmed by rapid amplification of cDNA ends (RACE) analysis (Fig EV2A and B), its existence and expected size was further testified by northern blot assay (Fig 1F). Fluorescence in situ hybridization and RT–PCR results suggested that this lncRNA mainly located in the cytoplasm (Fig 1G and H). Analysis of the sequences using the Open Reading Frame (ORF) Finder of the National Center for Biotechnology Information and codon substitution frequency (CSF) analysis with PhyloCSF indicated that lncRNA‐PAGBC had little potential to code proteins (Fig EV2C and D). An in vitro translation analysis failed to identify an extra band compared with the non‐template group (Fig EV2E), which further supported the notion that the lncRNA‐PAGBC transcript showed no protein‐coding potential.
Figure EV2. Expanded information for lncRNA‐PAGBC .
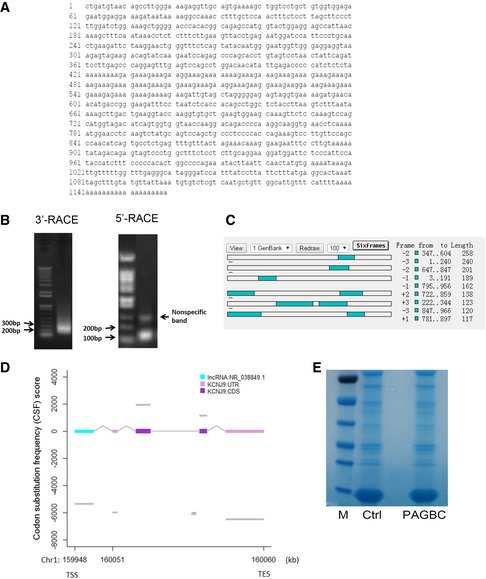
- The nucleotide sequence of full‐length human lncRNA‐PAGBC.
- A representative image of the PCR products of the 5′‐RACE and 3′‐RACE procedures.
- Putative proteins that may be encoded by lncRNA‐PAGBC, as predicted by ORF Finder.
- Codon substitution frequency scores (CSF) of lncRNA‐PAGBC.
- PAGBC translation reactions with PSPT19 backbone vector constructs: Molecular weight marker (M), TNT® SP6 Quick master mix control (Ctrl), 5 μl of the 50 μl in vitro translation reaction mixture with PSPT19‐PAGBC (PAGBC).
Source data are available online for this figure.
Collectively, these data suggest that lncRNA‐PAGBC could represent a role in carcinogenesis of GBC.
lncRNA‐PAGBC regulates tumour growth and metastasis in GBC cells
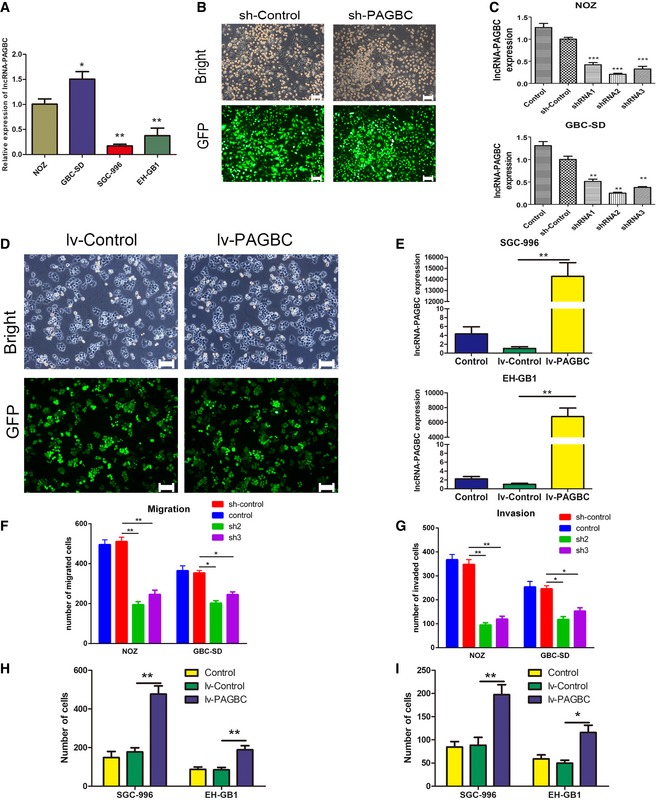
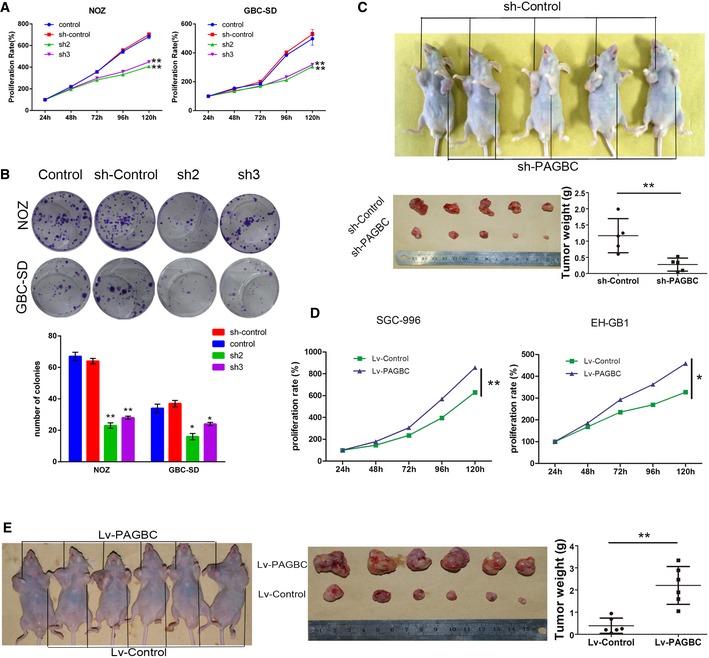
To determine the biological function of lncRNA‐PAGBC in GBC cell lines, we stably knocked down lncRNA‐PAGBC in NOZ and GBC‐SD cells for their relatively high expression levels of lncRNA‐PAGBC; on the opposite, lncRNA‐PAGBC was overexpressed in SGC996 and EH‐GB1 cells (Fig EV3A–E). Cell‐counting kit‐8 (CCK‐8) assays and colony formation assays demonstrated that the proliferation of NOZ and GBC‐SD cells was significantly inhibited after lncRNA‐PAGBC silencing (Fig 2A and B). Furthermore, a subcutaneous xenograft model was used and the results indicated that the growth of tumours from lncRNA‐PAGBC‐depleted xenografts was significantly inhibited compared with the tumours that developed from mock‐infected NOZ cells (Fig 2C). Additionally, exogenous overexpression of lncRNA‐PAGBC promoted GBC cell proliferation and tumour formation both in vitro and in vivo (Fig 2D and E). These results showed that lncRNA‐PAGBC positively regulates GBC cell proliferation both in vitro and in vivo.
Figure EV3. lncRNA‐PAGBC promotes the proliferation and metastasis of GBC cells.
-
AThe relative PAGBC expression in different cell lines was determined using quantitative real‐time PCR. The data were compared with NOZ cells. Data are mean ± SD (n = 3).
-
BThe transfection efficiency was determined 3 days after incubation with the lentivirus. The GFP‐labelled transfected cells were observed under a light microscope and a fluorescence microscope. Light micrograph (upper panel); fluorescence micrograph (lower panel). Scale bars represent 100 μm.
-
CRelative PAGBC expression was determined using quantitative real‐time PCR. GAPDH was used as an internal control. The data were compared with the sh‐Control. The data are shown as the means ± SD of triplicate samples.
-
DThe transfection efficiency was determined 3 days after incubation with the lentivirus. The GFP‐labelled transfected cells were observed under a light microscope and a fluorescence microscope. Light micrograph (upper panel); fluorescence micrograph (lower panel). Scale bars represent 100 μm.
-
ERelative PAGBC expression was determined using quantitative real‐time PCR. GAPDH was employed as an internal control. The data are shown as the means ± SD of triplicate samples.
-
F, GA statistical plot of the average number of migrated (F) or invaded (G) NOZ and GBC‐SD cells shown in Fig 3A. The data are shown as the means ± SD of triplicate samples.
-
H, IA statistical plot of the average number of migrated (H) or invaded (I) EH‐GB1 and SGC‐996 cells shown in Fig 3B. The data are shown as the means ± SD of triplicate samples.
Figure 2. lncRNA‐PAGBC regulates proliferation in GBC cells.
-
A, BThe proliferation of NOZ and GBC‐SD cells stably transfected with a lentivirus encoding a shRNA against lncRNA‐PAGBC (sh2, sh3) was measured using CCK‐8 assays (A) and colony formation assays (B). Typical photographs of colony formation assays are shown in (B), and the graph below shows the number of colonies by the indicated cells. Data are mean ± SD of triplicate samples.
-
CA subcutaneous implant model was established using NOZ cells. The graphs below show the tumours developed and a statistical plot of the average tumour weights in the subcutaneous implant model. Data are mean ± SD (n = 5).
-
DThe proliferation of SGC‐996 and EH‐GB1 cells stably transfected with a lentivirus encoding lncRNA‐PAGBC was measured using CCK‐8 assays. Data are mean ± SD of triplicate samples.
-
EA subcutaneous implant model was established using EH‐GB1 cells. The graph in the middle shows the tumours developed, and the graph on the right shows a statistical plot of the average tumour weights in this model. Data are mean ± SD (n = 6).
Transwell migration and invasion assays indicated that lncRNA‐PAGBC knockdown significantly impaired the migration and invasion of NOZ and GBC‐SD cells in vitro (Figs 3A and EV3F–G). Exogenous overexpression of lncRNA‐PAGBC promoted the migration and invasion of SGC996 and EH‐GB1 cells (Figs 3B and EV3H–I). To confirm these findings in vivo, we injected NOZ cells through the spleen to establish a liver metastasis tumour model in nude mice. Seven of the eight mice (7/8) injected with NOZ cells in the control group and four of the eight mice (4/8) injected with NOZ cells with lncRNA‐PAGBC‐depleted group showed increased luciferase signals and metastatic foci in their livers after 6 weeks. At that time, all mice were sacrificed, and their livers were subjected to haematoxylin and eosin (H&E) staining. The livers injected with shRNA‐PAGBC‐treated NOZ cells exhibited significantly fewer intrahepatic metastases (P < 0.001, Fig 3C and D).
Figure 3. lncRNA‐PAGBC promotes the metastasis of GBC cells.
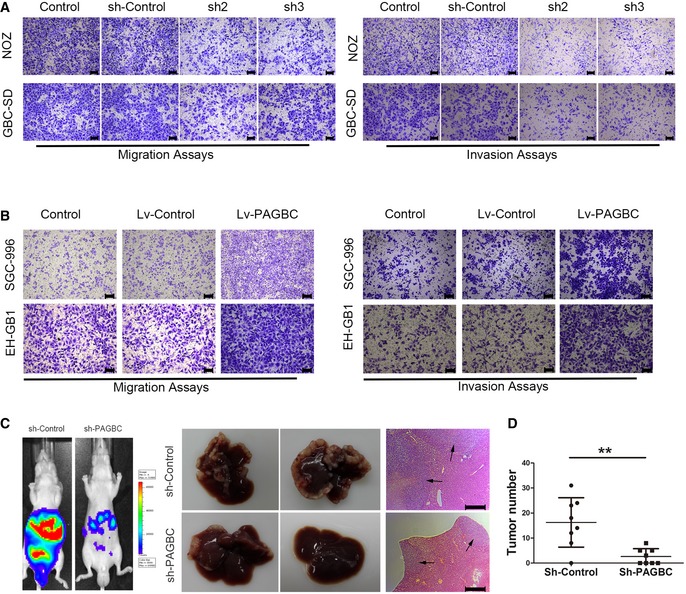
- Transwell migration (left) and invasion (right) assays of NOZ and GBC‐SD cells transfected with a lentivirus encoding a shRNA against lncRNA‐PAGBC. Scale bars represent 100 μm.
- Transwell migration (left) and invasion (right) assays of SGC‐996 and EH‐GB1 cells transfected with a lentivirus encoding lncRNA‐PAGBC. Scale bars represent 100 μm.
- Intrasplenic injection model was established using NOZ cells. Representative images of luciferase signals in the mice at 42 days after the intrasplenic injection of 2 × 10⁶ cells of the indicated NOZ cell clones (left). Middle panel: Representative livers from mice from the left panel. Right panel: Haematoxylin and eosin‐stained images of liver tissues isolated from the mice shown on the left. Scale bars represent 500 μm. Black arrows indicate the metastatic tumour.
- A statistical plot of the average number of liver metastases in the intrasplenic injection model. The data are shown as the means ± SD, n = 8. **P < 0.01 (Student's t‐test)
Taken together, these data show that lncRNA‐PAGBC promotes tumour growth and metastasis in GBC cells.
lncRNA‐PAGBC competitively binds and absorbs microRNAs as a competing endogenous RNA
Recently, many RNA transcripts have been reported to function as competing endogenous RNAs (ceRNAs) that operate by competitively binding common microRNAs (miRNAs) 14, 15, 16. To explore whether lncRNA‐PAGBC may function as a ceRNA, we predicted possible binding sites in lncRNA‐PAGBC using the Segal Lab program (Eran Segal; http://132.77.150.113/pubs/mir07/mir07_prediction.html). The results showed that lncRNA‐PAGBC contains almost 1,000 potential miRNA binding sites, indicating that lncRNA‐PAGBC might act as a ceRNA. Based on the instructions of this program and our previous GBC‐relevant miRNA microarray results, which have been deposited in the National Center for Biotechnology Information (NCBI) Gene Expression Omnibus (GEO) and are accessible through GEO Series accession number GSE90001, we further narrowed our results to miR‐133b, miR‐150, miR‐511, miR‐625, miR‐765 and miR‐1258 as the most likely candidates to bind lncRNA‐PAGBC.
To verify the binding between these miRNAs and lncRNA‐PAGBC, we conducted luciferase reporter assays using the full sequence of lncRNA‐PAGBC. Overexpression of miR‐133b and miR‐511 reduced the luciferase activity of the PAGBC reporter vector, but not the empty vector (Fig 4B), whereas the other 4 miRNAs failed to alter luciferase activity. Furthermore, we engineered luciferase reporters containing a mutated lncRNA‐PAGBC sequence that harboured potential binding sites for miR‐133b or miR‐511. After transfecting these vectors into 293T cells and NOZ cells, miR‐133b overexpression failed to reduce the luciferase activity of the PAGBC‐mut (miR‐133b) vector (Fig 4B and D). Similarly, miR‐511 mimics failed to decrease the luciferase activity of the PAGBC‐mut(miR‐511) vector (Fig 4B and D). Moreover, the qRT–PCR results indicated that miR‐133b and miR‐511 were significantly upregulated after lncRNA‐PAGBC silencing in NOZ cells (Fig 4C, upper panel). Conversely, miR‐133b and miR‐511 were significantly downregulated after lncRNA‐PAGBC overexpression in EH‐GB1 cells (Fig 4C, lower panel). To validate the binding between these miRNAs and lncRNA‐PAGBC at endogenous levels, MS2‐RNA immunoprecipitation (MS2‐RIP, Fig 4E, upper panel) was used to pull down endogenous microRNAs associated with lncRNA‐PAGBC 16. For this purpose, an empty vector (MS2), a vector containing the full sequence of lncRNA‐PAGBC (lncRNA‐PAGBC), a vector containing lncRNA‐PAGBC with mutations in the miR‐133b targeting binding sites [designated PAGBC‐mut(miR‐133b)], and a vector containing lncRNA‐PAGBC with mutations in the miR‐511 targeting binding sites [PAGBC‐mut(miR‐511)] were engineered. The followed qRT–PCR results showed that PAGBC RIP was significantly enriched for miR‐133b and miR‐511 in NOZ cells compared with MS2 and the corresponding mutated vector (Fig 4E, Appendix Fig S1A). MicroRNAs bind their targets and cause translational repression and/or RNA degradation in an AGO2‐dependent manner. To determine whether lncRNA‐PAGBC binds to miR‐133b and miR‐511 in this manner, anti‐AGO2 RIP was performed in NOZ cells transiently overexpressing miR‐133b or miR‐511. As shown in Fig 4F and Appendix Fig S1B, PAGBC was enriched in cells overexpressing miR‐133b or miR‐511. Moreover, according to the ceRNA theory, the abundance of lncRNA‐PAGBC should be comparable to that of miR‐133b and miR‐511 for it to serve as a ceRNA. Therefore, we used qRT–PCR to quantify the exact copy numbers of lncRNA‐PAGBC, miR‐133b and miR‐511 per cell. The results indicated that in NOZ cells, the expression level of lncRNA‐PAGBC was 1,027 copies per cell, whereas those of miR‐133b and miR‐511 were 1,188 and 3,483 copies per cell, respectively. Because lncRNA‐PAGBC could downregulate miR‐133b and miR‐511 in GBC cells, the correlation between lncRNA‐PAGBC and these two miRNAs in 35 pairs of human GBC samples was detected by qRT–PCR. As shown in Fig 4G, lncRNA‐PAGBC transcript level was significantly negatively correlated with miR‐133b (upper panel) and miR‐511 (lower panel) transcript levels.
Figure 4. lncRNA‐PAGBC competitively binds and absorbs microRNAs as a competing endogenous RNA .
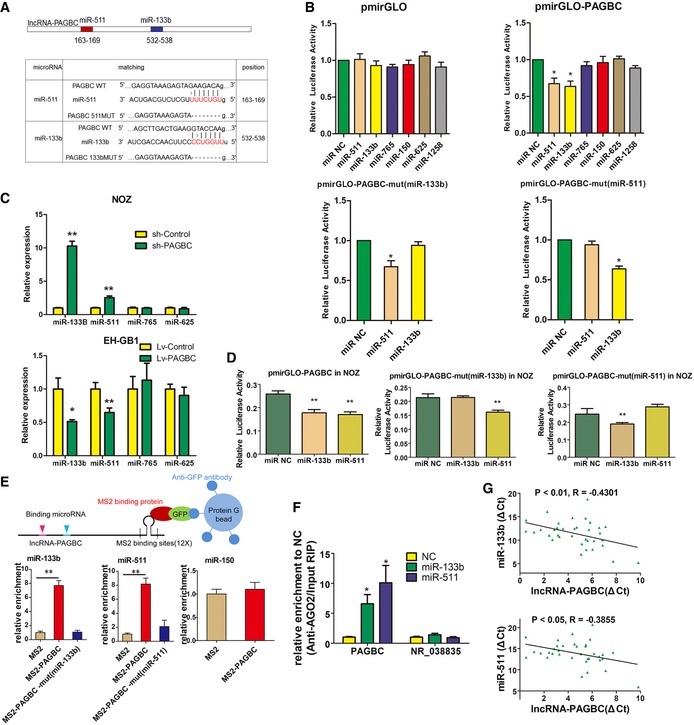
- Upper panel shows schematic representation of the predicted binding sites for miR‐133b and miR‐511 in lncRNA‐PAGBC. Lower panel presents the predicted miR‐133b and miR‐511 binding sites in the lncRNA‐PAGBC transcript. The red nucleotides are the seed sequences of the microRNAs. The target site mutations are underlined.
- Luciferase activity in 293T cells cotransfected with miR‐133b and miR‐511 and luciferase reporters that were empty (upper left panel) or contained lncRNA‐PAGBC (upper right panel) or the indicated mutant transcript (lower panel). Data are presented as the relative ratio of firefly luciferase activity to Renilla luciferase activity. The data are shown as the means ± SD of triplicate samples.
- MicroRNA expression levels in GBC cells after transfection with lentiviruses containing the indicated shRNAs (upper panel) or the indicated transcripts (lower panel) via qRT–PCR. The data are shown as the means ± SD of triplicate samples.
- Luciferase activity in NOZ cells cotransfected with miR‐133b and miR‐511 and luciferase reporters that contained lncRNA‐PAGBC (left) or the indicated mutant transcript (middle and right). The data are shown as the means ± SD of triplicate samples.
- MS2‐RIP followed by microRNA qRT–PCR to detect miR‐133b (lower left panel) and miR‐511 (lower middle panel) that endogenously associated with lncRNA‐PAGBC. miR‐150 was used as a negative control (lower right panel). A schematic outline of the MS2‐RIP strategy used to identify microRNAs endogenously associated with lncRNA‐PAGBC is shown (upper panel). The data are shown as the means ± SD of triplicate samples.
- Anti‐AGO2 RIP was performed in NOZ cells transiently overexpressing miR‐133b and miR‐511, followed by qRT‐PCR to detect lncRNA‐PAGBC or lncRNA‐NR_038835 associated with AGO2. The data are shown as the means ± SD of triplicate samples.
- The correlation between lncRNA‐PAGBC transcript level and miR‐133b (upper panel) or miR‐511 (lower panel) transcript level was measured in 35 GBC tissues. The ΔC t values were subjected to Pearson correlation analysis.
Taken together, these results indicate that lncRNA‐PAGBC may function as a ceRNA for miR‐133b and miR‐511.
lncRNA‐PAGBC upregulates SOX4 and PIK3R3 levels
In order to find out genes sharing the regulatory role of miR‐133b and miR‐511 with PAGBC, hundreds of target genes were predicted by Targetscan (17; http://www.targetscan.org/), after overlapping with upregulated genes in the microarray data, SOX4 and PIK3R3 (Appendix Fig S1C) caught our attention, which play important role in tumorigenesis in various carcinomas according to previous studies 18, 19, 20, 21. Previous reports showed that the expression of miR‐511‐5p required the hosting gene, MRC1 22. To confirm whether miR‐511‐5p is indeed expressed in GBC cells, we subcloned the qRT–PCR products into TA vector and sequenced. Our results showed that the products were indeed miR‐511‐5p (Appendix Fig S1D). Furthermore, we detected the expression of MRC1 in GBC cells by Western blotting assay (Appendix Fig S1E) and found that MRC1 was expressed in all of the four GBC cells. To identify the cellar source of miR‐511‐5p in the tumour samples, we performed IHC analysis in gallbladder cancer tissues by MRC1 antibody (Appendix Fig S1F). The result revealed that MRC1 was indeed expressed in GBC cells. One study 21 has shown that PIK3R3 was a direct target of miR‐511 in hepatocellular carcinoma, while the possible interaction between miR‐133b and SOX4 has never been interpreted in any study. To validate these predicted relationships, luciferase assays (Appendix Fig S1G–H) were performed and the results indicated that transfection of miR‐133b and miR‐511 mimics reduced the luciferase activity of the SOX4 and PIK3R3 reporter vector, respectively, but not the mutated vector. After overexpression and knockdown of these two miRNAs (Appendix Fig S1I), Western blot assays demonstrated that the SOX4 protein level was reduced by miR‐133b and increased by anti‐miR‐133b, and the PIK3R3 protein level was reduced by miR‐511 and increased by anti‐miR‐511 in GBC cells (Appendix Fig S1J). These data indicated SOX4 and PIK3R3 are the direct targets of miR‐133b and miR‐511, respectively.
As a ceRNA, lncRNA‐PAGBC could share the regulatory miRNAs with their targets; therefore, we hypothesized that lncRNA‐PAGBC could regulate SOX4 and PIK3R3 in GBC cells. As shown in Fig 5A and B, lncRNA‐PAGBC overexpression upregulated SOX4 and PIK3R3 at both the mRNA and protein levels in EH‐GB1 cells, whereas ectopically expressed lncRNA‐PAGBC‐mut(miR‐133b) or lncRNA‐PAGBC‐mut(miR‐511) failed to significantly change SOX4 or PIK3R3 expression. Silencing lncRNA‐PAGBC in NOZ cells downregulated SOX4 and PIK3R3 at both the mRNA and protein levels. For the rescue experiment, miR‐133b and miR‐511 were inhibited in lncRNA‐PAGBC‐silenced NOZ cells (Fig 5C, left panel and 5D, left panel). Inhibition of miR‐133b and miR‐511 increased the expression of SOX4 and PIK3R3, respectively. Conversely, overexpression of miR‐133b and miR‐511 counteracted the corresponding increases in SOX4 and PIK3R3 expression induced by overexpressing lncRNA‐PAGBC in EH‐GB1 cells (Fig 5C, right panel and 5D, right panel). Next, to determine the relationship between PAGBC and these two genes from a clinical perspective, we measured both the mRNA levels and protein levels in human GBC tissues. As shown in Fig 5E, qRT–PCR showed that lncRNA‐PAGBC transcript level was significantly correlated with SOX4 and PIK3R3 mRNA transcript levels. Moreover, we divided the human GBC tissue samples into two groups by the median value of PAGBC expression. As shown in Fig 5F and Appendix Fig S1K–L, immunohistochemistry (IHC) indicated that SOX4 and PIK3R3 were relatively upregulated in the high‐PAGBC expression samples.
Figure 5. lncRNA‐PAGBC upregulates SOX4 and PIK3R3 levels.
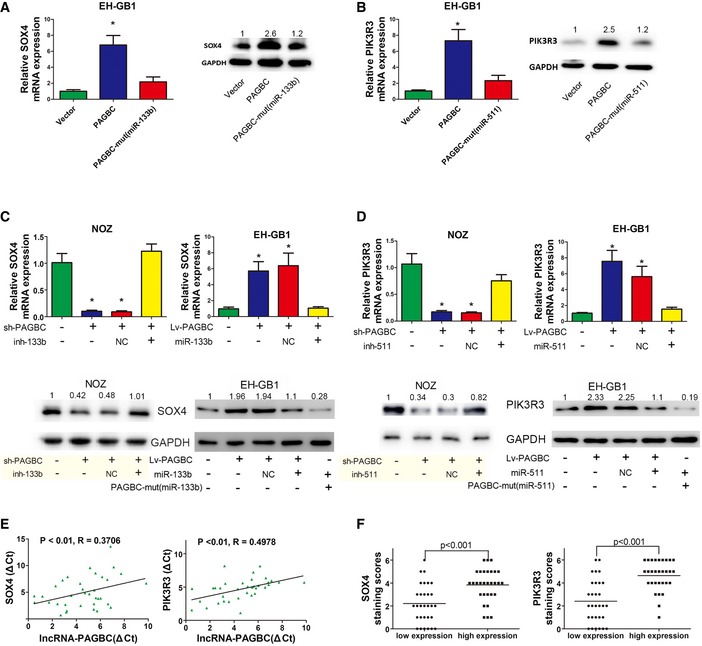
- SOX4 mRNA (left) and protein (right) levels after the indicated plasmids were transfected into EH‐GB1 cells. Data are mean ± SD (n = 3).
- PIK3R3 mRNA (left) and protein (right) levels after the indicated plasmids were transfected into EH‐GB1 cells. Data are mean ± SD (n = 3).
- SOX4 mRNA (upper panel) and protein (lower panel) levels in stable NOZ and EH‐GB1 cell clones after transfection of the indicated miR‐133b inhibitors or mimics. Data are mean ± SD (n = 3).
- PIK3R3 mRNA (upper) and protein (lower) levels in stable NOZ and EH‐GB1 cell clones after transfection of the indicated miR‐511 inhibitors or mimics. Data are mean ± SD (n = 3).
- The correlation between lncRNA‐PAGBC transcript level and SOX4 (left) or PIK3R3 (right) mRNA transcript level was measured in 35 GBC tissues. The ΔC t values were subjected to Pearson correlation analysis.
- Scatterplots of the average staining scores for SOX4 (left) and PIK3R3 (right) expression in patients with low or high expression of lncRNA‐PAGBC.
These data suggest that lncRNA‐PAGBC plays important roles in regulating SOX4 and PIK3R3 expression by competitively binding to miR‐133b and miR‐511, respectively.
lncRNA‐PAGBC requires miR‐133b and miR‐511 to promote growth and metastasis and activate the AKT/mTOR pathway in GBC cells
As shown in Appendix Fig S2, miR‐133b and miR‐511 could strongly inhibit the proliferation, colony formation and metastasis abilities of GBC cells. Both SOX4 and PIK3R3 have been shown to promote proliferation and metastasis in other carcinomas in previous studies 18, 19, 20, 21. Moreover, these studies demonstrated that both SOX4 and PIK3R3 are involved with the AKT/mTOR pathway, which is critical for tumour proliferation and metastasis. SOX4 transcriptionally activates the promoters of multiple components within the phosphatidylinositol 3′‐kinase (PI3K)/AKT pathway, while PIK3R3 is a member of the PI3K family, which participates in the AKT/mTOR pathway. Therefore, we hypothesized that lncRNA‐PAGBC activates the AKT/mTOR pathway in GBC cells and both the two miRNAs are required for PAGBC's biological function. As shown in the Fig 6A, Western blot assays demonstrated that lncRNA‐PAGBC knockdown inhibited the phosphorylation of the AKT and mTOR proteins, while overexpression promoted the phosphorylation of the AKT and mTOR proteins. These data indicated lncRNA‐PAGBC activates the AKT/mTOR pathway in GBC cells.
Figure 6. lncRNA‐PAGBC requires miR‐133b and miR‐511 to promote growth and metastasis and activate the AKT/mTOR pathway in GBC cells.
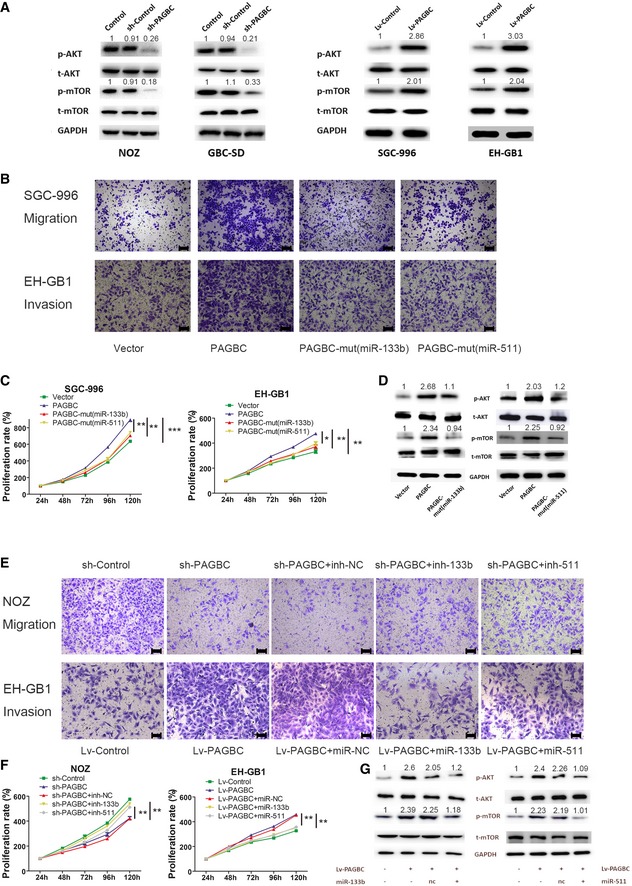
- Western blotting analysis of p‐AKT, t‐AKT, p‐mTOR and t‐mTOR in the indicated GBC cell clones.
- Transwell migration and invasion assays of SGC‐996 or EH‐GB1 cells that were transfected with the indicated plasmids. Scale bars represent 100 μm.
- The proliferation of SGC‐996 or EH‐GB1 cells was measured using CCK‐8 assays. The data are shown as the means ± SD of triplicate samples.
- Western blotting analysis of p‐AKT, t‐AKT, p‐mTOR and t‐mTOR in EH‐GB1 cells transiently transfected with the indicated plasmids.
- Transwell migration and invasion assays of NOZ and EH‐GB1 cells stably transfected with lentiviruses encoding the indicated transcripts and treated with the indicated microRNA inhibitors or mimics. Scale bars represent 100 μm.
- The proliferation of NOZ and EH‐GB1 cells was measured using CCK‐8 assays. The data are shown as the means ± SD of triplicate samples.
- Western blotting analysis of p‐AKT, t‐AKT, p‐mTOR and t‐mTOR in EH‐GB1 cells transfected with lentiviruses encoding the indicated transcripts and treated with the indicated microRNA mimics.
Next, CCK‐8 and transwell assays were performed to determine the effects of miR‐133b and miR‐511 on the function of lncRNA‐PAGBC in GBC cells. The results showed that lncRNA‐PAGBC overexpression promoted the proliferation and metastasis, whereas ectopic expression of lncRNA‐PAGBC‐mut(miR‐133b) and lncRNA‐PAGBC‐mut(miR‐511) did not (Fig 6B and C, Appendix Fig S3A and B). In addition, Western blot assays demonstrated that ectopically expressed lncRNA‐PAGBC‐mut(miR‐133b) and lncRNA‐PAGBC‐mut(miR‐511) failed to inactivate the AKT/mTOR pathway while lncRNA‐PAGBC overexpression successfully did (Fig 6D). Moreover, we inhibited miR‐133b and miR‐511 in lncRNA‐PAGBC‐silenced NOZ cells, and inhibition of these miRNAs was found to partially counteract the impairment of proliferation and metastasis induced by the knockdown of lncRNA‐PAGBC. Conversely, overexpression of miR‐133b and miR‐511 partially counteracted the increase in proliferation and metastasis induced by the overexpression of lncRNA‐PAGBC (Fig 6E and F, Appendix Fig S3C and D). In addition, the overexpression of miR‐133b and miR‐511 partially reversed the activation of the AKT/mTOR pathway induced by lncRNA‐PAGBC overexpression via Western blot assays (Fig 6G).
Together, these data indicate that an interaction with miR‐133b and miR‐511 is necessary for lncRNA‐PAGBC to promote malignancy and activate the AKT/mTOR pathway in GBC cells.
Poly(A) binding protein, cytoplasmic 1 (PABPC1) interacts with lncRNA‐PAGBC and increases the stability of lncRNA‐PAGBC
Several recent studies have found that many lncRNAs participate in molecular regulation pathways through their interactions with proteins 10, 23. To determine whether lncRNA‐PAGBC functions in such a manner, RNA pull‐down assays were performed to identify proteins that associated with lncRNA‐PAGBC in NOZ cells. The lncRNA‐PAGBC‐specific bands were excised and subjected to mass spectrometry (Fig 7A). Poly(A) binding protein, cytoplasmic 1 (PABPC1) was the main protein identified through mass spectrometry (Appendix Fig S4A). It was confirmed via Western blot analysis using proteins from two independent RNA pull‐down assays (Fig 7B, upper panel). RNA immunoprecipitation (RIP) was performed with an antibody against PABPC1 using extracts from NOZ cells. lncRNA‐PAGBC enrichment was observed, but no GAPDH mRNA enrichment was detected (Fig 7B, lower panel). In addition, we also found Ago2 was enriched by lncRNA‐PAGBC (Appendix Fig S4B), which further supported our previous Ago2 RIP results (Fig 4F). These results suggest that lncRNA‐PAGBC interacts with the PABPC1 protein.
Figure 7. PABPC1 interacts with lncRNA‐PAGBC and increases the stability of lncRNA‐PAGBC .
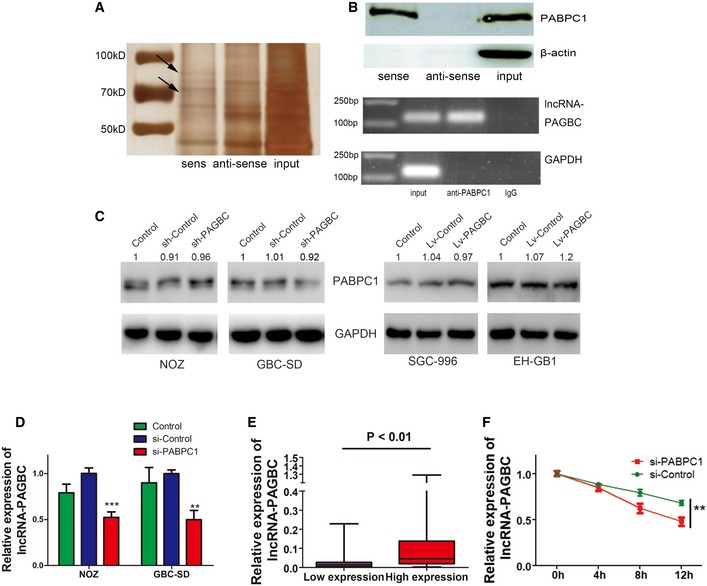
- RNA pull‐down assays were performed in NOZ cells. The two bands highlighted by the arrow were submitted for mass spectrometry analysis.
- Upper panel: Western blot analysis following RNA pull‐down assays performed using NOZ cellular extracts. An antibody against the β‐actin protein was used as the negative control. Lowe panel: RIP experiments were performed on extracts from NOZ cells using an antibody against PABPC1.
- PABPC1 protein expression levels in GBC cells were determined by Western blot analysis.
- qRT–PCR was performed to measure the expression of lncRNA‐PAGBC in GBC cells. The data are shown as the means ± SD.
- After dividing the 77 GBC tissue samples into two groups according to PABPC1 expression, the expression levels of lncRNA‐PAGBC were compared. The data are shown as the means ± SD.
- NOZ cells were transfected with a siRNA against PABPC1 for 48 h and then treated with actinomycin D (10 μmol/l) to block RNA synthesis. lncRNA‐PAGBC levels were measured via qRT–PCR and normalized to the level of GAPDH. All values at time 0 h were normalized to 1.
Next, Western blot analysis of PABPC1 indicated that overexpression or knockdown of lncRNA‐PAGBC had no significant effect on PABPC1 expression (Fig 7C). Several recent studies have shown that PABPC1 can increase the stability of mRNAs or long noncoding viral RNAs 24, 25. Additionally, lncRNA‐PAGBC has a Poly(A) tail, which is a characteristic usually found in mRNAs. Therefore, we hypothesized that PABPC1 increases the expression of lncRNA‐PAGBC by stabilizing it. To validate this hypothesis, a qRT–PCR analysis of lncRNA‐PAGBC was conducted after siRNA knockdown of PABPC1 in GBC cells. The results showed that PABPC1 silencing significantly decreased the expression levels of lncRNA‐PAGBC (Fig 7D). Furthermore, IHC analysis of PABPC1 in human GBC tissues was performed, and the 77 patients were divided into two groups according to their PABPC1 expression levels. As shown in Fig 7E and Appendix Fig S4C, lncRNA‐PAGBC levels were significantly increased in the high expression group compared with the low expression group. To examine whether PABPC1 regulates the stability of lncRNA‐PAGBC, we treated NOZ cells with actinomycin D, a transcription inhibitor, to block new RNA synthesis. We then measured the expression of lncRNA‐PAGBC and GAPDH over a 12‐h period and found that PABPC1 knockdown significantly and rapidly decreased lncRNA‐PAGBC expression (Fig 7F). Collectively, these data indicate that PABPC1 increases the stability of lncRNA‐PAGBC and regulates its expression by binding to lncRNA‐PAGBC.
Moreover, to understand the role of PABPC1 on the function of lncRNA‐PAGBC, we knocked down the expression of PABPC1 in NOZ cells. The results indicated that silencing of PABPC1 led to inhibition of proliferation and metastasis in vitro, inactivation of the Akt/mTOR pathway, upregulation of miR‐133b and miR‐511, and downregulation of their target genes. In the rescue experiments, overexpression of lncRNA‐PAGBC could counteract the effect of PABPC1 silencing (Fig EV4).
Figure EV4. The role of PABPC1 on the function of lncRNA‐PAGBC .
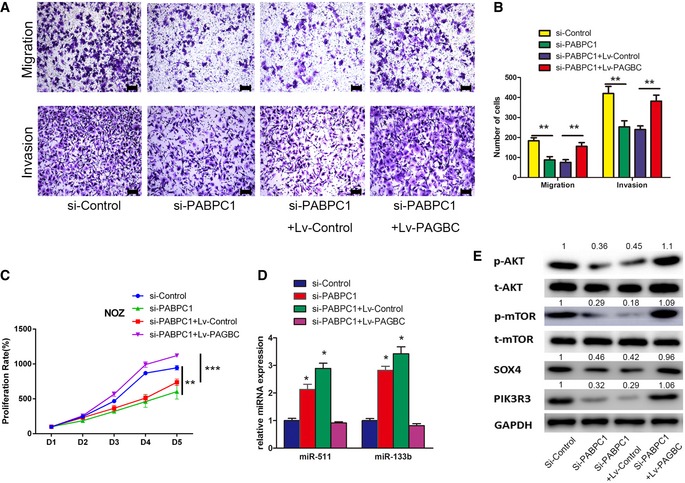
- Transwell migration and invasion assays of NOZ transfected with siRNA against the indicated transcripts and transfected with the lentivirus encoding the indicated transcripts. Scale bars represent 100 μm.
- A statistical plot of the average number of migrated or invaded NOZ cells shown in (A). The data are shown as the means ± SD of triplicate samples.
- The proliferation of NOZ cells transfected with siRNA against the indicated transcripts and transfected with the lentivirus encoding the indicated transcripts was measured using CCK‐8 assays. Data are mean ± SD (n = 3).
- qRT–PCR was performed to detect the expression of miR‐133b and miR‐511 in NOZ cells transfected with siRNA against the indicated transcripts and transfected with the lentivirus encoding the indicated transcripts. Data are mean ± SD (n = 3).
- Western blotting analysis of p‐AKT, t‐AKT, p‐mTOR, t‐mTOR, SOX4 and PIK3R3 in NOZ cells transfected with siRNA against the indicated transcripts and transfected with the lentivirus encoding the indicated transcripts.
Discussion
Gallbladder cancer carries an extremely poor prognosis. A comprehensive understanding of the underlying mechanisms of GBC oncogenesis would be valuable for the identification of useful diagnostic or therapeutic targets. lncRNAs have been shown to play an essential role in the development and progression of various carcinomas 9, 10. In this study, we not only identified a number of lncRNAs that were aberrantly expressed in human GBCs compared with paired non‐tumour tissues, but also found lncRNA‐PAGBC was upregulated in human GBC samples. LINC01133 has been reported in non‐small‐cell lung cancer 26, 27, colorectal cancer 28 and osteosarcoma 29. It could promote NSCLS cells' proliferation, migration and invasion through binding to EZH2 and LSD1 to repress KLF2, P21 and E‐cadherin transcription 27. As in colorectal cancer, LINC01133 inhibits epithelial‐mesenchymal transition and metastasis by directly binding to SRSF6 28. LINC01133 could also sponge miR‐422a to aggravate the tumorigenesis of human osteosarcoma 29. In our study, a higher level of lncRNA‐PAGBC was significantly associated with worse tumour stages and a poorer prognosis in GBC patients. Various in vitro and in vivo studies indicated that lncRNA‐PAGBC positively regulates proliferation and metastasis in GBC cells. These results suggest that lncRNA‐PAGBC may serve as an oncogenic lncRNA to promote tumorigenesis in GBC.
Recently, it has been demonstrated that lncRNAs potentially influence mRNA levels by interfering with the miRNA pathways, by acting as ceRNAs 11, 12. The ceRNA can inhibit miRNAs through MREs and protect the target mRNAs from repression 12. This ceRNA model has been shown to be critical in tumorigenesis. For example, by acting as an endogenous “sponge”, lncRNA‐HULC downregulates miR‐372 to reduce the translational repression of its target gene PRKACB, which induces phosphorylation of CREB and modulate self‐regulation in hepatocellular cancer 30. Additionally, lncRNA‐ATB upregulated ZEB1 and ZEB2 by competitively binding to the miR‐200 family and then induced EMT and invasion in hepatocellular carcinoma 16. In this study, we tried to find out whether lncRNA‐PAGBC works as a ceRNA in GBC. Firstly, target‐binding sites for miR‐133b and miR‐511 were identified in lncRNA‐PAGBC by bioinformatics software. Dual‐luciferase reporter assays and MS2‐RIP were performed, and the results proved the competitive relationship between lncRNA‐PAGBC and these two miRNAs. In previous studies, miR‐133b and miR‐511 have been identified as tumour suppressors in other carcinomas 31, 32. Indeed, these miRNAs inhibit proliferation and metastasis in carcinomas such as gastric carcinoma, lung carcinoma and hepatocellular carcinoma. In this work, we confirmed that lncRNA‐PAGBC competitively binds to these two miRNAs and downregulates them in GBC cells. In addition, miR‐133b and miR‐511 inversely correlated with lncRNA‐PAGBC in human GBC tissues. Therefore, we hypothesized that miR‐133b and miR‐511 were required for lncRNA‐PAGBC's oncogenic role, at least in part. To verify this notion, rescue assays and ectopically expressed lncRNA‐PAGBC mutation were applied. As expected, this competitive relationship is necessary for lncRNA‐PAGBC to exert its regulatory role in proliferation and metastasis. In our study, we have noticed that 10000‐fold overexpression of the PAGBC in GBC cells only downregulates the miR‐133b and miR‐511 by approximate twofold. About these abovementioned results, we proposed the following explanation. First, the MREs on ceRNA are not equal 12. Although several miRNAs are predicted to bind the same ceRNA, the nucleotide components of their MREs may be different. lnRNA‐PAGBC can possibly bind to various miRNAs and have been proved to interact with miRNAs, such as miR‐133b, miR‐511 and miR‐422a 29. Different miRNAs were detected with different binding affinities due to the binding strength rather than target site frequency 33. Second, it has been observed that the expression of a reporter at higher than physiological levels may itself contribute to saturating miRNA activity 33. Maybe it can also happen to lncRNAs when they work as ceRNAs in cytoplasm.
Additionally, SOX4 and PIK3R3, which are target genes of these two miRNAs and have been identified as oncogenic genes in other malignancies 18, 19, 20, 21, were found to be positively regulated by lncRNA‐PAGBC. Again, as expected, this positive relationship was demonstrated to depend on the competitive role of two miRNAs, at least in part. Interestingly, we noticed that both SOX4 and PIK3R3 are critical regulators in the AKT/mTOR pathway 18, 19, 20, 21. Previous reports show that the AKT/mTOR pathway is a classical signalling pathway whose activation induces cell growth and metastasis in various carcinomas 34, 35. Therefore, we wondered whether lncRNA‐PAGBC could activate the AKT/mTOR pathway. It turned out that lncRNA‐PAGBC activates the AKT/mTOR pathway in GBC cell lines and this activation works on a miR‐133b‐ and miR‐511‐dependant manner. Taken together, these data showed that lncRNA‐PAGBC competitively absorb miR‐133b and miR‐511 to upregulate SOX4 and PIK3R3, which further promotes tumorigenesis and activates AKT/mTOR pathway.
In this work, a link between lncRNA‐PAGBC and PABPC1 was identified, and their relationship was established in GBC. However, in contrast to most other studies on lncRNAs 10, 36, we did not observe significant changes in PABPC1 after knocking down or overexpressing lncRNA‐PAGBC in cells. Instead, our data suggest that PABPC1 plays an important role in stabilizing lncRNA‐PAGBC. Until now, little is known about the general role of lncRNA decay in the context of cancer. In hepatocellular carcinoma, lncRNA‐LET was repressed by hypoxia‐induced histone deacetylase 3 by reducing the histone acetylation‐mediated modulation of the lncRNA‐LET promoter region 37. IGF2 mRNA‐binding protein acts as an adaptor protein that recruits the CCR4‐NOT complex and thereby initiates the degradation of the lncRNA‐HULC in liver cancer 38. However, we are still far away from a comprehensive understanding of the regulating the stability of individual lncRNA. Here, we discovered that PABPC1 might help to stabilize lncRNA‐PAGBC in human GBC cells. PABPC1 normally functions in the cytoplasm where it binds the poly(A) tails of mRNAs, regulating their stability by either antagonizing or enhancing the activity of cytoplasmic deadenylases 39. Since lncRNA‐PAGBC has a poly(A) tail like mRNAs, it is possible that PABPC1 stabilize lncRNA‐PAGBC in such a manner. However, the exact mechanism by which PABPC1 functions to regulate lncRNA‐PAGBC remains unknown, and additional future research will be needed to address this question. These data not only provide a new perspective to understand the relationship and effect how lncRNAs interact with proteins, but also explain, at least partially, the reason why lncRNA‐PAGBC remains at a relatively high level in human GBC.
In conclusion, we characterized the expression profile of lncRNA in GBC and found that lncRNA‐PAGBC may be applicable as a poor prognostic marker and contribute as an oncogenic lncRNA in GBC. PABPC1 was demonstrated to interact with and further stabilize lncRNA‐PAGBC. More importantly, lncRNA‐PAGBC could promote tumorigenesis and activate the AKT/mTOR pathway in GBC cells as a ceRNA by acting a sponge to impair miR‐133b‐dependant SOX4 and miR‐511‐dependant PIK3R3 downregulation (Fig EV5). Our results provide a novel insight on the molecular pathogenesis of GBC and provide potential novel lncRNA‐directed diagnostic and therapeutic targets against this malignancy.
Figure EV5. Schematic model of the functions of lncRNA‐PAGBC in GBC cells.
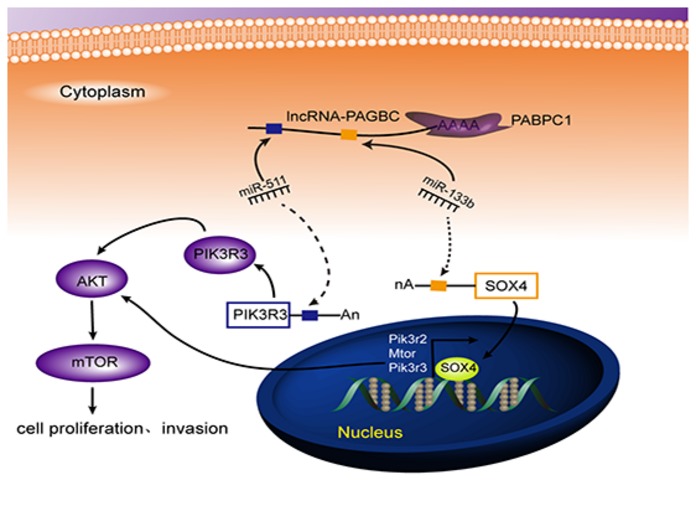
lncRNA‐PAGBC, which is stabilized by PABPC1, promotes GBC cell proliferation and metastasis by competitively binding to miR‐133b and miR‐511, upregulating SOX4 and PIK3R3, and then activating the AKT/mTOR pathway.
Materials and Methods
Patients and clinical samples
All tissue samples were obtained from GBC patients who underwent cholecystectomy without prior radiotherapy or chemotherapy between 2008 and 2013 at our department. Paired non‐cancerous tissues were dissected at least 2 cm away from the tumour border and were confirmed to lack tumour cells via microscopy. Informed consent was obtained from all patients participating in the study. This study was approved by the Institutional Ethical Board of our hospital. The patients' characteristics are shown in Appendix Table S3 and Appendix Table S4.
Microarray analysis
Briefly, samples (nine GBC tissues and nine corresponding non‐tumour tissues; Appendix Table S4) were used to extract the total RNA. The extracted total RNA was amplified and labelled by Low Input Quick Amp Labeling Kit, One‐Color (Agilent technologies, Santa Clara, CA, USA), following the manufacturer's instructions. After purifying, hybridization and staining, slides were scanned by Agilent Microarray Scanner (Agilent technologies, Santa Clara, CA, USA). Data were extracted and normalized. A P‐value was calculated using the paired t‐test. The threshold set for up‐ and downregulated genes was a fold change ≥ 2.0 and a P‐value ≤ 0.05. In addition, to heighten the stringency, P‐values were corrected using a false discovery rate (FDR) < 0.05.
Hierarchical clustering was performed by using freeware TM4‐MEV software (MultiExperiment Viewer, Dan‐Farber Cancer Institute, Boston, MA) 40. Data underwent Z‐score normalization so that parameters with vastly different ranges could be compared directly. The Z‐score was then calculated as the average for each data group subtracted from each data point and the difference divided by the SD for each data group (X‐ Avg)/SD. The normalized data then were averaged across groups and a heat map constructed (http://www.tm4.org/mev.html). Hierarchal clustering (average linkage clustering by using Pearson correlation as the distance metric) was performed within parameters 41.
We present gene‐coexpression networks to identify interactions among genes with fold change ≥ 10.0 and a P‐value ≤ 0.05 14. Gene‐coexpression networks were built according to the normalized signal intensity of specific expressed genes. We constructed the network adjacency between two genes by Pearson correlation and visualized them as a graph 42. To make a visual representation, only the strongest correlations (0.99 or greater) were drawn in these renderings. Within the network analysis, a degree is defined as the number of directly linked neighbours 43. The microarray data discussed in this article have been deposited in the National Center for Biotechnology Information (NCBI) Gene Expression Omnibus (GEO) and are accessible through GEO Series accession number GSE76633.
Luciferase reporter assay
pmirGLO, pmirGLO‐PAGBC or pmirGLO‐PAGBC‐mut(miR‐133b/511) was cotransfected with miR‐133b, the miR‐511 mimic or miR‐Control in 293T cells and NOZ cells. Relative luciferase activity was normalized to Renilla luciferase activity 24 h after transfection and was measured using a Dual‐Luciferase Reporter Assay System (Promega, Wisconsin) according to the manufacturer's protocol.
RNA pull‐down assay
lncRNA‐PAGBC was transcribed in vitro from the pSPT19‐PAGBC vector, labelled with biotin as previously described 10. One milligram of the protein lysate from NOZ cells was incubated with 3 μg of purified biotinylated transcripts for 1 h at room temperature; the complexes were isolated with magnetic beads (Invitrogen, Massachusetts). The proteins present in the pull‐down material were separated via sodium dodecyl sulphate‐polyacrylamide gel electrophoresis and were silver stained. Then, mass spectrometry analysis was performed on the discrepant protein band.
5′ and 3′ Rapid Amplification of cDNA Ends (RACE) analysis
To acquire the full length of lncRNA‐PAGBC, we performed 5′‐RACE and 3′‐RACE analyses with 5 μg of total RNA using the GeneRacerTM kit (Invitrogen) according to the manufacturer's instructions. The following gene‐specific primers are used for PCR: 5′‐CTACTCTTTACCTCCTCCCAACCATT‐3′ (5′RACE SP1), 5′‐CCCAGTTCCTTAGAATCTTCAGTTGC‐3′ (5′RACE SP2), 5′‐AGAAAGTTGGAGCAAAGGTTTGGCC‐3′ (5′RACE SP3) and 5′‐CCTCTTGCAGGAAGGATGGATTCTC‐3′ (3′RACE).
Northern blot analysis
A total of 30 μg indicated RNA was subjected to formaldehyde gel electrophoresis and transferred to a Biodyne Nylon membrane (Pall, NY). A biotin (Roche, Mannheim, Germany)‐labelled lncRNA‐PAGBC complementary RNA probe was prepared using in vitro transcription from pSPT19‐PAGBC which sequence is shown in Appendix Table S5. After 60 min of prehybridization in ULTRAhyb buffer (Ambion, Grand Island, NY), the membrane was hybridized, washed and detected as previously described 16.
Animal studies
The animal studies were approved by the Institutional Animal Care and Use Committee of Xinhua Hospital, School of Medicine, Shanghai Jiao Tong University, Shanghai, China. Male athymic BALB/c nude mice (4–5 weeks old) used for animal studies were purchased from the Shanghai Laboratory Animal Center of the Chinese Academy of Sciences (Shanghai, China). Randomization by flipping coins was applied when injection of GBC cells. Subcutaneous tumour growth assays were performed as previously described 13. Intrasplenic injection model was used for in vivo metastasis assays. Briefly, after anaesthesia, laparotomy was performed and the 2 × 10⁶ NOZ cells were slowly injected into the spleen. After injection, a splenectomy and closure of abdominal incision was performed. The metastases were monitored using the IVIS@ Lumina II system (Caliper Life Sciences, Hopkinton, MA) 10 min after intraperitoneal injection of 4.0 mg of luciferin (Gold Biotech) in 50 μl of saline. The ARRIVE guidelines were consulted when conducting animal studies.
RNA immunoprecipitation
RNA immunoprecipitation experiments were performed as previously described 10.
For anti‐AGO2 RIP, briefly, NOZ cells were transfected with miR‐133b, miR‐511 or microRNA negative control. After 48 h, 2 × 10⁷ NOZ cells were used to perform RIP experiments using an AGO2 antibody (Millipore, Bedford, MA) as described above. Five μg AGO2 antibody for each RIP was used with normal rabbit IgG as the negative control. The coprecipitated RNAs were then extracted and detected by qRT–PCR. The gene‐specific primer used for detecting lncRNA‐PAGBC is provided Appendix Table S6.
MS2‐RIP
NOZ cells were cotransfected with pSL‐MS2, pSL‐MS2‐PAGBC, pSL‐MS2‐mut(miR‐133b/511) with pMS2‐GFP (Addgene). After 48 h, cells were used to perform RNA immunoprecipitation (RIP) experiments as previously described 16. The RNA fraction isolated by RIP was analysed by qRT–PCR.
Cell cultures and treatments
The GBC cell lines GBC‐SD and SGC‐996 were purchased from Shanghai Institute for Biological Science, Chinese Academy of Science (Shanghai, China). NOZ and EH‐GB1 were obtained from the Health Science Research Resources Bank (Osaka, Japan). The cells were cultured as previously described 44. Cell lines were tested 1 month before the experiment by methods of morphology check by microscopy, growth curve analysis and mycoplasma detection according to the cell line verification test recommendations. Where indicated, cells were treated with actinomycin D (10 μmol/l) (Sigma‐Aldrich, Saint Louis, MO) for the indicated time.
Reverse transcription reactions and quantitative real‐time PCR
Total RNAs were extracted and the first‐strand cDNA was synthesized as previously described 44. The miRNA levels were measured by qRT–PCR using SYBR‐Green ΙΙ PCR kit (ABI) with U6 snRNA as the reference. LncRNA and mRNA levels were quantified using SYBR Green PCR kit (Takara Bio), with GAPDH as the reference. Each reaction was performed in triplicate. The relative expression of miRNA or mRNAs was calculated using the comparative ΔΔC t method, which was then converted to fold change. The primer sequences for qRT–PCR are provided in Appendix Table S5.
Isolation of cytoplasmic and nuclear RNA
Cytoplasmic and nuclear RNA were isolated and purified using the Cytoplasmic & Nuclear RNA Purification Kit (Norgen) according to the manufacturer's instructions.
In vitro translation
One microgram PSPT19‐PAGBC constructs were used for mRNA synthesis, and translation reactions were performed using TNT® SP6 Quick Coupled Transcription/Translation Systems according to the manufacturer's instructions (Promega). The translation products were separated by SDS–PAGE using 4–20% gradient gel and stained by Coomassie Brilliant Blue.
Western blot analysis
Western blot analysis was performed as previously described 44. The following antibodies were used in this study: AKT (#4691, CST), P‐AKT(#4060, CST), mTOR(#2983, CST), P‐mTOR(#5536, CST), PABPC1(Ab20160, Abcam), PIK3R3(Ab186612, Abcam), SOX4(Ab80261, Abcam), MRC1(AB64693, Abcam), β‐actin(A1978, sigma) or GAPDH(AB181602, Abcam).
Vectors construction
The cDNA encoding lncRNA‐PAGBC was synthesized by GenScript (Nanjing, China) and subcloned into the NheI and XhoI sites of pSL‐MS2‐12x vector (Addgene), named pSL‐MS2‐PAGBC. For lncRNA‐PAGBC mutants, eight nucleotides in the lncRNA‐PAGBC corresponding to 5′ UTR of miR‐133b and miR‐511 were deleted in the Mut constructs, named pSL‐MS2‐PAGBC‐mut(miR‐133b) and pSL‐MS2‐PAGBC‐mut(miR‐511), respectively. For luciferase reporter assay, pSL‐MS2‐PAGBC, pSL‐MS2‐PAGBC‐mut(miR‐133b) or pSL‐PAGBC‐mut(miR‐511) was double digested with NheI and XhoI, and then, the fragment containing lncRNA was subcloned into pmirGLO vector (Promega, Madison, WI), named pmirGLO‐PAGBC, pmirGLO‐PAGBC‐mut(miR‐133b) or pmirGLO‐PAGBC‐mut(miR‐511), respectively. The 3′ untranslated regions (3′‐UTRs) of SOX4 and PIK3R3 mRNA containing the mir‐133b and miR‐511 recognition sequences were PCR‐amplified and subcloned into the MluI and HindIII sites of pMiR‐Report Fluc vectors (Ambion), and eight nucleotides in the 3′‐UTR corresponding to 5′ UTR of miR‐133b and miR‐511 were deleted in the Mut constructs. The cDNA encoding lncRNA‐PAGBC was PCR‐amplified and subcloned into the Sac I and Xba I sites of pSPT19, named pSPT19‐PAGBC. The pSPT19‐PAGBC with eight nucleotides deletion mutations in the miR‐133b and miR‐511 response elements was synthesized using a KOD‐plus Site‐Directed Mutagenesis kit (TOYOBO) and named pSPT19‐PAGBC‐mut(miR‐133b) and pSPT19‐mut(miR‐511), respectively. All the constructs were confirmed by DNA sequencing.
Generation of stable cell lines with overexpression or downregulation of lncRNA‐PAGBC
To obtain cell lines stably expressing lncRNA‐PAGBC, lncRNA‐PAGBC cDNA was PCR‐amplified and subcloned to the lentiviral vector Ubi‐MCS‐SV40‐EGFP‐IRES‐puromycin (Genechem, Shanghai, China). Recombinant lentiviruses containing the lncRNA‐PAGBC gene (Lv‐PAGBC) were produced by GeneChem. SGC‐996 and EHGB‐1 cells were infected with concentrated virus and were selected with 1 μg/ml puromycin for 2 weeks. Real‐time PCR was performed to identify the stably overexpressing cell lines.
For the construction of cell lines stably expressing lncRNA‐PAGBC shRNA, the shRNA sequences were shown in Appendix Table S5. shRNA‐lncRNA‐PAGBC and negative control shRNA were synthesized and inserted into hU6‐MCS‐Ubiquitin‐EGFP‐IRES‐puromycin lentiviral vector. Recombinant lentiviruses expressing lncRNA‐PAGBC‐shRNA or negative control shRNA (Lv‐shPAGBC and Lv‐shNC, respectively) were produced by Genechem. GBC‐SD and NOZ cells were infected with concentrated virus, and the culture medium was replaced after 24‐h incubation. Then, cells were treated with 2 μg/ml puromycin for 2 weeks for the selection of stable cell lines. The expression of lncRNA‐PAGBC in the stable cell lines was validated by qRT–PCR analysis.
Cell viability analyses and colony formation assay
Cell viability was assayed according to the manufacturer's instructions with cell‐counting kit‐8 (Dojindo Laboratories). Briefly, cells (1.0 × 10³ cells/well) were seeded into 96‐well plates in their basal media supplemented with 10% FBS. At each time point, 10 μl of CCK8 solution was added and incubated. The staining intensity was measured by determining the absorbance at 450 nm.
Both non‐transfected and transfected cells (200 cells/well) were seeded in 12‐well plates, and the colony formation assays were performed as previously described 13.
The experiments were performed in triplicate.
In vitro migration and invasion assays
The migrative capacity and invasive capacity of gallbladder cancer cells were determined using 8‐μm transwell filters (BD Biosciences) and performed as previously described 13. GBC‐SD (3 × 10⁴), NOZ (2.5 × 10⁴), SGC‐996 (10 × 104) and EHGB‐1 (3 × 10⁴) cells were used in migration and invasion assays. The experiments were performed in triplicate.
RNA fluorescence in situ hybridization
A digoxin (Roche, Mannheim, Germany)‐labelled lncRNA‐PAGBC complementary DNA probe was synthesized in vitro, which sequence is shown in Appendix Table S5, and a negative/scramble control was used for RNA fluorescence in situ hybridization (FISH). GBC‐SD and NOZ cells were seeded onto autoclaved glass slides. The following procedures were performed as previously described 45 with slight modification.
Transient transfection
Transfections were performed using the Lipofectamine 2000 kit (Invitrogen) according to the manufacturer's instructions. The microRNA inhibitors, double‐stranded microRNA mimics and their respective negative control RNAs (GenePharma) were introduced into cells at a final concentration of 50 nM. The siRNA against PABPC1 was synthesized as the sequence shown in Appendix Table S5. The cells were harvested at 48 h after transfection.
miR‐511‐5p RNA sequencing
Total RNA was extracted from NOZ and EHGB‐1 cells using TRIzol, and 1 μg total RNA was converted into cDNA using Mir‐X™ miRNA First Strand Synthesis Kit (clonetech). Then miR‐511‐5p were PCR‐amplified using the following primers: 5′‐CGGGTGTCTTTTGCTCTGCAGTCA‐3′ (Forward primer) and mRQ 3′primer (Reverse primer) provided in the kit. The products were then subcloned into TA vector and transformed into competent cells. After incubating overnight at 37°C, we selected four clones in NOZ group and two clones in EHGB‐1 group for subsequent sequencing. The results of sequencing can be found in the Source Data for Expanded View and Appendix files.
Immunohistochemical (IHC) analysis in human GBC tissues
Immunohistochemical staining of patient tissue sections was performed as previously described 46. PABPC1, SOX4 and PIK3R3 expression in benign and malignant specimens was evaluated.
Statistical analysis
All statistical analyses were performed using SPSS for Windows, Version 19.0. For statistical comparisons, one‐way analysis of variance, chi‐square tests, Fisher's exact test and two‐tailed Student's t‐tests were performed as appropriate. The survival curves were calculated by the Kaplan‐Meier method, and the differences were assessed with a log‐rank test. The Cox proportional hazards model was used to determine independent factors, which were based on the variables selected through univariate analysis. The following variables were included: tumour TNM stage, PAGBC expression level, R0 dissection, CA19‐9 levels, pre‐operative serum total bilirubin, tumour differentiation, age and gender. A P‐value < 0.05 was considered significant.
Author contributions
LZ, S‐HS and Y‐BL conceived and directed the study. X‐SW, FW, H‐FL, Y‐PH, LZ, S‐HS and Y‐BL contributed to the project design. X‐SW, FW, H‐FL, Y‐PH, LJ, FZ, M‐LL, X‐AW, Y‐PJ and Y‐JZ performed experiments. WL, W‐GW and Y‐JS analysed the bioinformatics data. HW, YC, R‐FB, H‐BL and ZW contributed samples, data and comments on the manuscript. X‐SW, FW, H‐FL, Y‐PH, Y‐CZ and WG analysed and interpreted the data. WL, W‐GW and Y‐JS contributed reagents, materials and/or analysis tools. X‐SW, FW, H‐FL and Y‐PH wrote the manuscript.
Conflict of interest
The authors declare that they have no conflict of interest.
Supporting information
Appendix
Expanded View Figures PDF
Dataset EV1
Source Data for Expanded View and Appendix
Review Process File
Source Data for Figure 1
Source Data for Figure 5
Source Data for Figure 6
Source Data for Figure 7
Acknowledgements
This study was supported by the National Natural Science Foundation of China (No. 81502433, 31620103910 and 91440203), the Program for Changjiang Scholars, the Leading Talent Program of Shanghai, the Shanghai Rising‐Star Program (No. 15QA1403100), the Shanghai Science and Technology Commission Key Basic Research Program (No. 16JC1400200), the Key Program of Shanghai Science and Technology Commission (No. 16411952501), the Multiple Central Clinical Research Program of Shanghai Jiao Tong University School of Medicine (No. DLY201507), the Precision Medicine Research Program of Shanghai Jiao Tong University School of Medicine (No. 15ZH4003), the Doctoral Innovation Fund Projects from Shanghai Jiao Tong University School of Medicine (No. BXJ201426) and the Hangzhou Science and Technology Commission Project (No. 20140633B04).
EMBO Reports (2017) 18: 1837–1853
Contributor Information
Lei Zheng, Email: lzheng6@jhmi.edu.
Shu‐Han Sun, Email: shsun@vip.sina.com.
Ying‐Bin Liu, Email: liuybphd@126.com.
References
- 1. Torre LA, Bray F, Siegel RL, Ferlay J, Lortet‐Tieulent J, Jemal A (2015) Global cancer statistics, 2012. CA Cancer J Clin 65: 87–108 [DOI] [PubMed] [Google Scholar]
- 2. Batra Y, Pal S, Dutta U, Desai P, Garg PK, Makharia G, Ahuja V, Pande GK, Sahni P, Chattopadhyay TK et al (2005) Gallbladder cancer in India: a dismal picture. J Gastroenterol Hepatol 20: 309–314 [DOI] [PubMed] [Google Scholar]
- 3. Wu XS, Shi LB, Li ML, Ding Q, Weng H, Wu WG, Cao Y, Bao RF, Shu YJ, Ding QC et al (2014) Evaluation of two inflammation‐based prognostic scores in patients with resectable gallbladder carcinoma. Ann Surg Oncol 21: 449–457 [DOI] [PubMed] [Google Scholar]
- 4. Butte JM, Matsuo K, Gönen M, D'Angelica MI, Waugh E, Allen PJ, Fong Y, DeMatteo RP, Blumgart L, Endo I et al (2011) Gallbladder cancer: differences in presentation, surgical treatment, and survival in patients treated at centers in three countries. J Am Coll Surg 212: 50–61 [DOI] [PubMed] [Google Scholar]
- 5. Li M, Zhang Z, Li X, Ye J, Wu X, Tan Z, Liu C, Shen B, Wang XA, Wu W et al (2014) Whole‐exome and targeted gene sequencing of gallbladder carcinoma identifies recurrent mutations in the ErbB pathway. Nat Genet 46: 872–876 [DOI] [PubMed] [Google Scholar]
- 6. Lazcano‐Ponce EC, Miquel JF, Muñoz N, Herrero R, Ferrecio C, Wistuba II, Alonso de Ruiz P, Aristi Urista G, Nervi F (2001) Epidemiology and molecular pathology of gallbladder cancer. CA Cancer J Clin 51: 349–364 [DOI] [PubMed] [Google Scholar]
- 7. Cech TR, Steitz JA (2014) The noncoding RNA revolution‐trashing old rules to forge new ones. Cell 157: 77–94 [DOI] [PubMed] [Google Scholar]
- 8. Geisler S, Coller J (2013) RNA in unexpected places: long non‐coding RNA functions in diverse cellular contexts. Nat Rev Mol Cell Biol 14: 699–712 [DOI] [PMC free article] [PubMed] [Google Scholar]
- 9. Liu B, Sun L, Liu Q, Gong C, Yao Y, Lv X, Lin L, Yao H, Su F, Li D et al (2015) A cytoplasmic NF‐κB interacting long noncoding RNA blocks IκB phosphorylation and suppresses breast cancer metastasis. Cancer Cell 27: 370–381 [DOI] [PubMed] [Google Scholar]
- 10. Yang F, Zhang L, Huo XS, Yuan JH, Xu D, Yuan SX, Zhu N, Zhou WP, Yang GS, Wang YZ et al (2011) Long noncoding RNA high expression in hepatocellular carcinoma facilitates tumor growth through enhancer of zeste homolog 2 in humans. Hepatology 54: 1679–1689 [DOI] [PubMed] [Google Scholar]
- 11. Cesana M, Cacchiarelli D, Legnini I, Santini T, Sthandier O, Chinappi M, Tramontano A, Bozzoni I (2011) A long noncoding RNA controls muscle differentiation by functioning as a competing endogenous RNA. Cell 147: 358–369 [DOI] [PMC free article] [PubMed] [Google Scholar]
- 12. Salmena L, Poliseno L, Tay Y, Kats L, Pandolfi PP (2011) A ceRNA hypothesis: the rosetta stone of a hidden RNA language? Cell 146: 353–358 [DOI] [PMC free article] [PubMed] [Google Scholar]
- 13. Wu XS, Wang XA, Wu WG, Hu YP, Li ML, Ding Q, Weng H, Shu YJ, Liu TY, Jiang L et al (2014) MALAT1 promotes the proliferation and metastasis of gallbladder cancer cells by activating the ERK/MAPK pathway. Cancer Biol Ther 15: 806–814 [DOI] [PMC free article] [PubMed] [Google Scholar]
- 14. Pujana MA, Han JD, Starita LM, Stevens KN, Tewari M, Ahn JS, Rennert G, Moreno V, Kirchhoff T, Gold B et al (2007) Network modeling links breast cancer susceptibility and centrosome dysfunction. Nat Genet 39: 1338–1349 [DOI] [PubMed] [Google Scholar]
- 15. Liao Q, Liu C, Yuan X, Kang S, Miao R, Xiao H, Zhao G, Luo H, Bu D, Zhao H et al (2011) Large‐scale prediction of long non‐coding RNA functions in a coding‐non‐coding gene co‐expression network. Nucleic Acids Res 39: 3864–3878 [DOI] [PMC free article] [PubMed] [Google Scholar]
- 16. Yuan JH, Yang F, Wang F, Ma JZ, Guo YJ, Tao QF, Liu F, Pan W, Wang TT, Zhou CC et al (2014) A long noncoding RNA activated by TGF‐β promotes the invasion‐metastasis cascade in hepatocellular carcinoma. Cancer Cell 25: 666–681 [DOI] [PubMed] [Google Scholar]
- 17. Lewis BP, Burge CB, Bartel DP (2005) Conserved seed pairing, often flanked by adenosines, indicates that thousands of human genes are microRNA targets. Cell 120: 15–20 [DOI] [PubMed] [Google Scholar]
- 18. Koumangoye RB, Andl T, Taubenslag KJ, Zilberman ST, Taylor CJ, Loomans HA, Andl CD (2015) SOX4 interacts with EZH2 and HDAC3 to suppress microRNA‐31 in invasive esophageal cancer cells. Mol Cancer 14: 24 [DOI] [PMC free article] [PubMed] [Google Scholar]
- 19. Ramezani‐Rad P, Geng H, Hurtz C, Chan LN, Chen Z, Jumaa H, Melnick A, Paietta E, Carroll WL, Willman CL et al (2013) SOX4 enables oncogenic survival signals in acute lymphoblastic leukemia. Blood 121: 148–155 [DOI] [PMC free article] [PubMed] [Google Scholar]
- 20. Riesco‐Eizaguirre G, Wert‐Lamas L, Perales‐Patón J, Sastre‐Perona A, Fernández LP, Santisteban P (2015) The miR‐146b‐3p/PAX8/NIS regulatory circuit modulates the differentiation phenotype and function of thyroid cells during carcinogenesis. Cancer Res 75: 4119–4130 [DOI] [PubMed] [Google Scholar]
- 21. Cao G, Dong W, Meng X, Liu H, Liao H, Liu S (2015) MiR‐511 inhibits growth and metastasis of human hepatocellular carcinoma cells by targeting PIK3R3. Tumour Biol 36: 4453–4459 [DOI] [PubMed] [Google Scholar]
- 22. Squadrito ML, Pucci F, Magri L, Moi D, Gilfillan GD, Ranghetti A, Casazza A, Mazzone M, Lyle R, Naldini L et al (2012) miR‐511‐3p modulates genetic programs of tumor‐associated macrophages. Cell Rep 1: 141–154 [DOI] [PubMed] [Google Scholar]
- 23. Huarte M, Guttman M, Feldser D, Garber M, Koziol MJ, Kenzelmann‐Broz D, Khalil AM, Zuk O, Amit I, Rabani M et al (2010) A large intergenic noncoding RNA induced by p53 mediates global gene repression in the p53 response. Cell 142: 409–419 [DOI] [PMC free article] [PubMed] [Google Scholar]
- 24. Massimelli MJ, Kang JG, Majerciak V, Le SY, Liewehr DJ, Steinberg SM, Zheng ZM (2011) Stability of a long noncoding viral RNA depends on a 9‐nt core element at the RNA 5′ end to interact with viral ORF57 and cellular PABPC1. Int J Biol Sci 7: 1145–1160 [DOI] [PMC free article] [PubMed] [Google Scholar]
- 25. Fatscher T, Boehm V, Weiche B, Gehring NH (2014) The interaction of cytoplasmic poly(A)‐binding protein with eukaryotic initiation factor 4G suppresses nonsense‐mediated mRNA decay. RNA 20: 1579–1592 [DOI] [PMC free article] [PubMed] [Google Scholar]
- 26. Zhang J, Zhu N, Chen X (2015) A novel long noncoding RNA LINC01133 is upregulated in lung squamous cell cancer and predicts survival. Tumour Biol 36: 7465–7471 [DOI] [PubMed] [Google Scholar]
- 27. Zang C, Nie FQ, Wang Q, Sun M, Li W, He J, Zhang M, Lu KH (2016) Long non‐coding RNA LINC01133 represses KLF2, P21 and E‐cadherin transcription through binding with EZH2, LSD1 in non small cell lung cancer. Oncotarget 7: 11696–11707 [DOI] [PMC free article] [PubMed] [Google Scholar]
- 28. Kong J, Sun W, Li C, Wan L, Wang S, Wu Y, Xu E, Zhang H, Lai M (2016) Long non‐coding RNA LINC01133 inhibits epithelial‐mesenchymal transition and metastasis in colorectal cancer by interacting with SRSF6. Cancer Lett 380: 476–484 [DOI] [PubMed] [Google Scholar]
- 29. Zeng HF, Qiu HY, Feng FB (2017) Long noncoding RNA LINC01133 sponges miR‐422a to aggravate the tumorigenesis of human osteosarcoma. Oncol Res 10.3727/096504017X14907375885605 [DOI] [PMC free article] [PubMed] [Google Scholar] [Retracted]
- 30. Wang J, Liu X, Wu H, Ni P, Gu Z, Qiao Y, Chen N, Sun F, Fan Q (2010) CREB up‐regulates long non‐coding RNA, HULC expression through interaction with microRNA‐372 in liver cancer. Nucleic Acids Res 38: 5366–5383 [DOI] [PMC free article] [PubMed] [Google Scholar]
- 31. Zhao Y, Huang J, Zhang L, Qu Y, Li J, Yu B, Yan M, Yu Y, Liu B, Zhu Z (2014) MiR‐133b is frequently decreased in gastric cancer and its overexpression reduces the metastatic potential of gastric cancer cells. BMC Cancer 14: 34 [DOI] [PMC free article] [PubMed] [Google Scholar]
- 32. Zhang C, Chi YL, Wang PY, Wang YQ, Zhang YX, Deng J, Lv CJ, Xie SY (2012) miR‐511 and miR‐1297 inhibit human lung adenocarcinoma cell proliferation by targeting oncogene TRIB2. PLoS One 7: e46090 [DOI] [PMC free article] [PubMed] [Google Scholar]
- 33. Thomson DW, Dinger ME (2016) Endogenous microRNA sponges: evidence and controversy. Nat Rev Genet 17: 272–283 [DOI] [PubMed] [Google Scholar]
- 34. Sharma N, Nanta R, Sharma J, Gunewardena S, Singh KP, Shankar S, Srivastava RK (2015) PI3K/AKT/mTOR and sonic hedgehog pathways cooperate together to inhibit human pancreatic cancer stem cell characteristics and tumor growth. Oncotarget 6: 32039–32060 [DOI] [PMC free article] [PubMed] [Google Scholar]
- 35. Mabuchi S, Kuroda H, Takahashi R, Sasano T (2015) The PI3K/AKT/mTOR pathway as a therapeutic target in ovarian cancer. Gynecol Oncol 137: 173–179 [DOI] [PubMed] [Google Scholar]
- 36. Xu D, Yang F, Yuan J‐H, Zhang L, Bi H‐S, Zhou C‐C, Liu F, Wang F, Sun SH (2013) Long noncoding RNAs associated with liver regeneration 1 accelerates hepatocyte proliferation during liver regeneration by activating Wnt/b‐Catenin signaling. Hepatology 58: 739–751 [DOI] [PubMed] [Google Scholar]
- 37. Yang F, Huo X‐S, Yuan S‐X, Zhang L, Zhou W‐P, Wang F, Sun SH (2013) Repression of the long noncoding RNA‐LET by histone deacetylase 3 contributes to hypoxia‐mediated metastasis. Mol Cell 49: 1083–1096 [DOI] [PubMed] [Google Scholar]
- 38. Hämmerle M, Gutschner T, Uckelmann H, Ozgur S, Fiskin E, Gross M, Skawran B, Geffers R, Longerich T, Breuhahn K (2013) Posttranscriptional destabilization of the liver‐specific long noncoding RNA HULC by the IGF2 mRNA‐binding protein 1 (IGF2BP1). Hepatology 58: 1703–1712 [DOI] [PubMed] [Google Scholar]
- 39. Mangus DA, Evans MC, Jacobson A (2003) Poly(A)‐binding proteins: multifunctional scaffolds for the post‐transcriptional control of gene expression. Genome Biol 4: 223 [DOI] [PMC free article] [PubMed] [Google Scholar]
- 40. Howe E, Holton K, Nair S, Schlauch D, Sinha R, Quackenbush J (2010) MeV: MultiExperiment Viewer In Biomedical informatics for cancer research, Ochs MF, Casagrande JT, Davuluri RV. (eds), pp 267–277. Boston, MA: Springer; [Google Scholar]
- 41. Eisen MB, Spellman PT, Brown PO, Botstein D (1998) Cluster analysis and display of genome‐wide expression patterns. Proc Natl Acad Sci USA 95: 14863–14868 [DOI] [PMC free article] [PubMed] [Google Scholar]
- 42. Prieto C, Risueno A, Fontanillo C, De las Rivas J (2008) Human gene coexpression landscape: confident network derived from tissue transcriptomic profiles. PLoS One 3: e3911 [DOI] [PMC free article] [PubMed] [Google Scholar]
- 43. Barabasi AL, Oltvai ZN (2004) Network biology: understanding the cell's functional organization. Nat Rev Genet 5: 101–113 [DOI] [PubMed] [Google Scholar]
- 44. Shu YJ, Bao RF, Jiang L, Wang Z, Wang XA, Zhang F, Liang HB, Li HF, Ye YY, Xiang SS et al (2017) MicroRNA‐29c‐5p suppresses gallbladder carcinoma progression by directly targeting CPEB4 and inhibiting the MAPK pathway. Cell Death Differ 24: 445–457 [DOI] [PMC free article] [PubMed] [Google Scholar]
- 45. Khaitan D, Dinger ME, Mazar J, Crawford J, Smith MA, Mattick JS, Perera RJ (2011) The melanoma‐upregulated long noncoding RNA SPRY4‐IT1 modulates apoptosis and invasion. Cancer Res 71: 3852–3862 [DOI] [PubMed] [Google Scholar]
- 46. Shu YJ, Weng H, Ye YY, Hu YP, Bao RF, Cao Y, Wang XA, Zhang F, Xiang SS, Li HF et al (2015) SPOCK1 as a potential cancer prognostic marker promotes the proliferation and metastasis of gallbladder cancer cells by activating the PI3K/AKT pathway. Mol Cancer 14: 12 [DOI] [PMC free article] [PubMed] [Google Scholar]
Associated Data
This section collects any data citations, data availability statements, or supplementary materials included in this article.
Supplementary Materials
Appendix
Expanded View Figures PDF
Dataset EV1
Source Data for Expanded View and Appendix
Review Process File
Source Data for Figure 1
Source Data for Figure 5
Source Data for Figure 6
Source Data for Figure 7


