Abstract
In situ observations and a coupled bio-physical model were used to study the germination, initiation, and development of the Gulf of Maine (GOM) Alexandrium fundyense bloom in 2006. Hydrographic measurements and comparisons with GOM climatology indicate that 2006 was a year with normal coastal water temperature, salinity, current and river runoff conditions. A. fundyense cyst abundance in bottom sediments preceding the 2006 bloom was at a moderate level compared to other recent annual cyst survey data. We used the coupled bio-physical model to hindcast coastal circulation and A. fundyense cell concentrations. Field data including water temperature, salinity, velocity time series and surface A. fundyense cell concentration maps were applied to gauge the model’s fidelity. The coupled model is capable of reproducing the hydrodynamics and the temporal and spatial distributions of A. fundyense cell concentration reasonably well. Model hindcast solutions were further used to diagnose physical and biological factors controlling the bloom dynamics. Surface wind fields modulated the bloom’s horizontal and vertical distribution. The initial cyst distribution was found to be the dominant factor affecting the severity and the interannual variability of the A. fundyense bloom. Initial cyst abundance for the 2006 bloom was about 50% of that prior to the 2005 bloom. As the result, the time-averaged gulf-wide cell concentration in 2006 was also only about 60% of that in 2005. In addition, weaker alongshore currents and episodic upwelling-favorable winds in 2006 reduced the spatial extent of the bloom as compared with 2005.
Keywords: Harmful Algal Bloom, Coastal circulation, Gulf of Maine, bio-physical interaction
1. Introduction
In the Gulf of Maine (GOM), recurrent blooms of the toxic dinoflagellate Alexandrium fundyense have become a major economic and public issue to New England states, as they cause closures of shellfish beds in both nearshore and offshore waters. The most serious threat from these blooms is paralytic shellfish poisoning (PSP), which is a potentially fatal disorder for humans after ingestion of shellfish that have accumulated A. fundyense toxins.
Earlier studies have shown that A. fundyense blooms are regulated by a suite of highly complex biological and physical processes, and the timing and distribution of the bloom are closely related to the GOM coastal circulation (see for example, Anderson et al., 2005a DSR II Special Issue). The general circulation pattern within the gulf is cyclonic (e.g., Bigelow, 1927; Lynch et al, 1997; Pettigrew et al, 2005). A key coastal circulation component is the Maine Coastal Current (MCC), which consists of two main branches—the Eastern Maine Coastal Current (EMCC) and the western Maine Coastal Current (WMCC). The EMCC starts from the mouth of Bay of Fundy, following southwest to Penobscot. It often veers offshore south of Penobscot Bay (e.g., Pettigrew et al., 2005). Some fraction of the EMCC can continue along the coast to join the WMCC. Downstream, the WMCC is fed by the inshore branch of the EMCC as well as river runoff. The freshwater inputs continue feeding the alongshore current until it reaches a second branch point offshore of Cape Ann. At this point, one portion of flow episodically turns inshore into Massachusetts and Cape Cod Bays, and then rejoins the other southward-flowing portion of current northeast of Cape Cod. Further downstream, the current undergoes another bifurcation, with one branch flowing toward the Middle Atlantic Bight, and another flowing around Georges Bank (GB) (Lynch et al., 1997). On GB, the mean current has an average speed of 10cm/s, leading to a recirculation period of ~ 48 days. The highest current speed is near the bank boundary, rather than at the center (Limeburner and Beardsley,1996).
While these mean circulation patterns are well described, GOM coastal currents also have significant seasonal and interannual variability (e.g., Pettigrew et al., 2005), which in turn may dramatically affect the transport and distribution of A. fundyense populations. Characterizing environmental variability and understanding how physical and biological factors govern bloom germination, initiation, and development have therefore been the focal point for A. fundyense dynamics studies in recent years. In particular, Anderson et al. (2005a) showed that the extensive A. fundyense bloom in summer 2005 (the largest in at least 33 years) was related to anomalous hydrographic and biological conditions. Follow-up analyses (He and McGillicuddy, 2008; He et al., 2008) suggested the high abundance of cysts in western GOM was the primary cause of the 2005 bloom.
In a sense, the 2006 bloom season provides yet another opportunity (using a new set of cyst observations) to test the hypothesis that cyst abundance is a first-order predictor of overall magnitude of the bloom. Specifically, cyst abundance in the western GOM preceding the 2006 bloom was only about half that which preceded the 2005 bloom. Based on that observation, one would predict the 2006 bloom to be about half as severe as that in 2005. The objective of this study is to investigate the 2006 A. fundyense bloom and contrast its underlying mechanisms with those of the 2005 bloom. Both in situ observations and numerical modeling experiments are used to depict the full space-time evolution of the bloom and to reveal the underlying circulation and bloom dynamics.
2. Data and Methods
2.1. In situ Observations
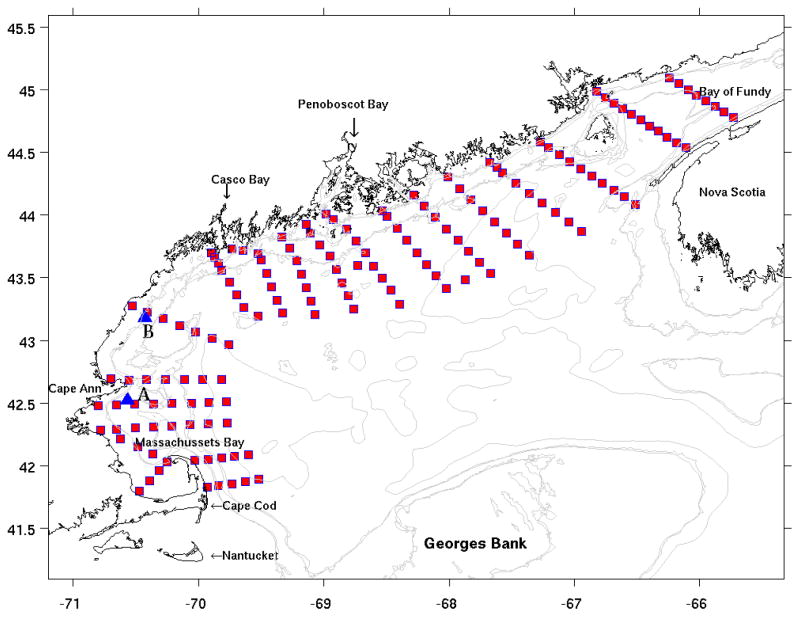
A coast-scale hydrographic survey was executed on the R/V Oceanus (Voyage OC425) between June 6th and 17th, 2006. During this 12-day field survey, a total of 220 hydrographic stations between Massachusetts Bay and the Bay of Fundy were occupied. The first leg of the survey was conducted from June 6th to 13th, covering the entire gulf coast region, whereas the second leg reoccupied a portion of the initial stations in the western GOM. Here, we mainly focus on the first leg observations (Figure 1). In situ sampling consisted of traditional CTD/Rosette hydrography (temperature, conductivity, depth, light attenuation, Chlorophyll-a fluorescence) and underway Acoustic Doppler Current Profiler (ADCP) measurements. Water samples were used for surface A. fundyense enumeration (Anderson et al. 2005b), and some discrete nutrient analysis. Likewise, some smaller-scale Massachusetts Bay surveys spanning from April through late June were also utilized. In addition, buoy observations of meteorological and hydrographic data from the Gulf of Maine Ocean Observing System (GoMOOS, http://www.gomoos.org/) were also employed.
Figure 1.
Location of CTD stations performed during Oceanus 425 GOM survey. Also shown (blue triangles) are the locations of two GoMOOS mooring stations A and B.
2.2. The coupled bio-physical model
While in situ observations provide valuable information for describing physical and biological conditions during the A. fundyense bloom, they are still sparse in space and time to depict the evolution of the bloom and the underlying physical and biological dynamics. Therefore, a coupled physical-biological model was also used to simulate GOM hydrodynamics and the A. fundyense bloom concentration. Herein, we present a brief description of the coupled bio-physical modeling system. Interested readers are referred to He et al. (2008) for more details on the model.
The coupled modeling system consists of a circulation module and an A. fundyense population dynamics module. The circulation module is based on the Regional Ocean Modeling System (ROMS http://www.myroms.org/), which is a free-surface, hydrostatic, primitive-equation model in widespread use for estuarine, coastal and open ocean applications. ROMS employs split-explicit separation of fast barotropic and slow baroclinic modes, and is formulated in vertically stretched terrain-following coordinates (Shchepetkin and McWilliams, 2005). The computational kernel includes high-order advection and time-stepping schemes, weighted temporal averaging of the barotropic mode to reduce aliasing into the slow baroclinic motions, and conservative parabolic splines for vertical discretization. A redefinition of the barotropic pressure gradient is also applied in ROMS to reduce the truncation error, which has previously limited the accuracy of terrain-following coordinate models.
For the hydrodynamic open boundary conditions (OBCs), we implemented a multi-nested configuration consisting of circulation downscaling from a global data assimilative Hybrid Coordinate Ocean Model (HYCOM/NCODA) to a shelf-wide ROMS model (He and Chen, submitted), and subsequently to the GOM ROMS model (He et al., 2008). The global HYCOM assimilates satellite observed sea surface temperature and height, and ARGO measured temperature and salinity profiling data, providing daily data assimilative global circulation at about 10 km resolution (http://hycom.rsmas.miami.edu/dataserver). Inside HYCOM we have embedded the shelf-scale ROMS model that encompasses both the Mid-Atlantic Bight (MAB) and GOM (hereafter MABGOM ROMS) via a one-way nesting approach. Horizontal resolution of MABGOM ROMS is 5(10) km in the across- (along-) shelf direction. Vertically there are 36 terrain-following levels in the water column with higher resolution near the surface and bottom to better resolve boundary layer dynamics. For the purpose of one-way nesting, MABGOM ROMS OBCs were applied to tracers and baroclinic velocity following the method of Marchesiello et al. (2001), whereby Orlanski-type radiation conditions were used in conjunction with relaxation. Free surface and depth-averaged velocity boundary conditions were specified using the method of Flather (1976) with the external values provided by HYCOM. Since HYCOM solutions do not include tides, tidal harmonics (M2, S2, N2, K2, K1, O1, Q1) from an ADCIRC simulation of the western Atlantic (Luettich et al., 1992) were also superimposed. Analysis of tidal interior solution confirmed the approach yielded accurate tidal predictions as compared with earlier results (e.g. Moody et al., 1984; Xue et al., 2000; He et al., 2008). The Mellor-Yamada (1982) closure scheme is applied to compute the vertical turbulent mixing, as well as the quadratic drag formulation for the bottom friction specification. The same one-way nesting approach and OBC treatment were applied to subsequently downscale the shelf-scale MABGOM circulation to the inner-most GOM model. The GOM ROMS has a spatial resolution of 1 (3)-km in the across-shelf (alongshore) direction, and also has 36 vertical layers. Such multi-nested downscaling configuration enables the high-resolution GOM ROMS to achieve numerically accurate and dynamically consistent boundary forcing from its large scale “parent” model. Earlier studies (e.g., He et al., 2005) showed more accurate open OBCs specifications can lead to significant skill improvement in modeling GOM hydrography and transport, both of which are important for A. fundyense bloom dynamics.
The biological module is a single component A. fundyense model that contains parameterizations of A. fundyense germination, growth and mortality (Anderson et al., 2005; Stock et al., 2005; McGillicuddy et al., 2005; He et al., 2008). Fundamental to the construction of this model is that A. fundyense generally constitutes only a small portion of phytoplankton assemblage in the GOM, and that it is considered to have limited effect on ambient conditions such as nutrient concentration (Love et al., 2006) and predator abundance. The evolution of A. fundyense is then expressed as a single advection-diffusion-reaction equation:
| (1) |
where C is the cell concentration of A. fundyense, u⃗ and wa are the fluid velocity and A. fundyense upward swimming velocity, which is defined as 10 m day−1 (Kamykowski et al., 1992) in the ocean interior and tapered to zero to the ocean surface; K is the diffusivity, μ and mare the cell growth and mortality terms respectively, and Fgis the germination flux from A. fundyense cysts in the sediment layer to vegetative cells in the water column. The growth term μ is dependent on temperature (T), salinity (S), solar non-spectral irradiance (E) and nutrient concentration (NO3 in our model). Detailed formulations of these terms are presented in Stock et al. (2005) and later in He et al. (2008) for an improved temperature dependent mortality formulation. These formulations also are provided in the Appendix.
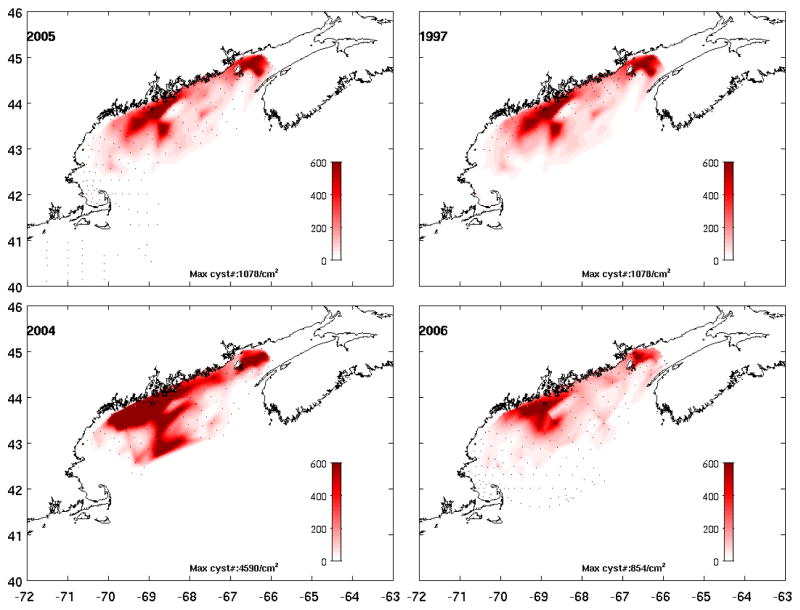
No-gradient boundary conditions were applied to cell concentration along model open boundaries. The initial A. fundyense cell concentration in the model was set to zero everywhere. Cells geminate from their benthic cyst stage in early spring, a process triggered by their endogenous clock modulated by ambient water temperature and light conditions (Anderson, 1997). Information about cyst abundance and distributions were derived from a gulf-wide sediment core survey conducted in fall 2005 (Figure 2, upper left panel). We assume changes in cyst abundance are negligible before germination begins. The cyst abundance is assumed constant throughout the bloom season. However, the resulting germination flux (Fg) is controlled by A. fundyense endogenous clock, and ambient water temperature and light conditions that are evolving over the time (Stock et al., 2005). Due to the lack of nutrient observations, three-dimensional climatological nutrient fields at four time points (Feb 15, May 15, Aug 15 and Nov. 15) were obtained from Petrie et al (1999), which were then linearly interpolated at each time step of the model simulation.
Figure 2.
Benthic cyst distribution observed in fall season of 2005, 1997, 2004 and 2006, respectively. These cyst data are used in the coupled physical-biological model for cell germination in the next year.
For both shelf-scale MABGOM ROMS and GOM ROMS hindcasts, the surface atmospheric forcing, including cloud fraction, precipitation, surface pressure and humidity, air temperature, surface wind, and shortwave radiation were obtained from the National Center for Environmental Prediction (NCEP), North America Regional Reanalysis (NARR). Spatial and temporal resolutions of these forcing fields are 32-km and 3 hours, respectively. They were applied in the standard bulk flux formulation to derive wind stress and net surface heat flux needed by the simulations. To further constrain the surface heat flux, we also followed the same approach used in He and Weisberg (2003) to relax the modeled SST field to NOAA Coast Watch daily, 1/10 degree cloud-free SST product with a timescale of 0.5 day.
Given the nature of the one-way nesting, model hindcasts were performed in a sequential order. The nested MABGOM ROMS hindcast was performed first, in which only the hydrodynamics was computed; then with the initial condition and OBCs from MABGOM ROMS, the nested GOM ROMS hindcast was carried out, in which both hydrodynamics and the A. fundyense cell concentration were simulated simultaneously. GOM ROMS also incorporates river runoff as an important forcing agent, for which real-time daily river runoff time series from United States Geological Survey (USGS) were used to provide freshwater input to the model. River temperature and salinity values are set as 0 psu and 6.5°C, respectively. Due to the lack of nutrient observations, the riverine nutrient imports are not considered in the model. The GOM ROMS coupled physical-biological simulation was run from March 15th to July 15th, 2006 to encompass the entire bloom season.
3. Model-Data Comparisons
Numerical models are advantageous for producing time- and space-continuous state variables, from which important ocean physical, biological processes can be deduced. However, extensive model-data comparisons are critical as they set the level of confidence for the model’s utility. For this important objective, we present below several different types of comparisons for validating the coupled GOM model.
3.1. Hydrographic comparison
A. Coastal Hydrography
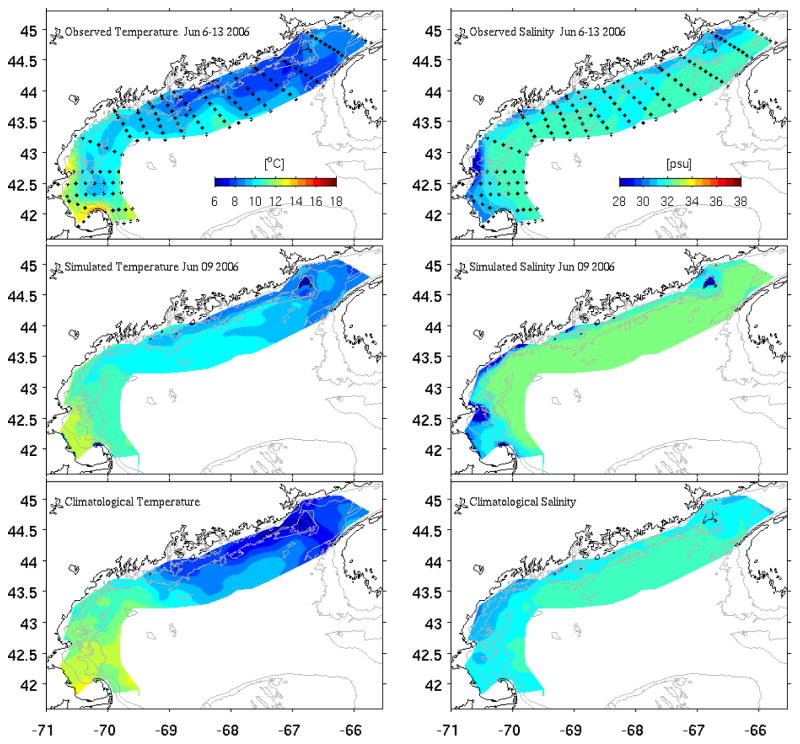
Temperature and salinity data from CTD casts provided a coast-scale view of the hydrographic conditions during June 6–13, 2006 (Figure 3). Sea surface temperatures (SST) in the western GOM were several degrees warmer than in the eastern GOM, a common characteristic that results from stronger tidal mixing in the eastern gulf that brings cold deep-water up to the surface. The salinity field indicates an alongshore band of fresh water with salinity less than 31.5 psu. It should be noted that these observations were taken on a moving platform over 7-day time period, thus representing only a quasi-synoptic hydrographic survey. For comparison, we present the modeled surface temperature and salinity fields at noon on June 9, the center of the survey period. Overall, simulated temperature and salinity fields reproduced the observed hydrographic features with compatible spatial structures, suggesting the model is capable of resolving these aspects reasonably well. One discrepancy is seen in the SST field, where the modeled offshore waters in the eastern GOM are ~ 1 °C warmer than the ship observation. This is likely due to the aliasing of the diurnal variability in the alongshore measurements (i.e., offshore stations were sampled at night). It is of interest to see that both observed and modeled temperature and salinity fields were not very different from June climatological temperature and salinity fields of the GOM. In contrast, the GOM hydrographic conditions in summer 2005 were significantly different from climatological mean conditions (He and McGillicuddy, 2008). The climatology used here was compiled with historical hydrographic data comprised of about 54,000 stations with coincident temperature and salinity measurements (Loder et al., 1997; Lynch et al., 1997). We recognize that part of the reason for the differences between our observations and climatology shown in Figure 3 is because the nearshore regions, especially estuaries and freshwater plumes, are not well represented in this climatology (Lynch et al., 1997).
Figure 3.
Comparisons of observed temperature and salinity fields from OC 425 survey [June 6–13] (upper panels), their modeled counterparts sampled on June 9 (middle panels), and the June climatological temperature and salinity fields (lower panels).
B. Mooring data
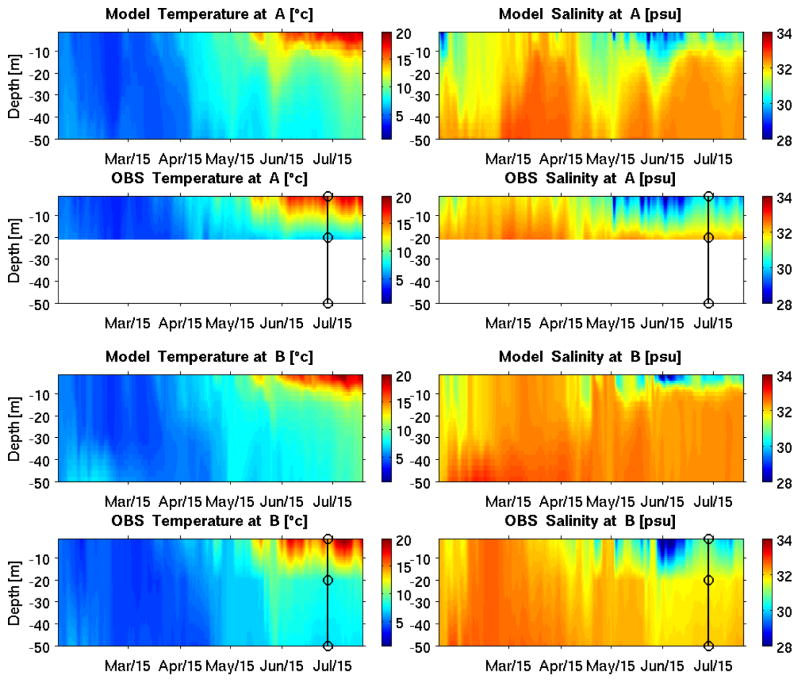
Point-by-point temperature and salinity time series comparisons provide another way to examine the model’s fidelity in resolving subsurface hydrographic conditions. At GOMOOS moorings A and B (see Figure 1 for their geographic locations), the modeled temperature and salinity time series track their observational counterparts reasonably well (Figure 4). The seasonal warming trend is well reproduced, both in its magnitude and timing. The simulated and observed salinity perturbations are also similar, suggesting the model is capable of resolving riverine freshwater influences. However, as the observed thermocline (halocline) in Figure 4 is determined by the coarse vertical spacing of the sensors (deployed at 2m, 20m, 50m, respectively) on the mooring, it is not possible to evaluate details of the vertical thermohaline structure produced by the model.
Figure 4.
Comparisons of simulated and observed temperature and salinity time series at GoMOOS mooring A (upper panels) and B (lower panels). Circles in the observation plots indicate depths where observed temperature and salinity are available.
C. Current
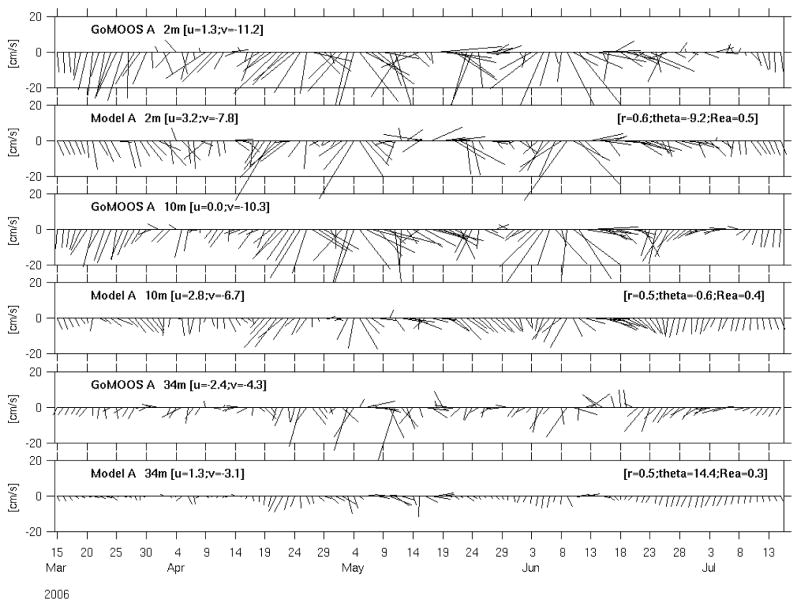
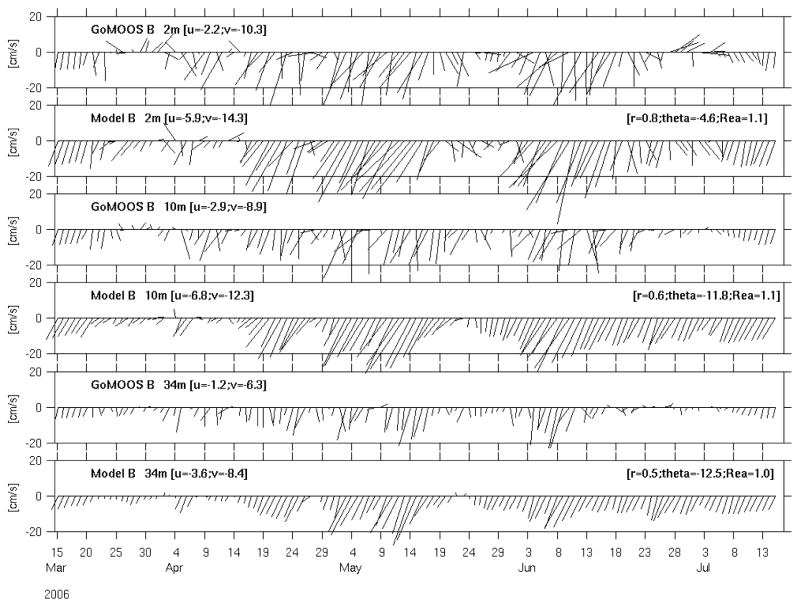
GoMOOS moorings also provide velocity measurements from surface current meters and subsurface Acoustic Doppler Current Profilers (ADCP), allowing for direct comparisons with simulated currents. At both mooring A (Figure 5) and mooring B (Figure 6), we present comparisons at three different depths: 2-m, 10-m and 34-m. These comparisons were quantified by a complex correlation analysis (He and Weisberg, 2002). Like subsurface temperature and salinity, the simulated and observed currents also compare with each other reasonably well. Correlation coefficients range between 0.5 and 0.8, and orientations between simulation and observation agree to between 0.6° and 14.4°. Disparities are seen in the time series on an event-by-event basis. First, the model fails to pick up some reversals in the observed currents. Second, the regression coefficients show that the model overestimates velocity magnitude by about 10% at station B, but underestimates velocity at station A. Such deficiencies may result from flaws in forcing, or inaccuracies of the model itself. Generally speaking, the model is performing better at Mooring B than at Mooring A. The latter station is located near Cape Ann and inside more complex bathymetric setting. Finer model resolution may be needed to improve the model solution at Mooring A.
Figure 5.
Comparisons of simulated and observed surface (2m) and sub-surface (10m, 34m ) currents at GoMOOS mooring A. Current time series are sampled every other day for better visualization. Each vector current time series is accompanied by its seasonal mean east and north velocity components (left-hand couplet), and each model/data comparison is quantified by its complex correlation coefficient, phase angle (or angular deviation of the model vectors from the data vector measured counterclockwise), and regression coefficient (right-hand triplet).
Figure 6.
Comparisons between modeled and observed current at GoMOOS mooring B. Quantitative comparisons are as in Figure 5.
In summary, these comparisons suggest the model is in general capable of reproducing observed hydrodynamics, lending confidence that the biological model is couched in a realistic physical environment.
3.2. A. fundyense cell concentration comparison
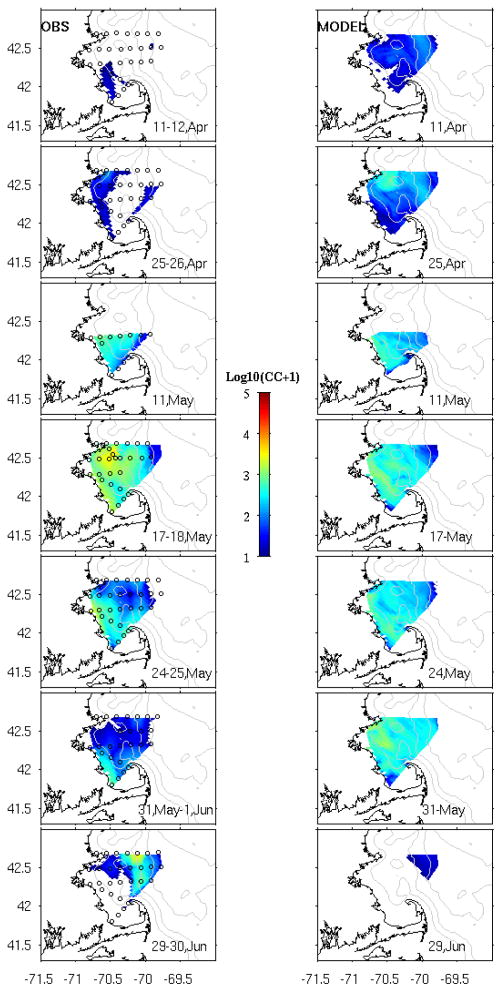
To validate the A. fundyense population dynamics model, direct comparisons were made between simulated and observed surface cell concentrations (Figure 7). In situ cell observations were collected by the gulf-wide survey in June and a series of sub-regional Massachusetts Bay surveys spanning from April through late June. To quantify model-data comparisons, we also extracted the simulated cell concentration at each sampling station, and computed a point-by-point model-data misfit.
Figure 7.
Comparisons of observed (left panels) and simulated (right panels) surface A. fundyense cell concentration. In-situ cell counts data were collected by Massachusetts Bay ship surveys from April through June. Cell concentrations are scaled by Log10 for better visualizations.
The first Massachusetts Bay survey (Figure 7, uppermost panel) was performed on April 11 and 12 during the initial phase of A. fundyense bloom. No cells were found in the coastal and offshore regions off Cape Ann, while cell concentrations lower than 50cells/L were present at a couple of stations in Massachusetts Bay. The modeled bloom on April 12th shows low cell concentrations in tens of cells/L offshore of Cape Ann, while Massachusetts Bay and Cape Cod Bay contain no cells nearshore, and small concentrations of less than 50cell/L near the eastern boundaries. On April 25~26th, the second Massachusetts Bay survey identified elevated cell concentrations in the Bay. The model reproduces the same spatial pattern, albeit overestimating the cell concentration at offshore stations. On May 11th, the field survey indicated increased cells in Massachusetts Bay, with concentrations ranging from hundreds to thousands of cells/L. The model captures the timing and intensity of the bloom. By May 17~18th, observed cell concentrations reached their peak value of thousands of cells/L, with the bloom extending throughout the bay and also offshore. Similar cell distributions are predicted by the model. By the end of May and early June (May 24~25th, May 31~Jun 1st) observations showed the bay-wide cell population declined to a few hundreds of cells/L. The modeled bloom, while capturing the spatial pattern reasonably well, overestimates cell abundance in the bay. By the end of June, Massachusetts Bay water were devoid of cells, whereas cell concentrations of hundreds cells/L were still present offshore. The model tracks the same pattern, although underestimating the concentration of these offshore patches.
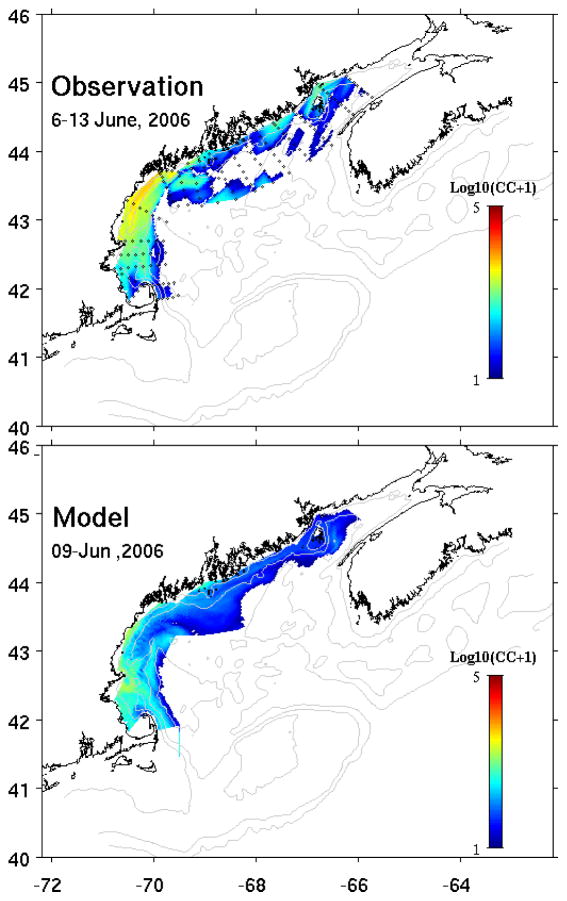
Cell concentration data from the gulf wide survey provided a large spatial context for evaluating the biological model performance (Figure 8). Observations indicated a substantial cell population residing in the nearshore areas from mid-coast Maine down into Massachusetts Bay. Relatively lower cell concentrations (less than a hundred cells/L) were found in the eastern GOM offshore waters as well as at the entrance of the Bay of Fundy. In particular, the absence of cells offshore in the eastern GOM suggests the Nova Scotia shelf was unlikely to be an upstream source of the A. fundyense bloom. The simulated bloom condition on June 9th captures the overall spatial distribution of the bloom, with large cell concentrations in the western GOM. The model tends to underestimate the cell concentration, especially in the coastal area south of the Casco Bay.
Figure 8.
Gulf-wide comparison of observed (upper panel) and simulated (lower panel) surface A. fundyense cell concentration. In-situ cell counts data were collected by the GOM ship survey (Oceanus 425) during June 6th~13th, 2006.
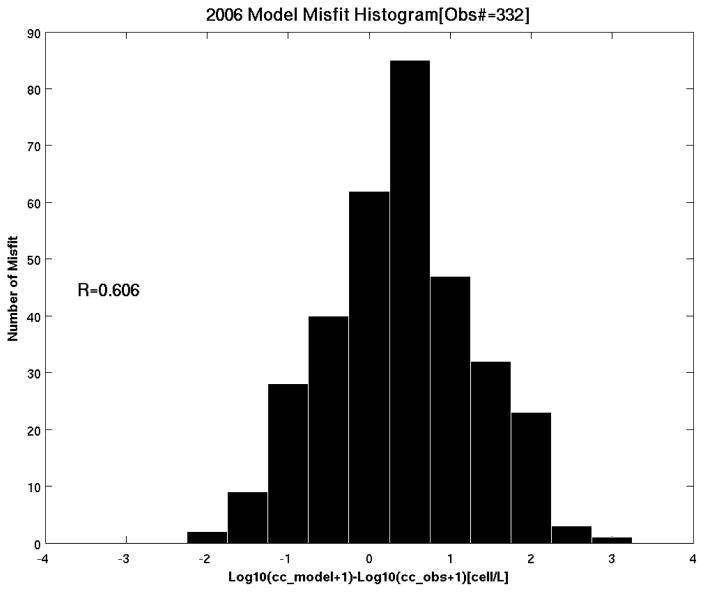
Taking all Massachusetts Bay and the Gulf wide survey data into consideration, we can summarize the overall comparison by a histogram of misfits between simulated and observed cell concentration (Figure 9). The center of mass of the histogram indicates the model is slightly overestimating the observations. Among a total of 332 comparisons, 190 (59%) of them are within ±50 cells/L. As another quantitative way of measuring the similarity, following Stock et al. (2005) we computed the overall spatial correlation coefficient between observed and simulated cell concentrations over 50 km scales. The correlation is 0.606, far exceeding the 95% confidence level, which is 0.189. Collectively, the model-data comparisons show that the coupled model is capable of reproducing the large-scale spatial distribution and temporal evolution of 2006 bloom. We recognize that model predictions are a smoothed rendition of reality. While the model can successfully capture the large scale bloom evolution, small-scale patchiness is not well resolved (Stock et al., 2005)
Figure 9.
Histogram of point-by-point misfit between observed and simulated surface cell concentration at a total of 332 stations. A logarithm scaling method is used for better visualization. R denotes the overall spatial correlation coefficient between the observed and simulated cell concentrations, serving as another quantitative way of measuring the spatial distribution similarity
4. Discussion
Given that the coupled model can produce a generally credible hindcast of the GOM hydrodynamics and A. fundyense bloom in 2006, it can be used as a basis to investigate the bloom’s initiation and development in a gulf-wide context. Term-by-term diagnostics of the model’s governing equation further allow for detailed evaluation of the relative importance of each potential controlling parameter.
4.1. Spatial and temporal variations
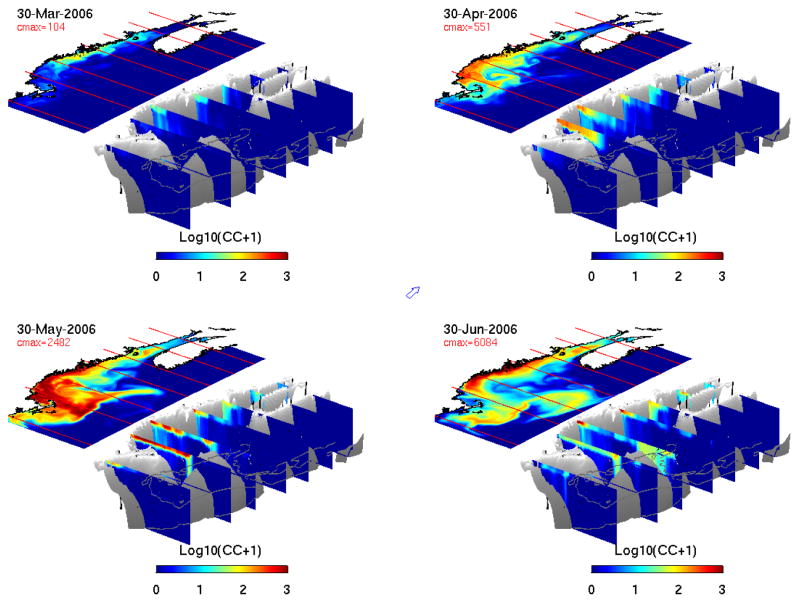
Model realizations provided detailed illustrations of bloom evolution and its 3-dimensional structure (Figure 10). On March 30th, A. fundyense starts to appear along the coast of the eastern GOM. Maximum cell concentrations are found offshore of Penobscot Bay, near the areas of highest benthic cyst abundance (see Fig. 2 upper-left panel). As a result of circulation transport and continued cell germination and vegetative growth, the bloom expands downstream and offshore. By April 30th, the highest population is south of Casco Bay, and the bloom begins to enter the Massachusetts Bay. Vertical sections reveal that cells recently germinated from the cyst bed off mid-coast Maine are fueling the surface bloom further downstream. Vegetative cells are largely concentrated in the upper water column, as upward swimming tends to keep them where light is abundant and temperature is warmer. By May 30th, even more cells are present in the western GOM with maximum cell concentrations close to 2500 cells/L. By this time, the bloom has entirely covered Massachusetts and Cape Cod Bays, and extended to the offshore waters to the south and east of Cape Cod, Martha’s Vineyard, and Nantucket. By virtue of the southward moving coastal current, much of the New England coast (with the exception of Rhode Island and Connecticut) is exposed to the bloom. One month later (June 30th), the A. fundyense bloom in the western GOM has begun to decay, while the bloom in the eastern GOM and the Bay of Fundy has started intensifying. This type of seasonal shift of the bloom or the pattern of PSP from west to east over time is consistent with previous observations (Anderson, 1997; Townsend et al, 2001) and numerical model studies (McGillicuddy et al., 2005; He et al., 2008). It is of interest to note that by this time, the highest cell concentration is found in coastal embayments near Penobscot Bay. Through advection of the coastal current, A. fundyense cells have also been transported to the Georges Bank. A few weeks later, cell concentrations start decaying gulf-wide, and by July 15th (not shown), A. fundyense cells are essentially absent from nearshore coastal waters, signaling the end of the bloom season. Interested readers are referred to an online animation to visualize the complete model simulation of 2006 GOM bloom (http://omglnx3.meas.ncsu.edu/yli/06hindcast/3d/dino_06.htm ).
Figure 10.
Snapshots of the three-dimensional A. fundyense bloom condition on March 30th, April 30th, May 30th and June 30th, respectively. In each panel, surface cell concentration map is displayed above 7 transects within the GOM showing both surface and vertical cell distributions. Cell concentrations are set to log10 scale. The arrow in the middle of the figure indicates the north direction in the 3-d plots.
4.2. Factors governing bloom evolution in the western GOM
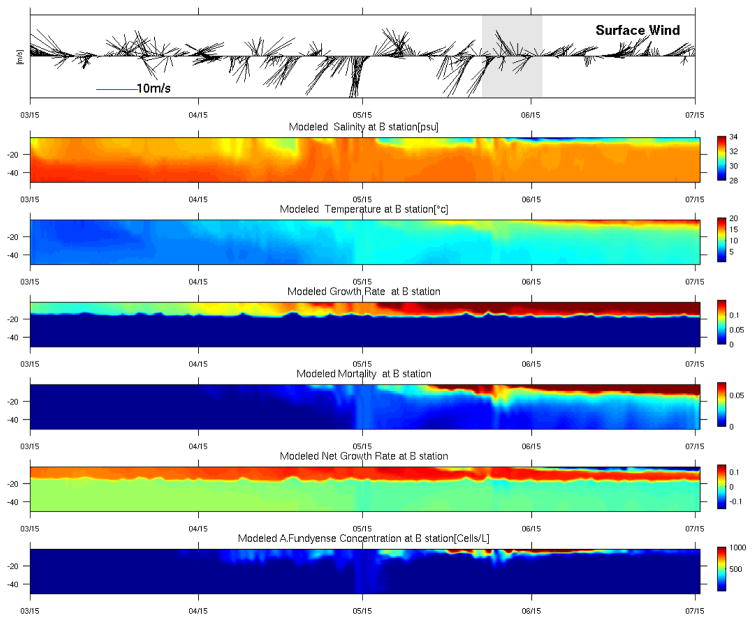
To better elucidate the temporal evolution and vertical structure of the bloom in response to surface wind forcing and in situ temperature and salinity conditions, we focused on a water column profile at GoMOOS mooring B (Figure 11). In the A. fundyense dynamical model, the net growth rate is a function of temperature, salinity, nutrients and light (Stock et al., 2005), whereas the mortality rate is a function of temperature based on a Q10 formula (He et al., 2008). Interested readers are referred to the Appendix for detailed formulations of these terms. Note that the growth rate is constrained by light in the euphotic zone, and the euphotic depth (Z_light) in the model is computed as a function of the shortwave radiation. Therefore Z_light (see Figure 11, panel 4) fluctuates with solar radiation. Below the Z_light, the growth rate is set zero. For the purpose of illustrating the temporal variations in both physical and biological fields, we divide the time series into 4 stages and discuss them sequentially:
Figure 11.
Time evolution of vertical profiles of key physical and biological parameters at GoMOOS mooring B. The first panel shows the observed wind vector time series. The following panels indicate model simulated temperature, salinity, growth rate, mortality, the net growth rate, and A.fundyense concentration, respectively. Vertical depths are in unit of meter.
Stage I. (March 15th – April 15th): temperature and salinity fields during this period are largely well mixed. Average temperature and salinity values are 7°C and 33 psu, respectively. The surface wind field is dominantly upwelling favorable, facilitating offshore transport of near-surface waters. While environmental conditions favor the net growth of A. fundyense at this location, less than 20 cells/L vegetative cells have geminated or have been transported from upstream. As a result, the water column has essentially no motile cell population throughout this period.
Stage II (April 15th – May 15th): Stratification starts to develop due to increased surface heating and freshwater runoff. The resulting higher water temperature and low salinity help to stimulate a faster growth rate, while the mortality term remains small. In response, the A. fundyense concentration rapidly increases to several hundreds cells/L. It is interesting to note that the period is also characterized by several northeasters with strong downwelling favorable wind forcing. In particular, the storm just before May 15th mixes the water column. The thermal stratification is almost completely eroded during that event, at the same time the surface cell population is mixed all the way to the bottom.
Stage III (May 15th – June 15th): Water temperature continues increasing to a value of ~ 11–14°, and two large river discharge events bring salinity values from 33 down to 31 psu. The growth rate keeps increasing (to ~ 15% per day at this stage). At the same time, the mortality rate also increases. Both are temperature dependent. The resultant net growth rate is about 50% larger than that in stage II. The cell population is largely trapped near the surface with a concentration as high as 1500 cells/L. In addition to stronger mixing associated with them, surface cell concentration maps (see the online animation) indicate the bloom is also pushed onshore, highlighting the importance of surface wind forcing in determining the spatial distribution of the bloom.
Stage IV (June 15th– July 15th). During this final stage, both thermal and haline stratifications are well established. Surface temperature (salinity) is now close to 20°C (28–30 psu). Thus, surface water is much warmer and fresher than waters 10 m below. The mortality rate now outpaces the growth rate, leading to a rapid decrease in cell concentration.. Surface wind again plays an important role in distributing cell population. Southwesterly winds dominate over the entire period, persistently pushing near-surface waters (along with its associated A. fundyense cells) further offshore. Therefore both surface wind forcing and hydrographic conditions work in concert to terminate the 2006 A. fundyense blooms in the coastal waters of the western GOM.
4.3. Factors governing bloom’s gulf-wide spatial distribution
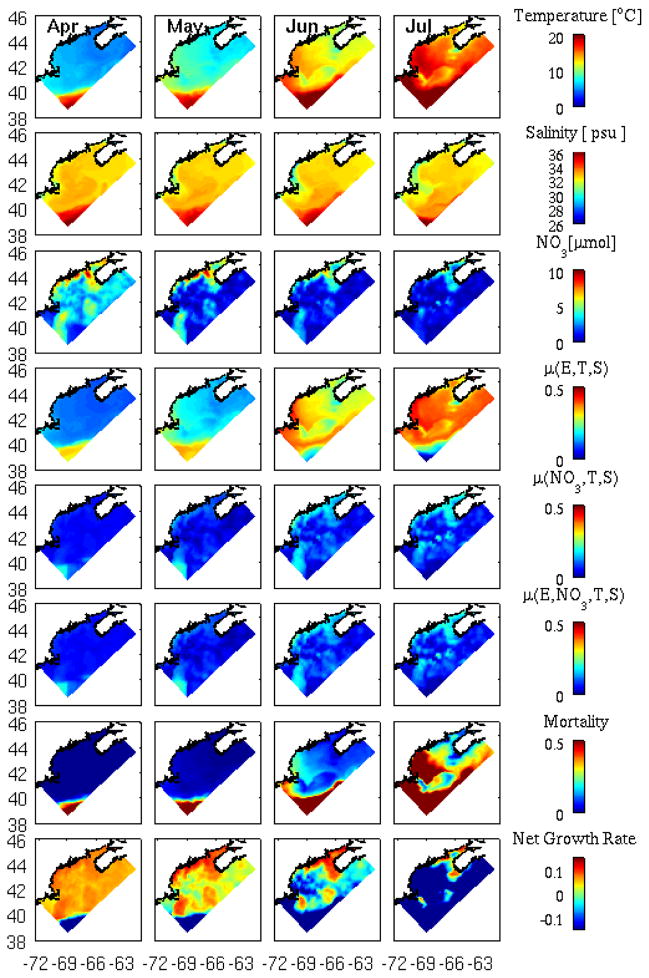
We now diagnose the model solutions in detail to understand processes controlling the gulf-wide seasonal evolution of the A. fundyense bloom. In this regard, analysis of terms regulating the growth rate (Figure 12) is particular enlightening. In general, the light-limited growth term [μ(E, T, S)] (fourth row) mimics the temperature distribution, whereas salinity variations have a relative minor contribution. We note that later in the season, the growth rate in the southeast corner of the domain (where high-temperature slope water resides) decreases rapidly in June and July. This is consistent with the formulation of temperature dependent growth term [μ(E, T, S)], which becomes inversely proportional to temperature when it is above 21°C.
Figure 12.
Monthly-mean distributions of modeled surface temperature, salinity, nutrient, and terms regulating A. fundyense growth and mortality rates for April, May, June, and July, respectively. Note the July mean is the average of conditions from July 1st to July 15th (the end of model simulation). μ(E,T,S)is the light limited growth, μ(NO3,T,S) is the nutrient limited growth, and μ(E,NO3,T,S) is the overall growth term that is determined by min(μ(E,T,S), μ(NO3,T,S)), according to the principle of Liebig’s Law (Liebig, 1845). The net growth term is [μ(E,NO3,T,S) –mortality]. Units for these biological rates are day−1.
The nutrient limitation term [μ(NO3, T, S)] (fifth row) convolves seasonal variations in nitrate, temperature, and salinity (third row). Early in the season, temperature is the dominant effect, whereas nutrient limitation is more pronounced later in the season, particularly in the western GOM. Light limitation does not play much of a role, such that the overall growth rate min( μ (NO3, T, S), μ (E, T, S)] (sixth row) mimics the temporal and spatial evolution of μ (NO3, T, S).
The mortality term (seventh row) is proportional to temperature based on the Q10 formula (Durbin and Durbin, 1992; He et al., 2008). According to the spatial differences in water temperature, higher loss rate is imposed in the western GOM (warm temperature) than in the eastern GOM (colder temperature) as the season progresses. One exception is on the Georges Bank, where water temperature is colder (and thus the mortality rate is lower) than surrounding waters because energetic tidal mixing constantly bringing cold deep ocean water to the surface.
Collectively, the net growth rate [μ(E, NO3, T, S )-mortality] (eighth row) indicates the upstream (eastward) shift of the center of mass of bloom is controlled primarily by increasing cell mortality in the western GOM, with a contribution from nutrient limitation as well.
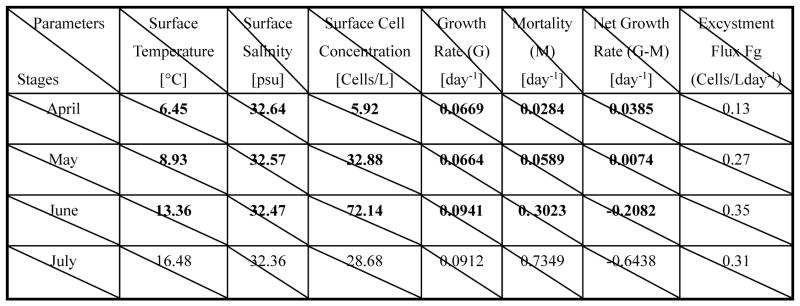
To summarize gulf-wide evolutions of GOM hydrography and A. fundyense bloom dynamics, we compute monthly mean parameters including surface temperature, surface salinity, surface cell concentration, surface cell growth rate, surface cell mortality rate, surface cell net growth rate and bottom cell germination flux for the month of April, May, June and July 2006, respectively (Table 1). Each of these values is temporally averaged over a month and also spatially averaged over the entire domain. The mean temperature increases from 6.45°C in April monotonically to 16.48°C in July. In contrast, the mean salinity slightly decreases throughout the season from 32.64 psu in April to 32.36 psu in July. The mean surface cell concentration increases from 7 cells/L in April to 72 cells/L June, representing a 10-time multiplication. It then decreases rapidly to about 29 cells/L in July. The net growth rate (growth – mortality) shows a sign changes from positive in April and May to negative in June and July, as a result that the mortality rate outpaces the growth rate in the late summer season. The cyst germination flux increases from an initial value of 0.13 cells/Lday−1 in April to its highest value (0.35 cells/L day−1) in June, it then starts decreasing in July. Along with advection and diffusion exerted by coastal circulation, both the net growth of cell and its cyst germination flux contribute to the seasonal evolution of the bloom.
Table 1.
The mean values of the physical/biological parameters for April, May, June, July 2006, respectively. The excystment flux was derived based on the cyst abundance (Fig. 2) and the germination rate, which is a function of an endogenous clock, temperature and light condition (Stock et al., 2005).
4.4. Bloom interannual variability
Given the GOM A. fundyense bloom in 2005 was considered the worst in several decades (Anderson et al., 2005; He et al., 2008), it is of interest to compare the 2006 A. fundyense bloom with the historic 2005 bloom to better understand its interannual variations.
Compared to the climatological hydrography, GOM water in 2005 was much warmer and fresher than in 2006, whereas temperature and salinity in 2006 were very similar to the climatological conditions (Figure 3). Surface wind fields in summer 2005 were dominantly downwelling favorable (He and McGillicuddy, 2008), as opposed to in 2006 when winds were more typically upwelling favorable (Figure 11). As a result, the coastal currents consisting of both density driven and wind-driven flows were much stronger in 2005, causing the bloom to spread further down the coast than in 2006.
In addition to environmental forcing conditions, there was a pronounced difference in the abundance of A. fundyense cysts in bottom sediments. Our working hypothesis is that the initial cyst abundance is the most important factor determining the intensity and extent of the western GOM A. fundyense bloom in the following summer. The 2005 hindcast presented in He et al. (2008) confirms this hypothesis, and the 2006 hindcast presented herein provides additional support. Cyst abundance in the western GOM in fall 2004 was significant higher than in other recent years (D.M. Anderson, unpublished data). The maximum cyst concentration in fall 2004 was nearly 5 times higher than that in fall 2005. Likewise, the total cyst abundance in fall 2004 was about two times higher than that in fall 2005. Furthermore, the cyst bed in fall 2004 extended much more broadly in space, covering more offshore areas in the western GOM (Figure 2). As a result, the temporal and spatial averaged cell concentration of 2006 bloom is only about 60% of that for 2005 bloom. Clearly, the interannual variations in A. fundyense bloom condition are subject to joint effects of interannual variability in initial cyst abundance and local hydrography and forcing fields.
5. Summary
In situ observations and a coupled biophysical model hindcast were used to analyze the temporal and spatial evolutions of the 2006 bloom of the toxic dinoflagellate A. fundyense. Observations indicated that 2006 was a year characterized by normal hydrographic and surface forcing conditions. The benthic cyst abundance preceding the 2006 bloom was moderate compared to other recent cyst survey data. The coupled model hindcast successfully reproduced GOM coastal circulation and the coast-scale spatial distribution of the A. fundyense bloom observed in 2006. Point-by-point model/data comparisons indicated that during the initiation and development phases of the bloom, simulated cell abundances agree with observations within ±50 cells/L at 190 out of 323 hydrographic stations.
The bloom evolution in the western GOM was carefully examined at the location of GoMOOS mooring B. Results reveal the important influence of water temperature on the growth and mortality rates. Surface wind fields play an important role in modulating water mixing and transport, thereby affecting horizontal and vertical distributions of the cell population. Dynamical factors affecting the bloom seasonal evolution were analyzed through diagnosing various terms regulating the growth and mortality rates. Specifically, the seasonal shift of the bloom from the western GOM to eastern GOM (Townsend et al. 2001; McGillicuddy et al., 2005; He et al., 2008) was shown to be largely controlled by cell mortality with a contribution from nutrient limitation. One caveat we note however is that because our simulation utilized the climatological nutrient field (Petrie et al., 1999), the contribution of nutrient abundance variability (through local river sources and upstream and deep-ocean input) is not resolved.
Collectively, our results support the conclusion made by earlier studies (e.g., Anderson et al. 2005; He et al., 2008) that benthic cyst abundance is a key factor controlling the magnitude of GOM A. fundyense bloom. Monitoring of benthic cyst distributions could therefore provides a basis for interannual predictions in overall bloom severity. Other biological factors (germination, growth, mortality) as well as hydrodynamic transport play important role in shaping the spatial and temporal structures of the bloom, as well as their intense patchiness characteristics. Deterministic predictions of those aspects will clearly require refined models, advanced observational infrastructure together with sophisticated techniques for data assimilation.
Acknowledgments
The authors thank technical and logistical support provided by K. Norton, O. Kosnyreva, V. Kosnyreva, K. Smith, J. Manning and L. Anderson. Thanks to the captain, crews and support personnel of the R/V Oceanus. S. Libby, M. Mickelson, and others associated with the Massachusetts Water Resources Authority monitoring program for Massachusetts Bay provided many valuable observations and helpful discussions. We thank Dr. B. Petrie for providing the Gulf of Maine nutrient climatology used in the simulations. Thanks also to NOAA NCEP, USGS, and GoMOOS for providing data products online. Research support was provided by GOMTOX program through NOAA Grant NA06NOS4780245. DJM and DMA were also supported by NSF grant OCE-0430724, DMS-0417769 and NIEHS grant 1P50-ES01274201 (Woods Hole Center for Oceans and Human Health). Cyst abundance data is provided through ECOHAB grant NOAA ECOHAB Grant NA04NOS4780274 to DMA. This is ECOHAB contribution number 311.
Appendix: A. fundyense model formulation and parameterizations
The biological model can be expressed as a single advection – diffusion - reaction equation (Stock et al., 2005; McGillicuddy et al., 2005; He et al., 2008):
| (1) |
Where C is the cell concentration of A. fundyense, u⃗ and wa are the fluid velocity and A. fundyense upward swimming velocity (10 mday−1 as determined from laboratory experiments; Kamykowski et al., 1992); K is the diffusivity coefficient, μ and m are the cell growth and mortality terms respectively, and Fg is the germination flux from cysts in the sediment layer to vegetative cells in the water column. The growth term μ is dependent on temperature (T), salinity (S), solar non-spectral irradiance (E) and nutrient concentration (NO3 in our model).
The temperature and salinity dependence f(T) and f(S) were based on a refined version of Stock et al., (2005) [C. Stock, Personal communication]:
The temperature dependence f(T) is expressed by:
| (2) |
The salinity dependence f(S) is expressed by:
| (3) |
Then the light limited growth term (μ(E,T,S)) and the nutrient limited growth rates μ(NO3,T,S) are defined as follows:
| (4) |
Where μmax(T,S)=μmax(Topt, Sopt) ×f(T) ×g(S). μmax(T,S) = 0.575 is the growth rate at optimal temperature and salinity. is the maintenance respiration rate, and αg =0.036denotes the growth efficiency. [NO3] is the nutrient concentration that takes effect. KN = 3.0is the half-saturation constant for the nutrient limiting growth term. E in w m−2 is net short wave radiation obtained from NCEP reanalysis (http://www.cdc.noaa.gov/). The overall growth rate is then determined according to the principle of Liebig’s Law (Liebig, 1845) of the minimum:
| (5) |
The mortality is parameterized as a function of water temperature based on the Q10 formulation (He et al., 2008),
| (6) |
where a=0.066, and Q10is 21.75. The assumption is that the predator feeding on A. fundyense cells will increase as temperature increases, so does growth rate of A. fundyense. This parameterization is proven to be more effective in capturing the late-season demise of the bloom, even though ongoing research is trying to further improve this representation. As it stands, this biological module is a simple but robust model that can simulate the initiation and development of A. fundyense in the GOM. The termination of the bloom involves more complex dynamics that need improved understanding and parameterizations, a target of ongoing research.
References
- Anderson DM. Bloom dynamics of toxic Alexandrium species in the northeastern US. Limnology and Oceanography. 1997;42:1009–1022. [Google Scholar]
- Anderson DM, Keafer BA, McGillicuddy DJ, Mickelson MJ, Keay KE, Libby PS, Manning JP, Mayo CA, Wittaker DK, Hickey JM, He R, Lynch DR, Smith KW. Initial observation of the 2005 Alexandrium fundyense bloom in he southern New England: general patterns and mechanisms. Deep Sea Research II. 2005;52:2856–2876. [Google Scholar]
- Anderson DM, Kulis DM, Keafer BA, Gribble KE, Marin R, Scholin CA. Identification and enumeration of Alexandrium spp. From the Gulf of Maine using molecular probes. Deep Sea Research II. 2005b;52(19–21):2467–2490. [Google Scholar]
- Bigelow HB. Physical Oceanography of the Gulf of Maine. Fisheries Bulletin. 1927;40:511–1027. [Google Scholar]
- Durbin EG, Durbin AG. Effects of temperature and food abundance on grazing and short-term weight change in the marine copepod Acartia hudsonica. Limnology and Oceanography. 1992;37(2):361–378. [Google Scholar]
- Flather RA. A tidal model of the northwest European continental shelf. Mem Soc Roy Sci Liege, Ser 6. 1976;10:141–164. [Google Scholar]
- Franks PJS, Anderson DM. Alongshore transport of a phytoplankton bloom in a buoyancy current: Alexandrium tamarense in the Gulf of Maine. Marine Biology. 1992;112:153–164. [Google Scholar]
- Garside C, JC, Keller MD, Sieracki ME. The formation of high nutrient low salinity water in the Gulf of Maine: a nutrient trap? Estuarine Coastal and Shelf Science. 1996;42(5):617–628. [Google Scholar]
- He R, Weisberg RH. West Florida shelf circulation and temperature budget for the 1999 spring transition. Continental Shelf Research. 2002;22:719–748. [Google Scholar]
- He R, Weisberg RH. West Florida shelf circulation and temperature budget for the 1998 fall transition. Continental Shelf Research. 2003;23:777–800. [Google Scholar]
- He R, McGillicuddy DJ, Lynch DR, Smith KW, Stock CA, Manning JP. Data assimilative hindcast of the Gulf of Maine coastal circulation. Journal of Geophysical Research. 2005;110:C10011. doi: 10.1029/2004JC002807. [DOI] [Google Scholar]
- He R, McGillicuddy DJ, Lynch DR, Smith KW, Stock CA, Manning JP. Data assimilative hindcast of the Gulf of Maine coastal circulation. Journal of Geophysical Research. 2005;110:C10011. doi: 10.1029/2004JC002807. [DOI] [Google Scholar]
- He R, McGillicuddy DJ. The historic 2005 Toxic Bloom of Alexandrium fundeyense in the west Gulf of Maine-Part 1: In Situ Observations of Coastal Hydrography and Circulation. Journal of Geophysical Research. 2008;113:C07039. doi: 10.1029/2007JC004601. [DOI] [PMC free article] [PubMed] [Google Scholar]
- He R, McGillicuddy DJ, Keafer BA, Anderson DM. Gulf of Maine Harmful Algal Bloom in summer 2005-Part 2: Coupled Bio-physical Numerical Modeling. Journal of Geophysical Research. 2008;113:C07040. doi: 10.1029/2007JC004602. [DOI] [PMC free article] [PubMed] [Google Scholar]
- He R, Chen K. Investigation of Northeastern North American coastal circulation using a regional circulation hindcast Model: Mean Circulation. submitted to Journal of Geophysical Research-oceans. [Google Scholar]
- Kamykowski D, reed RE, Kirkpatrick GJ. Comparison of the sinking velocity, swimming velocity, rotation and path characteristics among six marine dinoflagellate species. Marine Biology. 1992;113(2):319–328. [Google Scholar]
- Limeburner R, Beardsley RC. Near-surface recirculation over Georges Bank. Deep Sea Research II. 1996;43:1547–1574. [Google Scholar]
- Loder JW, Han G, Hannah CG, Greeberg DA, Smith PC. Hydrography and baroclinic circulation in the Scotian Shelf Region: Winter vs. summer. Can J Fish Aquat Sci. 1997;54(Suppl 1):40–56. doi: 10.1139/cjfas-54-S1-40. [DOI] [Google Scholar]
- Love RC, Loder TC, Keafer BA. Nutrient conditions during Alexandrium fundyense blooms in the western Gulf of Maine, U.S.A. Deep Sea Research II. 2005;52:2450–2466. [Google Scholar]
- Keafer BA, Churchill JH, McGillicuddy DJ, Anderson DM. Bloom development and transport of toxic Alexandrium fundyense population within a coastal plume in the Gulf of Maine. Deep Sea Research II. 2005;52:2674–2697. [Google Scholar]
- Liebig J. Chemistry an its applications to agriculture and physiology: On Chemical Processes in the Nutrition of Vegetables. L. Playfair; Peterson, VA: 1845. [Google Scholar]
- Lynch DR, Holboke MJ, Maimie CE. The Maine coastal current: spring climatological circulation. Continental Shelf Research. 1997;17:605–639. [Google Scholar]
- Luettich RA, Westerink JJ, Scheffner NW. ADCIRC: An advanced three-dimensional circulation model for shelves, coasts and estuaries. U.S. Army Engineer Waterways Experiment Station; 1992. [Google Scholar]
- Marchesiello P, McWilliams JC, Shchepetkin AF. Open boundary conditions for long-term integration of regional oceanic models. Ocean Modeling. 2001;3:1–20. [Google Scholar]
- Mellor LG, Yamada T. Development of a turbulence closure model for geophysical fluid problems. Reviews of Geophysics and space physics. 1982;20–4:851–875. [Google Scholar]
- McGillicuddy DJ, Anderson DM, Lynch DR, Townsend DW. Mechanisms regulating large-scale seasonal fluctuations in Alexandium fundyense populations in the Gulf of Maine: Results from a physical-biological model. Deep Sea Research II. 2005;52:2698–2714. [Google Scholar]
- Moody JA, et al. Atlas of tidal elevation and current observations on the Northeast American continental shelf and slope. US Geological Survey Bulletin. 1984;1611:122. [Google Scholar]
- Petrie B, Yeasts P, Strain P. Nitrate, Silicate and Phosphate Atlas for the Scotian Shelf and the Gulf of Maine. Canadian Technical Report of Hydrography. Ocean Sciences. 1999;203:vii–96. [Google Scholar]
- Petrie B, Yeasts P. Annual and interannual variability of nutrients and their estimated fluxed in the Scotian Shelf-Gulf of Maine region. Canadian Journal of Fisheries and Aquatic Sciences. 2000;57:2536–2546. [Google Scholar]
- Pettigrew NR, Churchill JH, Janzen CD, Mangum LJ, Signell RP, Thomas AC, Townsend DW, Wallinga JP, Xue H. The kinematic and hydrogrphic structure of the Gulf of Maine coastal current. Deep Sea Research, Part II. 2005;52:19–21. 2369–2391. [Google Scholar]
- Shcheptkin AF, McWilliams JC. a split-explicit, free-surface, topographic following-coordinate oceanic model. Ocean Modelling. 2005;9:347–404. [Google Scholar]
- Stock CA, McGillicuddy DJ, Solow AR, Anderson DA. Evaluating hypothesis for the initiation and development of Alexandrium fundyense blooms in the western Gulf of Maine using a coupled physical-biological model. Deep Sea Research II. 2005;52:2715–2744. [Google Scholar]
- Townsend DW, Pettigrew NR, Thomas AC. Offshore blooms of the red tide dinoflagellate, Alexandrium sp., in the Gulf of Maine. Continental Shelf Research. 2001;21:347–369. [Google Scholar]
- Xue H, Chai F, Pettigrew NR. a model study of the seasonal circulation in the Gulf of Maine. Journal of Physical Oceanography. 2000;30:1111–1135. [Google Scholar]


