Abstract
Purpose
The purpose of this study was to estimate human trabecular meshwork (hTM) stiffness, thought to be elevated in glaucoma, using a novel indirect approach, and to compare results with direct en face atomic force microscopy (AFM) measurements.
Methods
Postmortem human eyes were perfused to measure outflow facility and identify high- and low-flow regions (HF, LF) by tracer. Optical coherence tomography (OCT) images were obtained as Schlemm's canal luminal pressure was directly manipulated. TM stiffness was deduced by an inverse finite element modeling (FEM) approach. A series of AFM forcemaps was acquired along a line traversing the anterior angle on a radially cut flat-mount corneoscleral wedge with TM facing upward.
Results
The elastic modulus of normal hTM estimated by inverse FEM was 70 ± 20 kPa (mean ± SD), whereas glaucomatous hTM was slightly stiffer (98 ± 19 kPa). This trend was consistent with TM stiffnesses measured by AFM: normal hTM stiffness = 1.37 ± 0.56 kPa, which was lower than glaucomatous hTM stiffness (2.75 ± 1.19 kPa). None of these differences were statistically significant. TM in HF wedges was softer than that in LF wedges for both normal and glaucomatous eyes based on the inverse FEM approach but not by AFM. Outflow facility was significantly correlated with TM stiffness estimated by FEM in six human eyes (P = 0.018).
Conclusions
TM stiffness is higher, but only modestly so, in glaucomatous patients. Outflow facility in both normal and glaucomatous human eyes appears to associate with TM stiffness. This evidence motivates further studies to investigate factors underlying TM biomechanical property regulation.
Keywords: trabecular meshwork, stiffness, finite element modeling, AFM, ocular biomechanics, glaucoma
The cause of increased outflow resistance leading to ocular hypertension in glaucoma remains unknown. However, several intriguing studies suggest that human trabecular meshwork (hTM) stiffness may differ in glaucomatous versus unaffected eyes.1 These studies raise the possibility that TM stiffness might be involved in the pathogenesis of ocular hypertension in glaucoma. Last et al., in an important early study, used atomic force microscopy (AFM) in dissected TM samples from postmortem eyes to show that TM stiffness was markedly elevated in glaucomatous versus normal eyes.2 Subsequently, Camras et al. examined the tensile stiffness of dissected human TM3–5 via uniaxial testing. This study found that the glaucomatous TM was softer than normal TM, contrary to the results of the AFM testing. This discrepancy might be in part due to different testing modes used (tension versus compression). Johnson et al. (IOVS 2015;56:ARVO E-Abstract 3541) estimated hTM stiffness in vivo in normal eyes using OCT imaging and an indirect method based on changes in TM geometry. In all of the above studies, there were methodologic concerns, including dissection that may have damaged/altered the TM; different mechanical loading conditions that in some cases did not replicate the loads that occur in vivo; and/or oversimplified modeling assumptions. In view of the limitations of the above studies, it is important to explore alternate approaches for TM stiffness estimation to determine whether TM stiffness is truly altered in eyes with ocular hypertension.
Optical coherence tomography (OCT) is a cross-sectional, three-dimensional imaging technique with high spatial resolution (<20 μm).6 Recent studies have used OCT for characterization of tissue structure and movement inside the eye.7–11 Specifically, spectral domain OCT (SD-OCT) was used to image radial limbal segments in ex vivo primate eyes. A cannula was inserted into Schlemm's canal (SC) to control pressure inside SC lumen. A pressure gradient was introduced across the TM that differed from the gradient expected due to standing, sitting, supine, or prone positions. Instead, pressure gradients were typical of those encountered during body inversion (e.g., gymnastics and yoga) and the spectrum of partial inversions that occur in daily life. SD-OCT was able to capture the dynamic motion of the TM, SC, and collector channels (CCs) as SC luminal pressure was changed.
The inverse finite element method (FEM) is a computer modeling technique that has been widely used to estimate tissue biomechanical properties. The basic idea behind inverse FEM is to select input parameters for computational simulations that minimize the difference(s) between simulated and measured outcomes (e.g., tissue displacement and strain), thereby allowing indirect determination of such parameter values from experimental data.12–14
The goal of this paper was to determine human TM stiffness in normal and glaucomatous eyes using a novel approach combining OCT and the inverse FEM. We reasoned that this technique would be less disruptive to TM structure than previous approaches. Additionally, we carried out en face AFM stiffness measurements on the same hTM samples to compare with results obtained from the OCT/inverse FEM approach. Finally, stiffness data were correlated with outflow facility in some eyes.
Methods
In brief, human eyes were obtained from eye banks, and anterior segments were perfused in Portland at Oregon Health & Science University under organ culture conditions15 to measure outflow facility and identify high- and low-flow (HF, LF) regions of the TM. Anterior segment HF and LF wedges in culture medium were then sent on ice to Seattle by overnight express and received by 10 AM the next day for OCT scanning. Finally, the same wedges were sent to Atlanta where AFM measurements on the TM were carried out, and post hoc analysis of the OCT scans was undertaken.
In more detail, human eyes (five normal and three glaucomatous; age, 74 to 88 years) were obtained within 72 hours postmortem from Oregon VisionGift eye bank. All research followed the tenets of the Declaration of Helsinki. Details on the glaucoma or normal donors included medications, but not detailed ophthalmologist's records. Anterior segments were immediately dissected, gently removing the lens, iris, ciliary body, and posterior pole, while retaining the cornea, approximately 5 to 10 mm of sclera, and the TM and SC. These anterior segments were immediately placed in stationary anterior segment organ culture and maintained for approximately 5 days.15 Media and conditions were the same except a 1:1 mix of high glucose:low glucose DMEM was used. Anterior segments were then mounted on perfusion chambers and perfused at a constant pressure of 8.8 mm Hg (corresponding to approximately 15 mm Hg in vivo), with gravimetric fluid flow rates assessed using minor modifications from the original method.16 After flow rates had stabilized, we averaged the perfusion outflow facility (Cpf = flow rate in μL/min/perfusion pressure in mm Hg) over 2 to 3 days. To mark high flow areas in a manner that did not affect the AFM measurements, CellMask plasma membrane stain (ThermoFisher Scientific, Waltham, MA, USA) was perfused for 1 hour prior to termination of flow experiments. HF and LF wedges approximately 4 mm wide were cut, based on relative CellMask staining intensity, and sent to Seattle for OCT scanning. OCT scanning was performed the following day using the same formulation of culture media used at Oregon Health & Science University.
OCT
Anterior segment wedges encompassing the cornea, limbal region with TM, SC, and approximately 5 mm of sclera were mounted in a petri dish with pins, with the inner TM surface facing upward. The entire wedge was submerged in a saline bath, eliminating possible surface tension effects on the open end of SC. This uniform and stable saline bath surface also helped to eliminate surface motion artifacts when dynamic TM motion occurred (Fig. 1). A crucial factor in the protocol was a previously described7 custom-made steeply tapered and flexible insertion cannula fashioned from PE 60 tubing with an outside diameter of 1.22 mm, a taper length of 4.5 mm, and an outside diameter at the tip of 130 to 150 μm that provided a tight fit when inserted into the SC.
Figure 1.
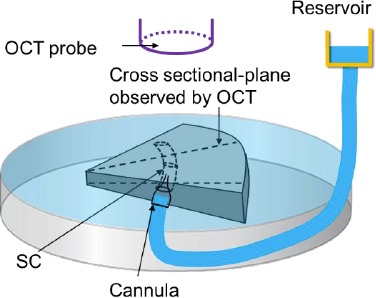
Schematic overview of experimental setup, including the SD-OCT system, a reservoir used for controlling pressure in SC, a cannula, and a Petri dish. The triangular-shaped object is a wedge of limbal tissue.
The cannula was inserted into SC with the help of a dissecting microscope and a micromanipulator while the other end remained free (open). The tip of the cannula slid into, and made a tight contact with, the canal lumen. The other end of the cannula was connected to a reservoir filled with saline, so that SC lumen pressure could be controlled by changing the height of the reservoir. To capture the dynamic movement of tissues along the SC lumen at high resolution, the SD-OCT imaging probe was adjusted to face the TM. A series of cross-sectional scans of the wedge were captured at multiple locations for different reservoir pressures (e.g., 0, 5, 10, 20, 30, and 50 mm Hg). The distance between two adjacent scans was about 10 μm. The central wavelength of the SD-OCT system was 1310 nm, and the spatial resolution in each scan was 5 and 5.75 μm in the axial and lateral dimensions, respectively. The imaging was performed through air without the OCT probe touching on the sample. The system was capable of an imaging speed of 92 kHz (i.e., 92,000 A-scans/s). At this speed, a system sensitivity (or dynamic range) of 105 dB was measured when the light power on the sample was 5 mW. Thus, for each location along TM/SC (typically one to three random locations were scanned for each wedge), a set of images were obtained for assessment of tissue configuration at several pressure levels (Fig. 1).
Inverse FEM
For two to three wedges per eye and one to three cross-sectional locations per wedge, we created a pseudo–two-dimensional (2D) FEM geometry in Abaqus (version 6.16; Simulia Corp., Providence, RI, USA). This pseudo-2D model was formed by “extruding” the 2D cross section for a distance of 10 μm from a single OCT scan at a low SC pressure (Fig. 2). OCT scans were used only if a clear, open SC lumen could be identified.
Figure 2.
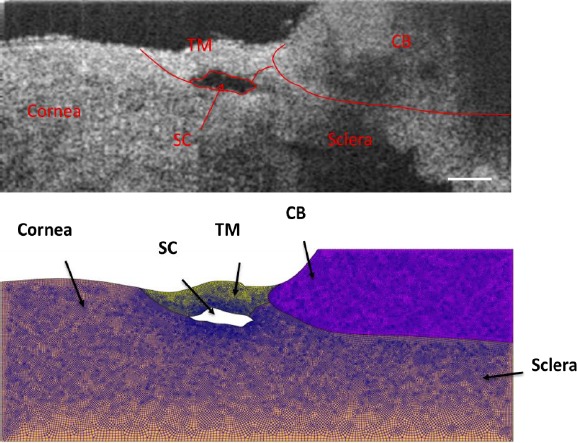
(Upper) Representative OCT image at a low SC luminal pressure (here, 0 mm Hg) with delineated tissue structures superimposed. (Bottom) Geometry created in Abaqus with mesh superimposed. The total number of hexahedral elements for this mesh was 55,358, with typical edge lengths from 5 to 10 μm. Scale bar: 250 μm. Sample: inferior temporal quadrant of eye 77R.
In more detail, tissue components including TM, SC, sclera/cornea, and ciliary body (CB) were first delineated from the OCT scan and verified by one coauthor (MAJ) by carefully looking at the relative deformation of outflow tissues from the 3D OCT videos of SC lumen during the pressurization interval. The model was then meshed with eight-node hexahedral elements (edge lengths from 5 to 15 μm, as justified in the Supplementary Materials). The meshed model was then imported from Abaqus into PreView (FEBio package).17 Tissues were treated as incompressible, isotropic, and nonlinearly hyperelastic (neo-Hookean material model).18 The strain energy density function for such a material is as follows:
 |
where  is a stiffness parameter (with
  representing Young's modulus and
  representing Poisson's ratio) and
  is the first invariant of the deviatoric component of the right Cauchy-Green deformation tensor.
A tissue-specific fixed value for the parameter  was assigned to each tissue component (except TM) according to either literature reports, or, for tissues lacking literature reports of their stiffness, our best estimates. Specifically, sclera/cornea stiffness (
 ) was taken as 2700 kPa,19 whereas CB stiffness was estimated as 100 kPa, close to the stiffness of vessels,19 because CB contains the ciliary muscle, vessels, and fibrous connective tissue. Poisson's ratio was assumed to be 0.5. Fortunately, a sensitivity analysis (see Supplementary Materials) demonstrated that the assumed CB stiffness value had a limited impact on the resulting estimated TM stiffness. Unlike the rest of the tissue components, the stiffness of the TM (
 ) was allowed to vary over a range of values, typically from 18 to 300 kPa.
Loading conditions were specified based on those that were imposed experimentally. The plane strain assumption was made when imposing boundary conditions, suitable for the case in which SC cross-sectional shape changed slowly over axial distances comparable to the characteristic dimensions of the SC cross section. The bottom surface of sclera was fixed in all three directions, and one of the two side faces containing TM and SC was fixed in its normal direction. A pressure load was applied to the walls of SC lumen, carefully corrected for losses in the delivery tubing, the cannula, and the distance from the tip of cannula to the OCT scan location (see Supplementary Materials). Due to the small cross-sectional area of the SC lumen, most of the computed pressure drop typically occurred within SC. Young's modulus for TM was allowed to vary over a certain range in steps of 6 kPa, and tissue deformations were computed for each TM stiffness using the open source FEBio package (version 2.2.2; Musculoskeletal Research Lab at the University of Utah, Salt Lake City, UT, USA).17 Differences in SC lumen size (area) between simulations and experiments were then calculated as
 |
where subscripts “OCT” and “FEM” refer to experimentally measured and numerically simulated cross-sectional areas, respectively. The TM stiffness value that gave the minimum difference in SC cross-sectional area was then taken as the estimated local TM stiffness for that model/cross section (Fig. 3).
Figure 3.
Comparison between SC contours as measured by OCT and as computed for a range of TM stiffnesses. (Left) SC contours at reservoir pressures of 0 mm Hg and 20 mm Hg are shown in red and black, respectively. The trabecular meshwork lies above SC lumen, with sclera immediately below. The blue dots represent a set of computed SC contours from simulations at 20 mm Hg over a range of TM stiffnesses. Blue dots are not visible along the lower portion of the figure because there was essentially no computed deformation of the SC outer wall (i.e., blue dots are overlain by the red dots in this region). (Right) Quantification of SC lumen area difference, as computed from equation 2, at a reservoir pressure of 20 mm Hg for different numerically specified Young's moduli for the TM (x-axis). A minimum difference was observed at 48 kPa, which was therefore taken as the best estimate of Young's modulus for the TM at this location. Scale bar: 50 μm. Sample: inferior temporal quadrant of eye 77R.
As a quality control step, SC lumen contours were compared between OCT images and simulations at the corresponding elevated pressure (Fig. 3, left). We excluded a total of two quadrants when the match in contour shape was poor even if the SC cross-sectional area agreed well between the numerical simulation and the experimental data (Fig. 4).
Figure 4.

A representative poor match of SC contours. Red and black dots are SC contours at reservoir pressures of 0 mm Hg and 10 mm Hg, respectively. Tissue orientation and symbols are the same as those in Figure 3. Scale bar: 50 μm. Sample: high-flow quadrant of eye 111.
Finally, the average value of estimated TM stiffness over all modeled quadrants in one eye was taken as the TM stiffness of that eye.
AFM
The wedges, immersed into centrifuge tubes containing organ culture media, were then shipped overnight from Seattle to Atlanta on wet ice (typical postmortem time on receipt: 15 days). Upon receipt, each wedge was glued (Super glue; Loctite, Düsseldorf, Germany) onto a Petri dish with the same orientation as in the OCT experiment (glue was applied at the three corners of the wedge which were far from the limbal region). Samples were transferred to an MFD-3D AFM (Asylum Research, Santa Barbara, CA, USA) and immersed into the same organ culture media. Silicon nitride cantilevers with an attached borosilicate sphere (radius, 5 μm; nominal spring constant, 0.1 N/m; Novascan Technologies, Inc., Ames, IA, USA) were used. Cantilevers were calibrated by measuring the thermally induced motion of the unloaded cantilever before measurements. A series of forcemaps were obtained in regions located along a line starting on the cornea and ending on the sclera. The starting location for this line was determined visually with the aid of markers on the Petri dish. Specifically, the markers were several grids which were drawn on the bottom of the Petri dishes using a permanent marker that could be seen through the transparent cornea. Even with marker's help, there was still some uncertainty in measurement location due to the thickness of the samples. When observed from the bottom camera, the cantilever tip and tissue were usually not focused on the same plane. Thus, the desired measurement location and the cantilever tip may not have been in the same spot. To estimate the uncertainty in measurement location, the cantilever tip was first moved to barely touch the surface of a glass slide and the bottom camera was focused on that surface. Then the cantilever tip was raised by 0.8 mm (typical wedge thickness at the limbus) and the camera was refocused on the cantilever tip. The distance between cantilever tip before and after the refocusing was used to estimate the uncertainty of the measurement location.
Each forcemap region consisted of 16 force curves in a 4 × 4 grid covering a scan region of 20 × 20 μm. The center-to-center distance between adjacent forcemap regions was 20 to 80 μm. Each force curve was taken at a rate of 8 μm/s, and a typical indentation depth was 0.5 to 1 μm. For the 16 force curves in each forcemap region, those lacking either linear behavior or a clear cantilever contact point were discarded from the analysis. The remaining force curves were fit to a Hertz model (Equation 3) for a sphere in contact with a flat surface to determine the local compressive modulus (version 6.34A; Igor Pro software, Portland, OR, USA) (Fig. 5).
 |
Figure 5.
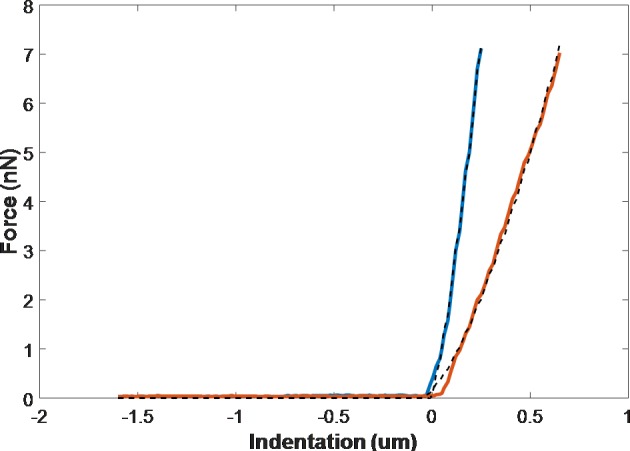
Typical force-indentation curve and fitting to raw data. Red and blue are advancing curves for soft and stiff locations, respectively. Dashed lines are curve fit.
In Equation 3,  is Young's modulus,
  is the force applied by cantilever bending,
  is the radius of the sphere on the cantilever tip,
  is the actual sample indentation, and
  is the sample's Poisson's ratio, taken as 0.5. In Figure 5,1 the force experienced by the cantilever tip is zero when the cantilever is far from the sample surface. The force increases as the cantilever tip touches and indents the sample surface. The cantilever starts to retract once it reaches a maximum force, leading to a decreasing force.
The average modulus from the valid measurement points within a forcemap region was taken as the compressive modulus of that region. These moduli from all forcemap regions in one sample were then plotted as a function of region location along the measurement line (cornea to sclera). The TM region was putatively defined as the anterior-most pigmented area that was adjacent to the cornea plus the narrow white band, representing the scleral spur (shown as the region between the two dashed lines in Fig. 6). The mean of the modulus values along the measurement line traversing the TM region was taken as the TM stiffness of that location. Typically, two to three such locations were measured for each wedge, and the average was taken as the TM stiffness for that wedge (quadrant), as shown in Table 1. Usually, tissue was stiffest in the cornea and softened gradually as the measurement location moved posteriorly. Surprisingly, in most cases, the sclera had a lower modulus than the cornea. However, it is very likely that there was some residual iris root, ciliary body, retinal pigment epithelium, or choroid left near the limbal region because we did not aggressively clean or scrape the sclera during dissection. These tissues are expected to be soft and could explain the low scleral modulus.
Figure 6.
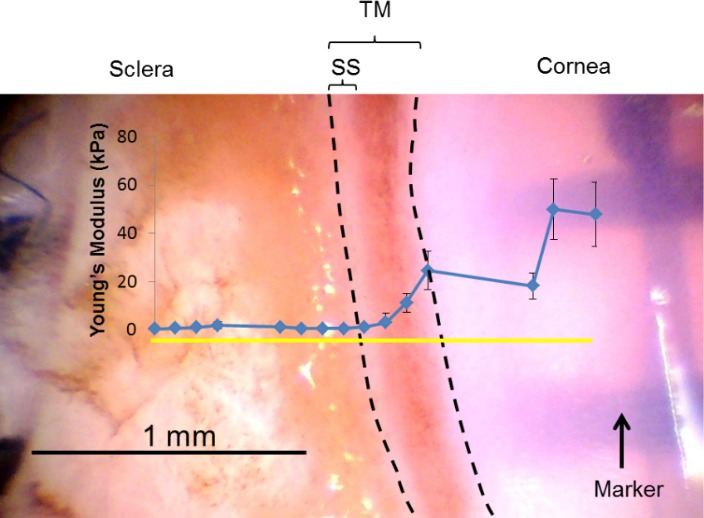
A representative top view of a wedge (glaucomatous eye 122) from the dissection microscope with TM facing upward. AFM measurements started in the cornea on the right side, along the measurement line (yellow solid line) and toward the sclera. The measured compressive modulus of each location along the measurement line is indicated in blue dots. The area between the two dashed lines is taken as the TM region. Error bar denotes SD. Tissue was stiff in the cornea and decreased gradually as the measurement location moved posteriorly. Relatively low modulus was obtained in sclera region probably due to measurements on residual iris root or ciliary body. Sclera, cornea, TM, and sclera spur (SS) are labeled.
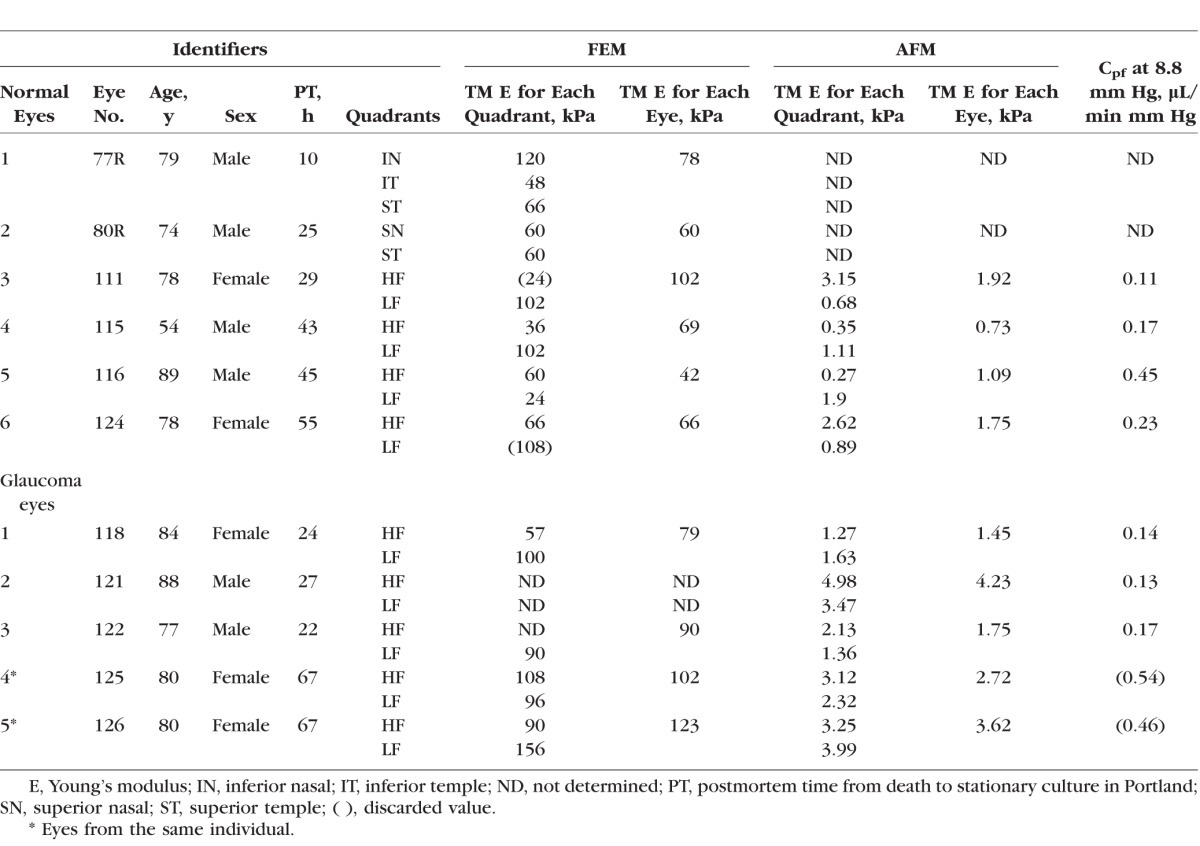
Table 1.
TM Stiffness in Normal and Glaucomatous Human Eyes Obtained by Inverse FEM and AFM
Results
TM stiffnesses for six normal and four glaucomatous human eyes were successfully estimated using the inverse FEM method (Table 1). We were unable to use this approach for one (eye 121) of the five glaucomatous eyes due to the lack of a clear and open SC lumen at the OCT scan locations. The elastic modulus determined in this way in normal hTM ranged from 42 to 102 kPa (mean, 70 ± 20 kPa; Table 1), whereas glaucomatous hTM samples had slightly larger elastic moduli, ranging from 79 to 123 kPa (mean, 98 ± 19 kPa; Table 1).
This trend of a slightly stiffer glaucomatous TM was consistent with TM stiffness measured by AFM, where hTM stiffness in normal eyes (mean, 1.37 ± 0.56 kPa) was lower than that in glaucomatous eyes (mean, 2.75 ± 1.19 kPa). AFM measurements were performed on a total of four normal and five glaucomatous human eyes. We were unable to make stiffness measurements on two of the six normal eyes due to logistical issues. None of the above differences between normal and glaucomatous TM stiffness reached statistical significance (Mann-Whitney U test: FEM, P = 0.051; AFM, P = 0.127); however, we suggest it is reasonable to call the P value of 0.051 associated with the difference in TM stiffness estimated by inverse FEM a “borderline significant” result.
TM stiffness measured by AFM was approximately 1/40 of that estimated by inverse FEM. This difference is almost certainly due, at least in part, to different modes of testing (compressive in AFM versus primarily tensile by SC luminal pressurization), because it is known that the type of mechanical load applied to a tissue can result in very different mechanical behavior.20 Specifically, soft tissues are usually much stiffer in tension, consistent with our results. Further, the length scales of the two measurement techniques were quite different, which could contribute to the discrepancy. The FEM involved deformation of the entire TM, whereas AFM measurements were very local. It has been reported that elastic properties of soft tissues can strongly depend on the length scale of the measurement technique, because different tissue structural components can be involved at different length scales.21 We examined the correlation between TM stiffnesses determined by inverse FEM and that determined by AFM (Fig. 7). Interestingly, there was a strong positive correlation (P = 0.009) between TM stiffness measured by AFM and that estimated by inverse FEM (n = 8: 4 normal and 4 glaucomatous eyes were both measured by FEM and AFM). From the above evidence, it appears that combining numerical modeling and OCT has the potential to provide an alternative indirect approach to assess hTM stiffness, which does not require excision of the TM.
Figure 7.
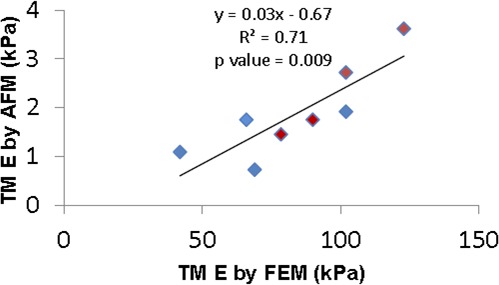
Cross-plot between TM stiffness measured by two approaches for four normal (blue symbols) and four glaucomatous (red symbols) eyes. Only eyes where TM stiffness was measured by both AFM and inverse FEM were included. The solid line and equation represent the linear regression of the pooled data.
Outflow facility (Cpf) was measured for four normal and five glaucomatous eyes (Table 1). We excluded Cpf values for two eyes (eyes 125 an d 126) from further analysis because, although they were documented as glaucomatous eyes, they had abnormally high facilities (0.54 and 0.46 μL/min mm Hg, respectively).3,22,23 After excluding these eyes, Cpf of normal eyes was higher (0.24 ± 0.15 μL/min mm Hg) compared with that in glaucomatous eyes (0.15 ± 0.02 μL/min mm Hg), but this difference did not reach statistical significance. We then plotted Cpf versus TM stiffness as estimated by inverse FEM (Fig. 8). Despite the limited number of eyes (n = 6), the Cpf and TM stiffness were significantly correlated (P = 0.018;  = 0.79), suggesting that nearly 80% of the variation in Cpf was associated with variation in TM stiffness. None of the two eyes were from the same individual, so that the statistical confounding effect of nonindependence of paired eyes was avoided.
Figure 8.
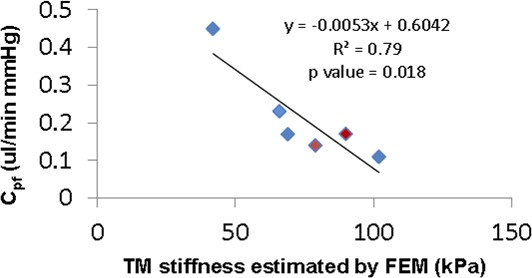
Cross-plot between TM stiffness (estimated by inverse FEM) and Cpf from normal (n = 4, blue symbols) and glaucomatous (n = 2, red symbols) human eyes. Only eyes where both Cpf and TM stiffness were measured were included. The solid line and equation represent the linear regression of the pooled data.
TM stiffness in HF and LF regions was also compared for both normal and glaucomatous eyes (Fig. 9). TM stiffness determined by inverse FEM was higher in LF wedges than that in HF wedges, both in normal and glaucomatous eyes. However, AFM measurements did not show the same trend. In fact, on average, AFM measurements of TM stiffness in HF wedges were close or even higher than those in LF wedges.
Discussion
This study estimated the stiffness of hTM in normal and glaucomatous eyes using an inverse FEM approach while also performing AFM on the same tissues. Our results indicated that TM stiffness is slightly greater in glaucomatous eyes compared with that in normal eyes, which is qualitatively consistent with the previous study of Last et al.2 However, it is extremely important to note that stiffness differences that we observed did not reach statistical significance, and the TM stiffnesses of glaucomatous eyes measured by AFM were of much smaller magnitude than those observed by Last et al.2 Thus, our results were not quantitatively consistent with those of Last et al.2 This is most likely due to methodological differences: Last et al.2 dissected the TM and measured the stiffness of the outermost part of the tissue, whereas we used intact wedges and measured the stiffness of the innermost aspects of the tissue.
It is also important to point out that differences in Cpf between the normal and glaucomatous eyes did not reach statistical significance. In fact, some of the “glaucomatous” eyes had facilities that were much higher than that in “normal” eyes. This may indicate an inaccurate classification of the donated eyes; all patients that the eye bank reported as having glaucoma were included in our study as glaucomatous eyes. Some “glaucoma” eyes may have been from patients with normal tension glaucoma without an outflow system abnormality, and/or the facility may have been affected by long-term use of antiglaucoma medication (e.g., prostaglandin analogs).24–28 However, it is of interest that we did observe a statistically significant correlation between Cpf and hTM stiffness when the data were pooled from all eyes. This suggests that these factors are highly associated in both normal and glaucomatous eyes, although perhaps to a lesser extent than originally suggested by the study of Last et al.2
We also point out that the hTM stiffness determined by the inverse FEM method cannot be directly quantitatively compared with that measured by AFM, even though the two were correlated. This is because several factors differ between the two methods, including how the load is applied to the tissue. In the OCT experiments the TM was primarily in tension, whereas in the AFM studies, the TM was primarily in compression. Soft tissues, such as the TM, can be orders of magnitude softer when loaded in compression versus when they are loaded in tension. Thus, in our study, the Young's modulus deduced by inverse FEM can be interpreted as a general indication of the TM tensile stiffness, whereas the modulus obtained by AFM tends to reveal the local compressive stiffness of the inner uveal meshwork. However, comparison of differences between normal and glaucoma hTM stiffness within a measurement method should remain valid.
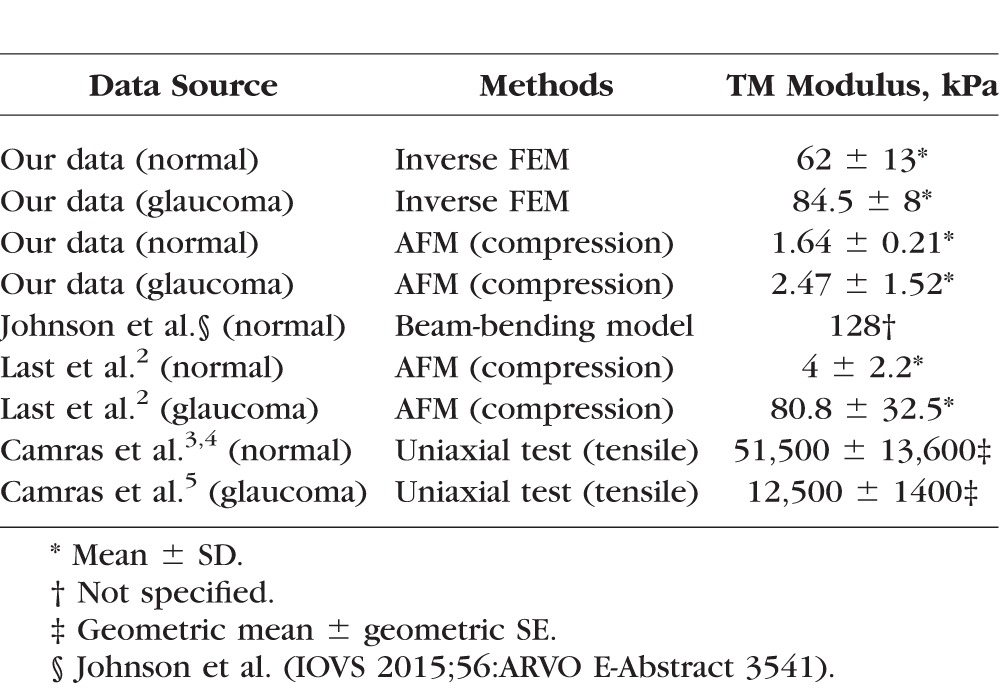
Compared with other data in the literature for hTM (Table 2), our estimated FEM mean hTM stiffness value is close to that measured by Johnson et al. (IOVS 2015;56:ARVO E-Abstract 3541) Instead of direct measurement on TM, Johnson et al. used a beam-bending model to predict TM stiffness based on in vivo changes in TM and SC thickness which were visualized by OCT as intraocular pressure (IOP) was elevated. In that study, the pressure load was applied from the anterior chamber side, not the SC side in our FEM approach. However, in both studies, the TM was in tension along a direction which is perpendicular to SC lumen. For AFM results, our measured hTM stiffness of normal eyes was on the same scale but slightly lower than that measured by Last et al.,2 and much less than that measured by Camras et al.3,4 In Camras' study, the whole dissected TM were stretched in a direction parallel to SC with elastic connections disrupted, whereas in our studies and those of Last et al.,2 the TM was compressed locally from different side of TM. However, our measurements were done on an intact wedge where elastic connections to scleral spur should be well preserved, as well as any interactions with cornea and to the outer all of SC.
Table 2.
Comparison of TM Stiffness With Other Studies in Human Eyes
There are several limitations of our study. First, steady-state IOP is usually greater than steady-state SC luminal pressure (i.e., IOP normally ranges from 10 to 20 mm Hg29 and episcleral venous pressure [EVP] is 7.6 to 11.4 mm Hg). The experimental pressurization of SC lumen created a pressure gradient in the opposite direction. However, it must be recalled that EVP and SC pressure are both highly dynamic. For example, activities such as gymnastics and yoga frequently involve body inversion, and a spectrum of partial inversions is present in many activities. With full inversion, EVP rises with a resultant increase in SC pressure30,31 and entry of blood into SC.32 An IOP increase occurs within seconds with IOP increasing to as much as 43 mm Hg.31 Syndromes that cause persistent EVP and SC pressure increases are associated with IOP elevation that can result in an intractable glaucoma.33,34 Our SC inflation test is therefore not inconsistent with physiologic situations. To be conservative, we only analyzed OCT scans with reservoir pressures limited to 30 mm Hg, assuring luminal pressures well below the 43 mm Hg documented in clinical studies.
Second, a potential confounding factor arises in the OCT experiment because the pressure at the OCT scan location was not precisely known. We attempted to account for this (see Methods) and used our best estimate of the local pressure for FEM simulations. Interestingly, in a few specimens we observed SC collapse at the free (noncannulated) end of SC (Supplementary Fig. S5). This could be due to anatomic factors or curvature of SC out of the imaging plane. Another interpretation is that SC was acting like a Starling resistor, a well-known phenomenon in which the exit pressure in a collapsible tube adjusts itself to match the surrounding bath pressure while luminal pressure is relatively spatially uniform, with a steep pressure gradient in the immediate vicinity of the outlet. If this were to occur, it would make the calculation of the pressure at the scan location very difficult, and our estimated pressure at the scan location, as described above, would be incorrect. Because we did not consistently see collapse at the distal end of SC, we reasoned that in most, perhaps all, cases, it was not appropriate to treat SC as a Starling resistor. Ideally, future studies would have a better way of determining SC luminal pressure at the scan location, although this would be very technically challenging.
Third, although the neo-Hookean material model that we used is not ideal at large strains,35 it is possible to use it for hyperelastic materials in the initial linear range, where strains are less than 20%. In our simulations, the maximum first principal strain in the deformed configuration was usually less than 20%, justifying the use of the neo-Hookean model.
Fourth, in most OCT images, transluminal structures (TLSs) can be observed spanning SC.36 TLSs include endothelial lining (ET) and septa. It has been suggested that these structures attach to the TM and corneoscleral wall and undergo motion.7,37–43 To better address the above issue, a 3D model containing TLS was built to investigate the effect of TLS on estimated TM stiffness (see Supplementary Materials for more details). When comparing TM stiffness between the 2D and 3D model, there was not a major difference. Thus, we decided not to pursue the 3D model because it was very time-consuming to construct such models.
Fifth, we found large disagreements between simulated and experimental SC contours for some of the samples. One possible reason for such deviations might be tissue movement induced by factors other than the applied luminal SC pressure. Factors like loose attachment to the Petri dish, cannula movement, and/or changes of tissue curvature resulting from segment straightening in response to SC pressure changes might have induced a small amount of tissue translation or rotation, leading to errors in the OCT images. Further investigation of such types of displacement errors is warranted.
Finally, as mentioned above, there was uncertainty in AFM measurement locations due to different focus planes of the cantilever and tissue when the sample was observed from the bottom. We estimated that the distance between cantilever tip before and after the refocusing was about 20 μm. Although the deviation between the desired and actual measurement locations is much less than width of defined the TM band, it may still cause small variations in the resultant TM stiffness. These deviations suggest the method of defining the start location of the AFM measurements may need to be improved.
There are two potential issues with the use of postmortem human eyes. The first is the freshness of the eye. In our study, the time lag from donation to OCT and AFM measurements could be as long as 15 days, although for much of this time the eyes were being perfused in anterior segment organ culture. The relation between freshness of outflow tissue and its mechanical properties has not been fully characterized, although outflow tissues are well preserved for several weeks in organ culture as assessed by TM ultrastructure and glycosaminoglycan profiles.15 The second issue is specific to eyes with a reported history of glaucoma. We could not obtain full medical histories for such eyes. It has been reported that there is a clear need to improve access to well-documented human eye tissue.44 For example, there may be eyes with normal-tension glaucoma that simply appear with the diagnosis of glaucoma on medical records. Such patients have normal IOPs and thus ostensibly normal TM function, and thus should not be included in the glaucoma group in our study.
In conclusion, our data suggest that differences in perfusion outflow facility in both normal and glaucomatous human eyes are correlated with differences in TM stiffness. These data provide a motivation for initiating further studies to identify mechanisms responsible for varying TM stiffness, particularly the altered stiffness in glaucomatous eyes.
Figure 9.
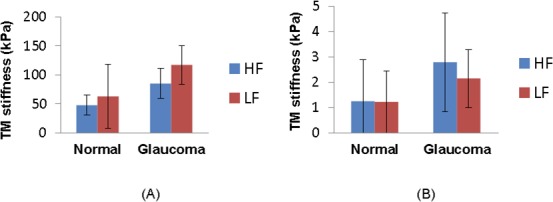
Regional heterogeneity in normal and glaucomatous eyes. The TM stiffness in HF (blue bar) and LF (red bar) wedges obtained by inverse FEM (A) or AFM (B) are shown. Error bar denotes SD.
Supplementary Material
Acknowledgments
Supported by the Georgia Research Alliance and National Institutes of Health Grants EY008247, EY010572, and EY025721 (TSA).
Disclosure: K. Wang, None; M.A. Johnstone, None; C. Xin, None; S. Song, None; S. Padilla, None; J.A. Vranka, None; T.S. Acott, None; K. Zhou, None; S.A. Schwaner, None; R.K. Wang, None; T. Sulchek, None; C.R. Ethier, None
References
- 1. Wang K,, Read AT,, Sulchek T,, Ethier CR. Trabecular meshwork stiffness in glaucoma. Exp Eye Res. 2016; 158: 3–12. [DOI] [PMC free article] [PubMed] [Google Scholar]
- 2. Last JA, Pan T, Ding Y, et al. . Elastic modulus determination of normal and glaucomatous human trabecular meshwork. Invest Ophthalmol Vis Sci. 2011; 52: 2147–2152. [DOI] [PMC free article] [PubMed] [Google Scholar]
- 3. Camras LJ,, Stamer WD,, Epstein D,, Gonzalez P,, Yuan F. Differential effects of trabecular meshwork stiffness on outflow facility in normal human and porcine eyes. Invest Ophthalmol Vis Sci. 2012; 53: 5242–5250. [DOI] [PubMed] [Google Scholar]
- 4. Camras LJ,, Stamer WD,, Epstein D,, Gonzalez P,, Yuan F. Erratum in: Differential effects of trabecular meshwork stiffness on outflow facility in normal human and porcine eyes. Invest Ophthalmol Vis Sci. 2014; 55: 2316. [DOI] [PubMed] [Google Scholar]
- 5. Camras LJ,, Stamer WD,, Epstein D,, Gonzalez P,, Yuan F. Circumferential tensile stiffness of glaucomatous trabecular meshwork. Invest Ophthalmol Vis Sci. 2014; 55: 814–823. [DOI] [PubMed] [Google Scholar]
- 6. Tomlins PH,, Wang RK. Theory, developments and applications of optical coherence tomography. J Phys D Appl Phys. 2005; 38: 2519–2535. [Google Scholar]
- 7. Hariri S, Johnstone M, Jiang Y, et al. . Platform to investigate aqueous outflow system structure and pressure-dependent motion using high-resolution spectral domain optical coherence tomography. J Biomed Optics. 2014; 19: 106013. [DOI] [PMC free article] [PubMed] [Google Scholar]
- 8. Li P, Reif R, Zhi Z, et al. . Phase-sensitive optical coherence tomography characterization of pulse-induced trabecular meshwork displacement in ex vivo nonhuman primate eyes. J Biomed Optics. 2012; 17: 076026. [DOI] [PubMed] [Google Scholar]
- 9. Strouthidis NG,, Fortune B,, Yang H,, Sigal IA,, Burgoyne CF. Effect of acute intraocular pressure elevation on the monkey optic nerve head as detected by spectral domain optical coherence tomography. Invest Ophthalmol Vis Sci. 2011; 52: 9431–9437. [DOI] [PMC free article] [PubMed] [Google Scholar]
- 10. Kagemann L, Wang B, Wollstein G, et al. . IOP elevation reduces Schlemm's canal cross-sectional area. Invest Ophthalmol Vis Sci. 2014; 55: 1805–1809. [DOI] [PMC free article] [PubMed] [Google Scholar]
- 11. Sigal IA,, Wang B,, Strouthidis NG,, Akagi T,, Girard MJ. Recent advances in OCT imaging of the lamina cribrosa. Br J Ophthalmol. 2014; 98: 34–39. [DOI] [PMC free article] [PubMed] [Google Scholar]
- 12. Nguyen TD,, Boyce BL. An inverse finite element method for determining the anisotropic properties of the cornea. Biomechanics Model Mechanobiol. 2011; 10: 323–337. [DOI] [PubMed] [Google Scholar]
- 13. Husain A,, Sehgal DK,, Pandey RK. An inverse finite element procedure for the determination of constitutive tensile behavior of materials using miniature specimen. Computat Mater Sci. 2004; 31: 84–92. [Google Scholar]
- 14. Zhang KY,, Qian X,, Mei X,, Liu Z. An inverse method to determine the mechanical properties of the iris in vivo. Biomed Eng Online. 2014; 13: 66. [DOI] [PMC free article] [PubMed] [Google Scholar]
- 15. Acott TS,, Kingsley PD,, Samples JR,, Van Buskirk EM. Human trabecular meshwork organ-culture: morphology and glycosaminoglycan synthesis. Invest Ophthalmol Vis Sci. 1988; 29: 90–100. [PubMed] [Google Scholar]
- 16. Johnson DH,, Tschumper RC. Human trabecular meshwork organ culture. A new method. Invest Ophthalmol Vis Sci. 1987; 28: 945–953. [PubMed] [Google Scholar]
- 17. Maas SA,, Ellis BJ,, Ateshian GA,, Weiss JA. FEBio: finite elements for biomechanics. J Biomechanical Eng. 2012; 134: 011005. [DOI] [PMC free article] [PubMed] [Google Scholar]
- 18. Holzapfel GA. Biomechanics of soft tissue. In: Biomech Preprint Series: Paper No. 7. Graz, Austria: Graz University of Technology; 2000. Available at: https://biomechanics.stanford.edu/me338/me338_project02.pdf. [Google Scholar]
- 19. McKee CT,, Last JA,, Russell P,, Murphy CJ. Indentation versus tensile measurements of Young's modulus for soft biological tissues. Tissue Eng Part B Rev. 2011; 17: 155–164. [DOI] [PMC free article] [PubMed] [Google Scholar]
- 20. Ethier CR,, Simmons CA. Introductory Biomechanics: From Cells to Organisms. Cambridge, UK: Cambridge University Press; 2013. [Google Scholar]
- 21. Akhtar R,, Sherratt MJ,, Cruickshank JK,, Derby B. Characterizing the elastic properties of tissues. Mater Today (Kidlington). 2011; 14: 96–105. [DOI] [PMC free article] [PubMed] [Google Scholar]
- 22. Allingham RR,, deKater AW,, Ethier CR. Schlemm's canal and primary open angle glaucoma: correlation between Schlemm's canal dimensions and outflow facility. Exp Eye Res. 1996; 62: 101–109. [DOI] [PubMed] [Google Scholar]
- 23. Kupfer C,, Ross K. The development of outflow facility in human eyes. Invest Ophthalmol Vis Sci. 1971; 10: 513–517. [PubMed] [Google Scholar]
- 24. Linden C,, Alm A. Prostaglandin analogues in the treatment of glaucoma. Drugs Aging. 1999; 14: 387–398. [DOI] [PubMed] [Google Scholar]
- 25. Daneshvar R,, Amini N. Rho-associated kinase inhibitors: potential future treatments for glaucoma. J Ophthalmic Vis Res. 2014; 9: 395–398. [DOI] [PMC free article] [PubMed] [Google Scholar]
- 26. Honjo M, Inatani M, Kido N, et al. . A myosin light chain kinase inhibitor, ML-9, lowers the intraocular pressure in rabbit eyes. Exp Eye Res. 2002; 75: 135–142. [DOI] [PubMed] [Google Scholar]
- 27. Tamura M, Nakao H, Yoshizaki H, et al. . Development of specific Rho-kinase inhibitors and their clinical application. Biochim Biophys Acta. 2005; 1754: 245–252. [DOI] [PubMed] [Google Scholar]
- 28. Williams RD, Novack GD, van Haarlem T, Kopczynski C; for the AR-12286 Phase 2A Study Group. . Ocular hypotensive effect of the rho kinase inhibitor ar-12286 in patients with glaucoma and ocular hypertension. Am J Ophthalmol. 2011; 152: 834–841. [DOI] [PubMed] [Google Scholar]
- 29. Murgatroyd H,, Bembridge J. Intraocular pressure. CEACCP. 2008; 8: 100–103. [Google Scholar]
- 30. Weinreb RN,, Cook J,, Friberg TR. Effect of inverted body position on intraocular-pressure. Am J Ophthalmol. 1984; 98: 784–787. [DOI] [PubMed] [Google Scholar]
- 31. Friberg TR,, Weinreb RN. Ocular manifestations of gravity inversion. JAMA. 1985; 253: 1755–1757. [PubMed] [Google Scholar]
- 32. Friberg TR,, Sanborn G,, Weinreb RN. Intraocular and episcleral venous-pressure increase during inverted posture. Am J Ophthalmol. 1987; 103: 523–526. [DOI] [PubMed] [Google Scholar]
- 33. Phelps CD. The pathogenesis of glaucoma in Sturge-Weber syndrome. Ophthalmology. 1978; 85: 276–286. [DOI] [PubMed] [Google Scholar]
- 34. Phelps CD,, Thompson HS,, Ossoinig KC. The diagnosis and prognosis of atypical carotid-cavernous fistula (red-eyed shunt syndrome). Am J Ophthalmol. 1982; 93: 423–436. [DOI] [PubMed] [Google Scholar]
- 35. Kim B, Lee SB, Lee J, et al. . A comparison among neo-hookean model, mooney-rivlin model, and ogden model for chloroprene rubber. Int J Precision Eng Manufacturing. 2012; 13: 759–764. [Google Scholar]
- 36. Johnstone MA. The aqueous outflow system as a mechanical pump: evidence from examination of tissue and aqueous movement in human and non-human primates. J Glaucoma. 2004; 13: 421–438. [DOI] [PubMed] [Google Scholar]
- 37. Xin C,, Johnstone M,, Wang N,, Wang RK. OCT study of mechanical properties associated with trabecular meshwork and collector channel motion in human eyes. PLoS One. 2016; 11: e0162048. [DOI] [PMC free article] [PubMed] [Google Scholar]
- 38. Xin C, Wang RK, Song S, et al. . Aqueous outflow regulation: optical coherence tomography implicates pressure-dependent tissue motion. Exp Eye Res. 2016; 158: 171–186. [DOI] [PMC free article] [PubMed] [Google Scholar]
- 39. Johnstone MA. Pressure-dependent changes in configuration of the endothelial tubules of Schlemm's canal. Am J Ophthalmol. 1974; 78: 630–638. [DOI] [PubMed] [Google Scholar]
- 40. Johnstone MA,, Grant WM. Microsurgery of Schlemm's canal and the human aqueous outflow system. Am J Ophthalmol. 1973; 76: 906–917. [DOI] [PubMed] [Google Scholar]
- 41. Van Buskirk EM. Anatomic correlates of changing aqueous outflow facility in excised human eyes. Invest Ophthalmol Vis Sci. 1982; 22: 625–632. [PubMed] [Google Scholar]
- 42. Rohen JW,, Rentsch FJ. Morphology of Schlemm's canal and related vessels in the human eye [in German]. Albrecht Von Graefes Arch Klin Exp Ophthalmol. 1968; 176: 309–329. [DOI] [PubMed] [Google Scholar]
- 43. Smit BA,, Johnstone MA. Effects of viscoelastic injection into Schlemm's canal in primate and human eyes: potential relevance to viscocanalostomy. Ophthalmology. 2002; 109: 786–792. [DOI] [PubMed] [Google Scholar]
- 44. Williams AM,, Stamer WD,, Allingham RR. Increasing the availability and quality of donor eyes for research. JAMA Ophthalmol. 2016; 134: 351–352. [DOI] [PMC free article] [PubMed] [Google Scholar]
Associated Data
This section collects any data citations, data availability statements, or supplementary materials included in this article.


