Abstract
During a Research Career Development Award from the National Eye Institute, I spent a year at the University of Cambridge doing research with John Robson. The goal was to use a visual stimulation approach that had not been previously attempted with the intention of exploring fundamental organization principles of the neural basis of binocular vision. The idea was to use sinusoidal gratings drifted before both eyes such that the relative phase for one eye was fixed while that of the other was varied. This provided binocular stimuli of variable relative phase, i.e. retinal disparity, to enable testing of binocular response characteristics. We were able to obtain different types of disparity tuning functions for neurons in the primary visual cortex. This work, followed by extended investigations in Berkeley, provided basic information regarding response characteristics of simple and complex cells. We have also shown for monocular deprivation, an approximate model for human amblyopia, that many neurons remain connected to the deprived eye, as demonstrated with dichoptic activation. A selected portion of this work is described here.
Keywords: neurophysiology of central visual pathway in the brain, binocular vision, neural basis of stereoscopic depth discrimination, neural organization of binocular apparatus
Basic Concepts and Previous Work
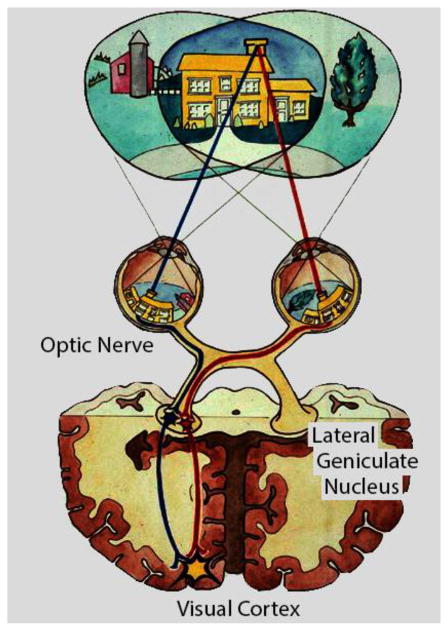
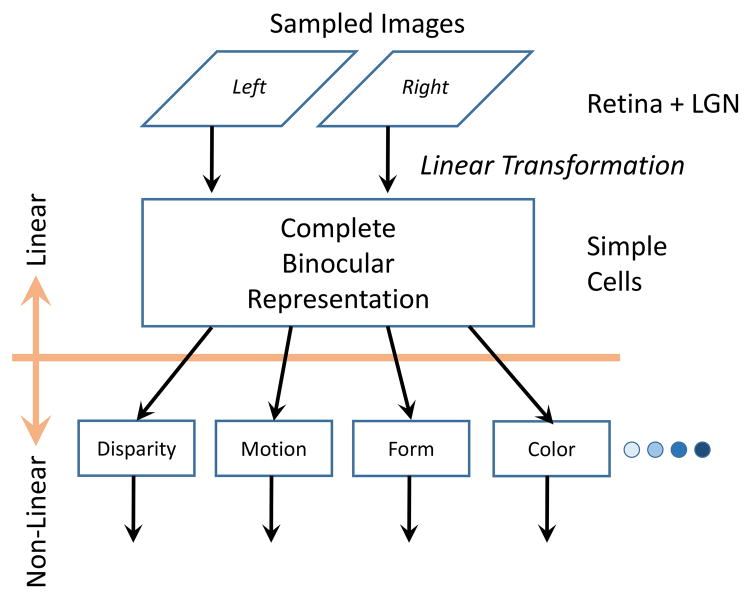
The most obvious application of binocular vision in animals with frontally positioned eyes is that it enables stereoscopic depth discrimination. Although there are well-known cues for depth in monocular views, the extraordinary acuity of binocular spatial perception enables eye-hand coordination for minute differences that is not possible with single eye viewing. One of our initial primary interests was the nature of the underlying neural organization that encodes and processes binocular signals. Figure 1 shows a standard diagram of a visual scene that is processed through the binocular system. In this case, the chimney of a house is imaged in a standard inverse projection onto the two retinae. From there, processing occurs from ganglion cells to optic nerve fibers through the optic chiasm to the lateral geniculate nucleus of the thalamus. Radial projections then emanate to the posterior region of the primary visual cortex where images from left and right eyes are first brought together in a functional binocular system. Parameters of this system are illustrated in Figure 2 which shows sampled images from left and right eyes being combined by assumed linear transformation in simple cells of visual cortex. Then intra-cortical processes together with direct input participate in encoding various visual functions including binocular disparity, motion, form, color, etc.
Figure 1.
This cartoon is an overview of visual processing of a natural scene. Overlapping visual fields of the two eyes converge on the chimney of the house. Images of the chimney are represented in the usual inverted manner at the retina and processing proceeds along the optic nerves through the optic chiasm and into the lateral geniculate nucleus of the thalamus. Subsequent projections radiate into the primary visual cortex where the image of the chimney is represented.
Figure 2.
Image representation from both eyes is processed via linear transformation to the first stage of visual cortex at a simple cell level where binocular representation is first established. This process is assumed to be linear. Further processing of different visual variables occurs in an assumed nonlinear stage to process binocular disparity and other features.
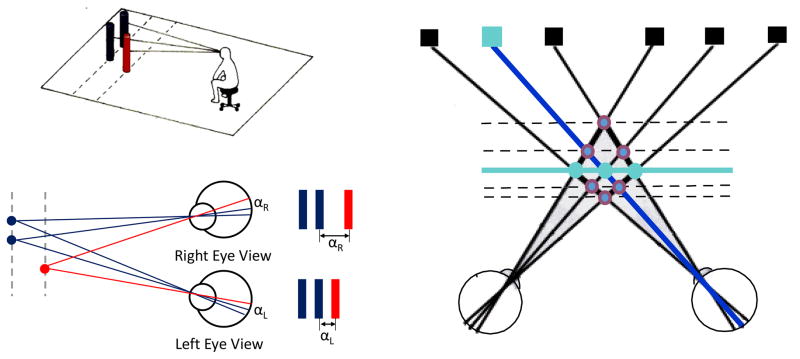
The special nature of binocular depth discrimination is made possible because frontal laterally positioned eyes have left and right eye images on the retina which are slightly displaced with respect to each other. This retinal disparity of the two images is the necessary and sufficient condition for stereoscopic depth discrimination as illustrated in Figure 3. In the upper left of the figure, a subject observes three vertical posts such that two are at a single distance from the observer and the third is slightly closer. The geometry of image formation is illustrated from a top view at the lower left. Image displacement of the nearer post [red] from the two further ones is larger for the right compared to the left eye. This difference constitutes binocular retinal disparity and the task of the system is to determine the appropriate depth plane for a given displacement as depicted on the right side of the figure.
Figure 3.
The geometry of retinal disparity. A subject observes three vertical posts, two of which are at one distance and the third is placed closer to the subject. The situation is represented from an overhead view which shows positions of visual direction from each post for left and right eye views. The images of the posts are represented adjacent to the retina where the distance αR is larger than that of αL. On the right of the figure, various positions in visual space are represented by squares. From the different crossing planes, the visual system has to determine the appropriate coordinates to perceive correct distance.
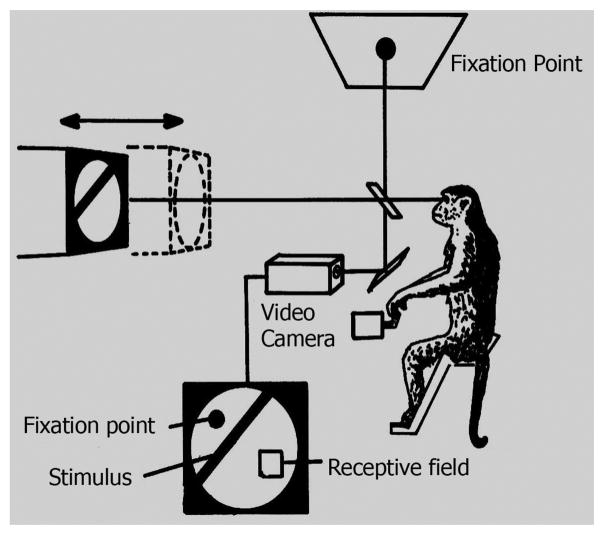
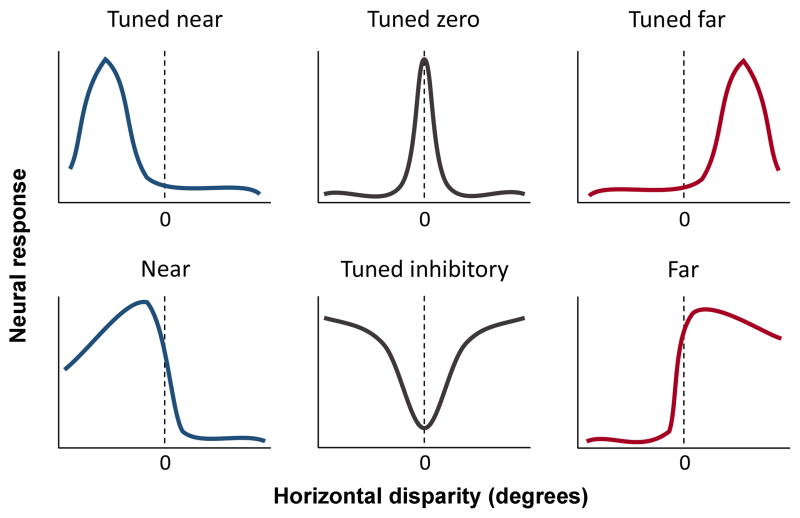
Neurons in the visual cortex have been studied extensively in attempts to determine characteristics of responses to various stimuli and to speculate regarding the physiological basis of different types of visual perceptions. An early and seminal study of cortical cells sensitive to different degrees of binocular disparity laid out the ideas of how depth changes may be processed by the visual cortex.1 The concept was developed from the observation that neurons responded selectively to specific ranges of retinal disparity which corresponded to different visual depths. Several studies of cells in visual cortex were conducted to test the idea that they constitute the initial stage of depth encoding in the visual system.2–5 A major advance in this area occurred with studies of behaving monkeys trained to observe a fixation point while targets were presented at different depths.6–8 Simultaneously, neurons in primary and secondary visual cortex [V1 and V2] were studied to determine response behavior. A diagram of the testing apparatus is shown in Figure 4. A monkey observes a fixation point via a semi- transparent beam splitter and sees a target that can be moved in front of or behind the apparent fixation plane by varying amounts. Differential depth acuity can be determined while neural responses are collected. Primary categories of responses are illustrated in Figure 5. The abscissa indicates values of horizontal disparity in degrees and the ordinate signifies levels of neural responses from single cells. The six categories shown are typical types in standard populations of cortical cells. The upper three; tuned near, tuned zero, and tuned far, represent excitatory responses when targets are closer, identical to, or farther from fixation planes, respectively. The lower three responses are more specific in preference characteristics and they show: excitement at near and inhibition at other distances, inhibition at a fixation distance, and excitation at far with inhibition at near planes, respectively.
Figure 4.
A monkey is trained to observe a fixation point and simultaneously, a target is positioned at different distances from the animal. Simultaneously, individual neurons in visual cortex (V1 and V2) are recorded to relate changes in response patterns to alterations in distance. (Modified from reference 6).
Figure 5.
Typical response patterns of cortical cells are depicted here. In the top row, cells are tuned to near or far distances relative to fixation or they are tuned specifically to the fixation plane [tuned zero]. In the bottom row, cells are tuned to relative near or far distances, or they are inhibited at the fixation plane of observation [tuned inhibitory]. (Modified from reference 8)
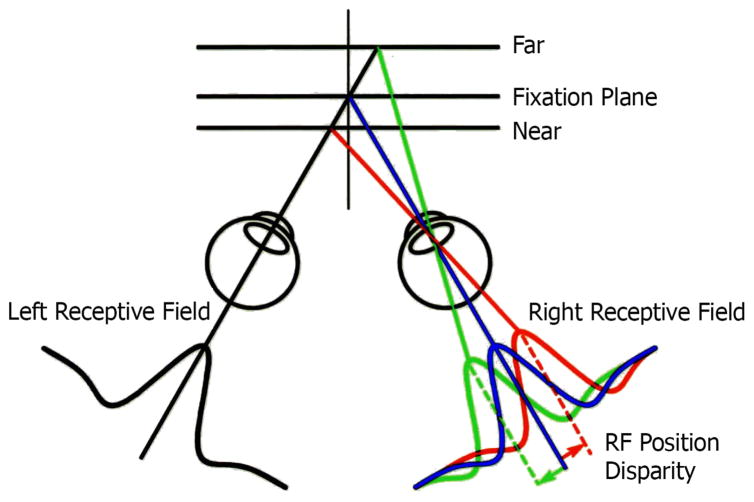
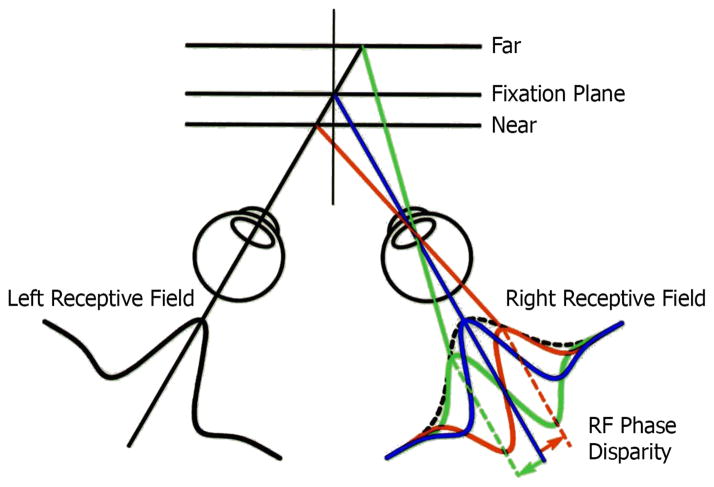
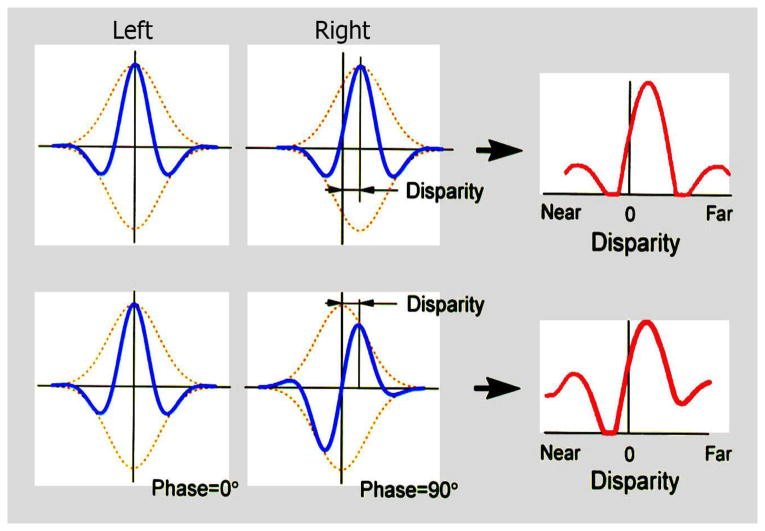
For nearly all of the classical work on neural processing of binocular disparity, the assumption has been that the relevant separation of signals to the two eyes occurs because of a position shift of one image with respect to the other. Nearly all the work on the physiological basis of disparity processing assumes a position shift. However, there is an alternative mechanism involving a phase shift that can also achieve retinal disparity. Phase shift can occur when the internal structure of the receptive fields for right and left eyes are dissimilar. Although previous studies did not find dissimilarities,9 we used a specific quantitative technique that provided detailed receptive field maps and found clear evidence of asymmetries in left and right eye patterns.10,11 Position and phase disparity processes are illustrated in Figures 6 and 7. In both diagrams, fixation planes are shown along with relatively far and near positions. The depicted receptive field shapes in Figure 6 illustrate a gradual lateral shift in image position in the right eye while that in the left remains constant. In Figure 7, the left receptive field image remains constant while those in the right eye change shape but not position. The creation of retinal disparity by these two different mechanisms is illustrated in Figure 8. At the top, a relatively far distance is indicated by the disparity tuning function shown on the right. At the bottom, the same relative shift in disparity is illustrated and is achieved by different internal receptive field structure between left and right eyes. We have performed detailed neurophysiological experiments in which we recorded from individual cells in the primary visual cortex (Area 17) of the cat. In these studies, binocular neurons were activated with sinusoidal gratings arranged to test phase or position disparities. Results demonstrate clearly that most cortical cells respond to both phase and position in varying degrees.10,11
Figure 6.
Signals for distance changes are encoded by shifts in relative positions of receptive field placement for the right eye with respect to a fixed position in the left. This is the classic assumption of the encoding of retinal disparity.
Figure 7.
An alternative encoding system for disparity is illustrated here. In this case, relative receptive field position does not change. Instead the shape of the receptive field, in this case for the right eye, is altered, representing different internal organization. The result is a difference in relative receptive field phase disparity instead of that for position.
Figure 8.
Receptive fields for left and right eyes are represented by Gabor functions and in the top row, relative disparity is signaled by change of position, in this case toward a relatively far distance. In the bottom row, the same disparity is encoded but by a different internal receptive field structure for the right eye. The same relatively far distance is encoded in the bottom as that shown for the top row.
Binocular Summation
A basic functional question that we have addressed concerns the rules by which signals from left and right eyes are combined in visual cortex. The simplest mechanism might be a symmetrical linear combination of inputs from the two eyes. A second possibility is that of multiplicative convergence in which a given cortical cell may be unresponsive to input through either eye but responds clearly to simultaneous input from both eyes together. Another possibility is to have symmetrical inputs which are modified by presynaptic or postsynaptic input of an inhibitory or excitatory nature. For a considerable amount of published data, the mechanism appears to be that of linear summation in combination with a threshold mechanism that follows binocular convergence. Another type of binocular interaction consists of multiplicative process that may apply to both simple and complex cortical cell types.12,13
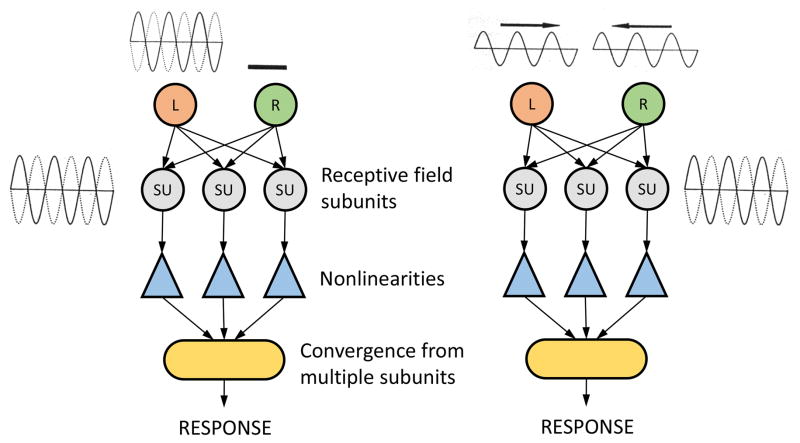
We have designed and used a unique test to determine the degree of linearity of binocular summation as illustrated in Figure 9.12,14 Two processing systems are depicted. On the left, input to the right eye is blocked while that to the left is open. The initial input goes to a series of subunits and then via nonlinearities (triangles), the pathway converges to a cortical cell. It is assumed that the subunits have identical neural images via linear binocular convergence. The stimulus to the left eye is a counter-phase grating which results in a frequency doubled response as shown in previous work.15 The second diagram, on the right, is similar to that on the left but visual stimulation occurs to both left and right eyes. In this case, the left eye is activated by a sinusoidal grating that drifts to the right at 2 Hz. An identical grating stimulates the right eye but the direction of drift is to the left instead of the right. We know from wave theory that the combination depicted on the right of this diagram is a combined sinusoidal pattern of twice the amplitude of either stimulus alone which counter-phases in place instead of drifting in either direction. If there is a linear combination of left and right eye stimuli, the resulting input at the combined stage is a counter- phase grating identical to that illustrated in the diagram on the left. If this occurs in the neurophysiological test of cortical cells, we may conclude that binocular summation is linear. Experimental tests with cortical cells have verified this prediction.14
Figure 9.
A physiological stimulation system is depicted which provides a determination of whether signals from left and right eyes are combined in a linear manner at the first stage of processing in the visual cortex. On the left, the right eye is occluded while the left is stimulated with the sinusoidal grating that is counter- phasing in position. Pathways from the left eye activate receptive field subunits in the visual cortex followed by nonlinear processing and convergence to form a frequency doubled response. On the right, both eyes are activated by drifting sinusoidal gratings moving in opposite directions in front of the two eyes. If there is a linear combination of signals from these patterns, a counter phased stimulus will be activated at the subunit level to produce a frequency doubled response as in the case on the left.
Binocular Interaction for Differences in Left and Right Eye Stimuli
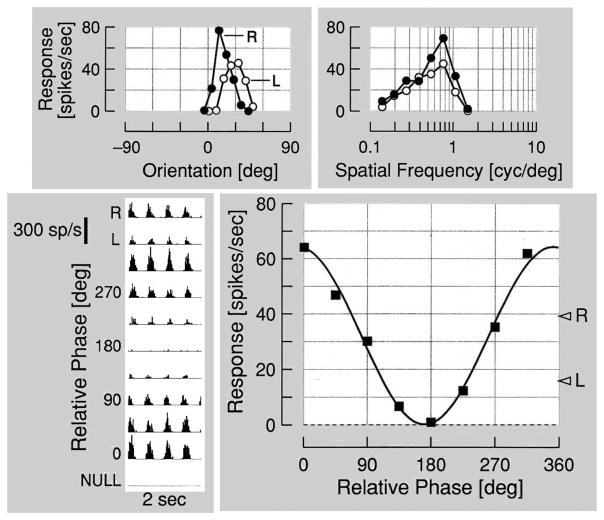
We have conducted a series of experiments in which single neuron recordings have been made in visual cortex to determine binocular characteristics.12–14,16–18 An example of the kind of data we have obtained for a typical simple cell is illustrated in Figure 10. The upper two panels show typical monocular tuning functions for orientation and spatial frequency variables. As the data demonstrate, tuning functions are similar for left and right eye stimulus conditions for both orientation and spatial frequency variables. Right and left eye response strength varies for both parameters. The lower left panel shows results of binocular stimulation in the form of harmonic analysis of post- stimulus time histograms of responses to different relative intraocular phase values. The data show typical modulated discharge with bursts of firing at the first harmonic of the temporal frequency of the stimulus grating. Note the differences in response as relative intraocular phase is varied. For some relative intraocular phases, responses are strong while others are weak and in this case, even silent at a relative intraocular phase of 180°. The graphical form of this histogram is shown on the lower right which plots responses for relative phase differences. The sinusoidal response curve shown here is typical for simple cells in the visual cortex.
Figure 10.
A typical phase specific response pattern is shown for a simple cell in the visual cortex. Responses in the top row represent monocular tuning functions for orientation and spatial frequency. At the bottom left post stimulus time histograms are shown for relative intraocular phase positions combined with interleaved monocular responses. On the lower right, harmonic analysis shows a sinusoidal pattern of alterations in neural response as a function of relative intraocular phase.
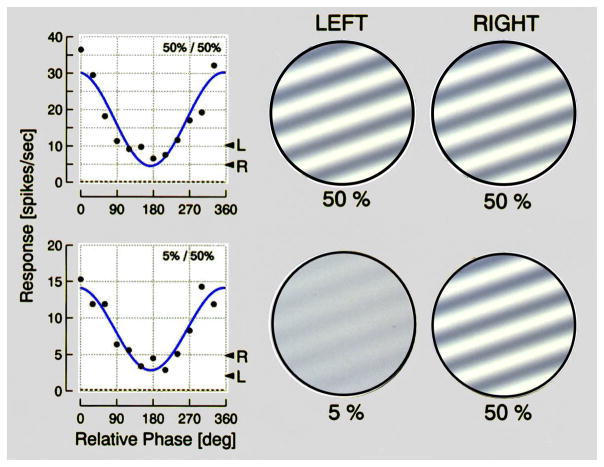
In the example shown above, left and right eye stimuli are identical. It is also of interest to do similar tests when stimuli to the two eyes are different. Specifically, what happens to binocular interaction when the stimulus to one eye is weaker than that to the other? Adaptation to different levels of visual stimuli is a basic feature of processing. The retina adjusts to absolute light levels and visual cortical cells adapt to different contrast levels.19,20 Comparisons of monocular and binocular contrast encoding suggest that the main adjustments occur at a monocular level.21 Effective contrast in the human visual system can be weak in one eye and strong in the other. Clinically, this can occur and cause diminished binocular function. Behavioral tests verify that reduced contrast in one eye can cause a marked reduction in stereo function.22,23 We undertook neurophysiological studies in which contrast differences were used for left and right eye sinusoidal grating stimuli in order to determine effects on binocular interaction. Our findings, illustrated in Figure 11, show two sets of results for phase varying binocular stimulation. In the upper sequence, results are shown for two identical gratings presented at different relative intraocular phases to a cortical cell. The result shown on the top left is a typical response pattern, as noted above, for a cortical simple cell. In the bottom part of the figure, an identical test is conducted with the same neuron only in this case, there is an order of magnitude difference in contrast levels [5% and 50%] between left and right eye stimuli. What is surprising here is that the response curve shown on the left exhibits a closely similar sinusoidal response to that for the equal contrast stimuli. The only clear difference is that the response magnitude at the bottom is reduced to about half that exhibited above for the equal contrast left and right eye gratings.
Figure 11.
Similar relative phase patterns to those of Figure 10 are shown in the top row for 50% contrast gratings used for both eyes. In the bottom row, a relative phase pattern is shown for large differences of stimulus contrast [5% and 50%] for left and right eye patterns.
These results have been verified for a population of cortical cells in our work and that of others (for example 24) and suggest clearly that there is a compensatory mechanism which provides a relatively constant binocular interaction. If we assume that a low contrast grating stimulus causes a raised response threshold, the implication is that there is a synaptic gain of signals from the weak input eye. The gain is presumably high when input contrast is low and the reverse for high input contrast. Two compensatory mechanisms are suggested. In one, a threshold process occurs after convergence of input from both eyes. A second possible mechanism is a monocular gain control that occurs at the synaptic contact between an eye and a cortical neuron. This latter process can result in the relatively similar binocular interaction profile for different right and left eye contrast grating stimuli.
Summary
The frontal position of the two eyes in the primate visual system provides the basis for fine binocular perception. Specifically, left and right eye views provide corresponding retinal images that are slightly displaced from each other. This retinal disparity is the necessary and sufficient condition for stereoscopic depth discrimination. Numerous behavioral and electrophysiological studies have been conducted to elucidate this system. Investigations of individual cortical neurons have resulted in a basic understanding of the neural organization of binocular vision. Our laboratory has undertaken a series of studies of this process. The current brief review concerns three aspects of binocular vision. First, binocular disparity is encoded by differences in relative retinal position or receptive field internal structure of images from left and right eyes. Second, we designed a unique test to determine that early binocular combination in the visual cortex is a linear process. Subsequent processing involves intra-cortical nonlinear events. Third, binocular interaction in the visual cortex is retained during unequal stimulation of left and right eye pathways. This suggests the involvement of a gain control mechanism.
References
- 1.Pettigrew JD. Bachelor of Science thesis. Sydney, Australia: University of Sydney; 1965. Binocular Interaction on Single Units of the Striate Cortex of the Cat. [Google Scholar]
- 2.Barlow HB, Blakemore C, Pettigrew JD. The Neural Mechanism of Binocular Depth Discrimination. J Physiol. 1967;193:327–42. doi: 10.1113/jphysiol.1967.sp008360. [DOI] [PMC free article] [PubMed] [Google Scholar]
- 3.Bishop PO, Henry GH, Smith CJ. Binocular Interaction Fields of Single Units in the Cat Striate Cortex. J Physiol. 1971;216:39–68. doi: 10.1113/jphysiol.1971.sp009508. [DOI] [PMC free article] [PubMed] [Google Scholar]
- 4.Joshua DE, Bishop PO. Binocular Single Vision and Depth Discrimination. Receptive Field Disparities for Central and Peripheral Vision and Binocular Interaction on Peripheral Single Units in Cat Striate Cortex. Exp Brain Res. 1970;10:389–416. doi: 10.1007/BF02324766. [DOI] [PubMed] [Google Scholar]
- 5.Nikara T, Bishop PO, Pettigrew JD. Analysis of Retinal Correspondence by Studying Receptive Fields of Binocular Single Units in Cat Striate Cortex. Exp Brain Res. 1968;6:353–72. doi: 10.1007/BF00233184. [DOI] [PubMed] [Google Scholar]
- 6.Poggio GF, Fischer B. Binocular Interaction and Depth Sensitivity in Striate and Prestriate Cortex of Behaving Rhesus Monkey. J Neurophysiol. 1977;40:1392–405. doi: 10.1152/jn.1977.40.6.1392. [DOI] [PubMed] [Google Scholar]
- 7.Poggio GF, Talbot WH. Mechanisms of Static and Dynamic Stereopsis in Foveal Cortex of the Rhesus Monkey. J Physiol. 1981;315:469–92. doi: 10.1113/jphysiol.1981.sp013759. [DOI] [PMC free article] [PubMed] [Google Scholar]
- 8.Poggio GF, Gonzalez F, Krause F. Stereoscopic Mechanisms in Monkey Visual Cortex: Binocular Correlation and Disparity Selectivity. J Neurosci. 1988;8:4531–50. doi: 10.1523/JNEUROSCI.08-12-04531.1988. [DOI] [PMC free article] [PubMed] [Google Scholar]
- 9.Hubel DH, Wiesel TN. Receptive Fields, Binocular Interaction and Functional Architecture in the Cat’s Visual Cortex. J Physiol. 1962;160:106–54. doi: 10.1113/jphysiol.1962.sp006837. [DOI] [PMC free article] [PubMed] [Google Scholar]
- 10.Anzai A, Ohzawa I, Freeman RD. Neural Mechanisms Underlying Binocular Fusion and Stereopsis: Position vs. Phase Proc Natl Acad Sci U S A. 1997;94:5438–43. doi: 10.1073/pnas.94.10.5438. [DOI] [PMC free article] [PubMed] [Google Scholar]
- 11.Anzai A, Ohzawa I, Freeman RD. Neural Mechanisms for Encoding Binocular Disparity: Receptive Field Position versus Phase. J Neurophysiol. 1999;82:874–90. doi: 10.1152/jn.1999.82.2.874. [DOI] [PubMed] [Google Scholar]
- 12.Ohzawa I, Freeman RD. The Binocular Organization of Simple Cells in the Cat’s Visual Cortex. J Neurophysiol. 1986;56:221–42. doi: 10.1152/jn.1986.56.1.221. [DOI] [PubMed] [Google Scholar]
- 13.Freeman RD. The cortical organization of binocular vision. In: Werner JS, Chalupa LM, editors. The New Visual Neurosciences. chapter 27 Cambridge, MA: MIT Press; 2014. [Google Scholar]
- 14.Ohzawa I, Freeman RD. The Binocular Organization of Complex Cells in the Cat’s Visual Cortex. J Neurophysiol. 1986;56:243–59. doi: 10.1152/jn.1986.56.1.243. [DOI] [PubMed] [Google Scholar]
- 15.Movshon JA, Thompson ID, Tolhurst DJ. Spatial and Temporal Contrast Sensitivity of Neurones in Areas 17 and 18 of the Cat’s Visual Cortex. J Physiol. 1978;283:101–20. doi: 10.1113/jphysiol.1978.sp012490. [DOI] [PMC free article] [PubMed] [Google Scholar]
- 16.Ohzawa I, DeAngelis GC, Freeman RD. Stereoscopic Depth Discrimination in the Visual Cortex: Neurons Ideally Suited as Disparity Detectors. Science. 1990;249:1037–41. doi: 10.1126/science.2396096. [DOI] [PubMed] [Google Scholar]
- 17.Ohzawa I, DeAngelis GC, Freeman RD. Encoding of Binocular Disparity by Simple Cells in the Cat’s Visual Cortex. J Neurophysiol. 1996;75:1779–805. doi: 10.1152/jn.1996.75.5.1779. [DOI] [PubMed] [Google Scholar]
- 18.Ohzawa I, DeAngelis GC, Freeman RD. Encoding of Binocular Disparity by Complex Cells in the Cat’s Visual Cortex. J Neurophysiol. 1997;77:2879–909. doi: 10.1152/jn.1997.77.6.2879. [DOI] [PubMed] [Google Scholar]
- 19.Ohzawa I, Sclar G, Freeman RD. Contrast Gain Control in the Cat’s Visual System. J Neurophysiol. 1985;54:651–67. doi: 10.1152/jn.1985.54.3.651. [DOI] [PubMed] [Google Scholar]
- 20.Sclar G, Ohzawa I, Freeman RD. Contrast Gain Control in the Kitten’s Visual System. J Neurophysiol. 1985;54:668–75. doi: 10.1152/jn.1985.54.3.668. [DOI] [PubMed] [Google Scholar]
- 21.Truchard AM, Ohzawa I, Freeman RD. Contrast Gain Control in the Visual Cortex: Monocular versus Binocular Mechanisms. J Neurosci. 2000;20:3017–32. doi: 10.1523/JNEUROSCI.20-08-03017.2000. [DOI] [PMC free article] [PubMed] [Google Scholar]
- 22.Schor C, Heckmann T. Interocular Differences in Contrast and Spatial Frequency: Effects on Stereopsis and Fusion. Vision Res. 1989;29:837–47. doi: 10.1016/0042-6989(89)90095-3. [DOI] [PubMed] [Google Scholar]
- 23.Legge GE, Gu YC. Stereopsis and Contrast. Vision Res. 1989;29:989–1004. doi: 10.1016/0042-6989(89)90114-4. [DOI] [PubMed] [Google Scholar]
- 24.Smith EL, 3rd, Chino YM, Ni J, et al. Residual Binocular Interactions in the Striate Cortex of Monkeys Reared with Abnormal Binocular Vision. J Neurophysiol. 1997;78:1353–62. doi: 10.1152/jn.1997.78.3.1353. [DOI] [PubMed] [Google Scholar]


