

Abstract
Purpose
It is well known that cancers exploit immune checkpoints (programmed death 1 receptor (PD-1) and its ligand (PD-L1)) to evade anti-tumor immune responses. Although immune checkpoint (IC) blockade is a promising approach, not all patients respond. Hence, the purpose of this study is imaging of tumor infiltrating lymphocytes (TILs), as they are known to express PD-1 during activation and subsequent exhaustion in the tumor microenvironment and are thought to be potentially predictive of therapeutic responses to IC blockade.
Procedures
We developed immunoPET tracers to image hPD-1 status of human peripheral blood mononuclear cells (hPBMC) adoptively transferred to NOD-scid IL-2Rγnull (NSG) mice (hNSG) bearing A375 human skin melanoma tumors. The anti-PD-1 human antibody (IgG; keytruda) labeled with either [89Zr]- or [64Cu]- radiometals to image PD-1 expressing human TILs in vivo.
Results
[89Zr]keytruda (groups = 2; NSG-ctl [control] and hNSG-nblk [non-blocking], n=3-5, 3.2 ± 0.4 MBq/15-16 μg/200 μL, and [64Cu]keytruda (groups = 3; NSG-ctl, NSG-blk [blocking], and hNSG-nblk) n=4, 7.4 ± 0.4 MBq /20-25μg/200 μL) were administered in mice. PET-CT scans were performed over 1-144 h ([89Zr]keytruda) and 1-48 h ([64Cu]keytruda) on mice. hNSG mice exhibited a high tracer uptake in the spleen lymphoid organs and tumors. At 24h, human TILs homing into melanoma of hNSG-nblk mice exhibited high signal (mean %ID/g ± SD) of 3.8 ± 0.4 ([89Zr]keytruda), and 6.4 ± 0.7 ([64Cu]keytruda), which was 1.5- and 3-fold higher uptake compared to NSG-ctl mice (p = 0.01), respectively. Biodistribution measurements of hNSG-nblk mice performed at 144 h ([89Zr]keytruda), and 48 h ([64Cu]keytruda) p.i. revealed tumor to muscle ratios as high as 45 and 12-fold, respectively.
Conclusion
This study clearly demonstrates specific imaging of human PD-1 expressing TILs within the tumor and lymphoid tissues. This suggests anti-human-PD-1 tracer could be clinically translatable to monitor cancer treatment response to IC blockade therapy.
Keywords: ImmunoPET, PD-1 TILs, [89Zr], [64Cu], Keytruda, humanized NSG
Introduction
There is an urgent need to develop diagnostic tools for improved clinical management of cancer patients. To select cancer treatments, and to evaluate their efficacy, current practice utilizes sampling of peripheral blood to analyze circulating tumor cells or other biomarkers in the blood, or invasive techniques such as biopsies to grade a tumor by histology. Although FDG-PET provides a non-invasive imaging technique for detecting and monitoring tumor growth based on tumor metabolism, this strategy provides limited information in regards to cancer immunotherapies. Compared to FDG-PET, immunoPET tracers utilizing antibodies, antibody fragments, or targeted peptides, are designed to bind a specific biomarker. This enables the imaging of certain immune cell subtypes or expression markers of disease, which may provide further insights into immunotherapy success and failure.
Recently, immune checkpoint blockade of cytotoxic lymphocyte antigen-4 (CTLA-4), programmed death-1 receptor (PD-1), and/or programmed death-1 ligands (PD-L1/L2) has emerged as a powerful strategy for cancer therapy [1-3]. This has been well validated in human patients using anti-CTLA-4 (Ipilimumab, Tremelimumab), anti-PD-1 (Nivolumab, Pembrolizumab), and anti-PDL-1 (MED14736) antibodies for metastatic melanoma and lung cancer [4-6]. Specifically, blockade of the PD-1 signaling axis using anti-PD-1 monoclonal antibodies (mAb) has shown encouraging results in restoring suppressed anti-tumor immunity [7-12]. These include Nivolumab (Bristol-Myers Squibb, PD-1), Pembrolizumab (Merck, PD-1) and MSB0010718C (Merck, PD-L1). Thus, it is becoming clear that signaling through the PD-1 axis significantly dampens anti-tumor immune responses [13-17].
PD-1 is immunoglobulin (Ig) B7 receptor family, a transmembrane protein with three protein domains containing 288 amino acids [16, 18]. Its activity and expression are enhanced by IFN-γ, TNF-α cytokine secretion and PD-L1. PD-1 is expressed on many cell types such as CD4+, CD8+ effector T cells, natural killer (NK) T cells, B cells, and some dendritic cells [15, 16]. Expression of this protein on CD8+ T cells diminishes the effector function of the CD8+ T cells [19, 20]. PD-1 is also expressed on CD4+Foxp3+ regulatory T cells (Tregs), which are known to generate immunosuppression in the tumor microenvironment [19, 20]. Consequently, PD-1 pathway stimulation affects T cell immunoreactivity in the tumor microenvironment.
Clinical blockade of immune checkpoints has resulted in an increased prevalence of late stage patients with progression free survival beyond the two-year mark, suggesting the benefit of immune checkpoint inhibitors over conventional regimens [6, 15]. Recent randomized clinical trials indicate that anti-PD-1 therapy (Nivolumab and Pembrolizumab) has demonstrated a survival advantage, including patients who progressed after treatment with Ipilimumab [21, 22]. However, despite encouraging clinical results, many cancer patients do not respond to clinical checkpoint blockade. Thus patients treated with immunotherapies commonly appear with tumor growth or not complete remission prior to relapse [23] Though, anatomic imaging has been regularly performed [24, 25] to measure tumor size, and to monitor therapy, a compelling need exists for molecular imaging to accurately predict which patients are most likely to benefit from anti-PD-1/PD-L1 treatment and to establish assessment criteria.
Due to tumor heterogeneity, some tumors are able to evade immune-mediated therapy, hence relevant biomarkers are necessary to guide and monitor therapy. PD-1 expression on tumor infiltrating lymphocytes may serve as a good biomarker to predict responders to checkpoint blockade [26-38]. It has been difficult to determine the true prognostic value of PD-1 using biopsies in conjunction with immunohistochemistry (IHC) methods, as the expression is highly heterogeneous both within the primary tumor and metastases.
Hence, there is a convincing need to detect and quantify the PD-1 expression levels in patients, by a non-invasive method, such as PET imaging. This will provide more accurate information to select eligible candidates for PD-1 immunotherapies. In this report, we present a novel anti-human PD-1 immunoPET tracer development that is capable of specifically imaging PD-1 expression on human TILs. Until now, there has been no clinically approved PET tracer available for imaging global PD-1 to monitor therapy. In this context, our new tracer would be readily translatable to human patients, and would fill this need once FDA approved.
Experimental Procedures
Reagents, antibodies, and radiochemicals
All reagents were obtained from Sigma-Aldrich (St. Louis, MO) unless otherwise stated. The chelators P-isothiocyanatobenzyl-desferrioxamine (Df-Bz-NCS: Df) and N-succinimidyl-DOTA (NHS-DOTA) were purchased from Macrocyclics (Dallas, TX, USA). [89Zr] in 1 M Oxalic acid (t ½ = 78.4 h, radionuclide purity >99%; 1-0.8 GBq/ml in 1 M Oxalic acid) was obtained from Perkin Elmer (Waltham, MA, USA). [64Cu]Cl2 was purchased from University of Wisconsin (Madison, WI). A humanized monoclonal immunoglobulin (Ig) G4 antibody (25 mg/ml) directed against human PD-1 (keytruda®[Pembrolizumab], Merck & Co., Rahway, NJ, USA) was purchased from Stanford University Hospital Pharmacy (Stanford, CA, USA).
Cell lines and instruments
The 293T and A-375 cell lines used in this study were obtained from American Type Culture Collection (www.atcc.com, ATCC® number: CRL-3216 and CRL-1619, respectively). These cells were maintained in Dulbecco's modified Eagle's medium (DMEM) (4.5 g/L glucose). Media was supplemented with 10% fetal calf serum (FCS), 2 mmol/L glutamine, 100 units/mL penicillin, 100 μg streptomycin, and 0.25 μg/mL fungizone. All media and additives were obtained from Invitrogen Corporation (Carlsbad, CA USA). The human PD-1 expressing 293T cell line was developed in-house using 293T transfected with pC Puro Ubx hPD1-IRES-eGFP cDNA and lipofectamine 3000. The transfected cells were incubated with 3 ng/ ml of Puromycin in DMEM media for several days for luciferase positive cell selection. FACS was performed with anti-human PD-1 antibody to enrich hPD1 positive cells.
High performance liquid chromatography (HPLC) was performed on an HPLC-Ultimate 3000 (Thermo Scientific, Waltham, MA, USA) with a SEC 2000 LC column (300 × 7.8 mm) with 5 μm, hydrophilic bonded silica support of 400-Å pore size (Phenomenex, Torrance, CA, USA) with an ultraviolet detector and an online radioactivity detector. An instant thin-layer chromatography strip (Biodex Medical Systems, Shirley, NY) with saline as mobile phase was employed as an additional quality test for purity of the tracer.
Preparation of immunoconjugate and immunoPET tracer
The anti-hPD-1 keytruda antibody was purified by Phenomenex size-exclusion chromatography (SEC) 2000 (Torrance, CA, USA) HPLC with phosphate buffer solution (pH 8.0) and buffer exchanged with 1 M HEPES/ 0.1 M Na2CO3 (pH 8.5 ± 0.5) and concentrated to ∼5 mg ml−1 using a Vivaspin 30kDa centrifugal filter (Thermo Fisher Scientific, Waltham, MA, USA; Catalogue #VS2021). Df-keytruda was prepared according to published procedure by conjugating Df-NCS to keytruda in a microfuge tube to generate Df-keytruda to chelate [89Zr] [39]. Coupling of the Df-NCS bifunctional chelate with keytruda was performed with the following conditions in three separate reaction vials: Three aliquots of 5 mg/mL of keytruda in 1 M HEPES buffer solution, pH 8.5–9.0 (∼ 1 mL) were placed into a 1.5 mL microfuge tube. In a separate microfuge tube, Df-NCS was dissolved in DMSO at a concentration between 9 - 10 mM (6.8 – 7.5 mg/ml). To the keytruda solution, was added 2.5, 5 and 7.5 molar excess of the Df-NCS (17-20 μL) over the molar amount of keytruda (33μM, 1mL), and vortexed immediately. DOTA-keytruda conjugate was prepared by mixing 5 mg/mL of keytruda in 1 M HEPES buffer solution, pH 7.5–8.0 (33μM, 1 mL) and DOTA-NHS 34 μL (10mM solution in DMSO) of 10 molar excess over keytruda into a 1.5 mL microfuge tube. The DMSO concentration was < 2% in all the reaction mixtures. The reaction mixture was incubated for 60 min at 37°C.
The Df-keytruda and DOTA-keytruda reaction mixtures were purified from excess Df-NCS or DOTA-NHS by SEC 2000 HPLC using 0.1 M ammonium acetate buffer (pH 5.5) as the mobile phase eluted at 1mL/min. The immunoconjugate was concentrated to achieve ∼2.5 mg/mL using a Vivaspin, 30 kDa cut off centrifugal filter and stored in 200 μl aliquots in 0.1 M ammonium acetate buffer (pH 5.5) at -20°C. The number of chelators (c) coupled per antibody (a) i.e., c/a was estimated with matrix-assisted laser desorption/ionization time-of-flight mass spectrometry (MALDI-TOF-MS) by comparison of unmodified keytruda, Df-keytruda and DOTA-keytruda [31].
In vitro live cell-binding assay of the immunoconjugate
Binding affinity of the Df-keytruda and DOTA-keytruda was compared with unmodified keytruda, and was tested on transiently transfected hPD-1 expressing 293T cells and analyzed by flow cytometry. Briefly, keytruda, Df-keytruda, and DOTA-keytruda were diluted to 1nM solution in FACS buffer Dulbecco's PBS. Staining was performed in 96-well microtitre plates (V-bottom). In each well, 100 μl of the keytruda or Df-keytruda or DOTA-keytruda was mixed with 100 μl cell suspension containing 5×10⁵ hPD-1-293T cells and incubated for 1 h on ice. Cells were washed three times with FACS buffer. After washing, each well receiving 100 μL of biotin-anti-human antibody (eBioscience, Inc., San Diego, CA) pre-diluted to 1:100 in FACS-buffer. The Eliza plate containing cells was kept on ice and incubated for 45 mins; afterwards incubation cells were washed three times. Finally, the cells were stained with 100uL of streptavidin-APC (1:100 dilution). Dead cells were discriminated by propidium iodide staining. Analysis was carried out on a flow cytometer (FACS Aria III, BD Biosciences, San Jose, CA, USA) at the Canary Center, Stanford Core Facility. Data was analyzed by FlowJo FACS analysis software version 10.1 (Tree Star, Ashland, OR, USA).
Synthesis of [89Zr]keytruda
The reaction vial was prepared with the following reactants: while gently shaking, 100-200uL of 0.1M oxalic acid, 89Zr isotope (220-230 MBq; 500 μL), and 1 M Na2CO3 (80 ± 20 μL) were added into the reaction vial and incubated for 3 min at room temperature; after 3 min, 200 ± 50 μL of 0.5 M HEPES (pH 7 ± 0.5) was added, and finally Df-keytruda1-1.5 mg (200-300 μL) was added and the pH readjusted to 8 ± 0.5 using 0.5 M HEPES and incubated at 37° for 60 mins.
Synthesis of [64Cu]keytruda
64CuCl2 isotope (260-270 MBq; 750 μL), was mixed with 1 M Na2CO3 (60 ± 10 μL) to adjust the pH to 7 ± 0.5, and transferred into a reaction vial containing 0.5 mg DOTA-keytruda (100 μL) and incubated at 37°. After incubation (60 min), 0.1M Ethylenediaminetetraacetic acid (EDTA), pH 8.0, was added to achieve final concentration of 10 mM for 15 minutes to scavenge unchelated [89Zr] or 64Cu in the reaction mixtures. Purification of the radioimmunoconjugate ([89Zr]keytruda or [64Cu]keytruda) was achieved by SEC-2000 column in PBS buffer [0.1 mol/L NaCl, 0.05 mol/L sodium phosphate (pH 7.4) ] at a flow rate of 1.0 mL/min. The [89Zr]- or [64Cu]keytruda peak (retention time at 8 ± 2 min) corresponding to keytruda antibody was collected, and concentrated to ∼ 5mg/mL (by UV 280 nm) using a Vivaspin, 30 kDa cut off centrifugal filter.
Purity, immunoreactivity, and stability of the two tracers
The purity of the radiotracers was tested by TLC as well as SEC-2000 radio-HPLC. To measure the immunoreactivity of the tracer, live cell-binding assay was performed as described previously [40, 41]. Briefly, hPD-1 expressing 293T cells were suspended in microcentrifuge tubes (200 μL) at seven concentrations from 1 to 24 million cells per mL in 1% PBSA (pH 7.4). Each tube received 100 μL of [89Zr]keytruda or [64Cu]keytruda (stock solution: 5 kBq/22.5 μg/mL) tracer (n=2). After addition of tracer (final volume 300 mL), cells were gently vortexed and incubated at 37°C for 2 h. Following incubation, from each tube two 100 μL aliquots were removed to measure for total activity, as well as cell bound activity. Tubes marked for cell bound activity were centrifuged (300 g for 3 min.), and the supernatant was removed to measure cell pellet activity. The blocking experiment was performed simultaneously with the same procedure except by addition of 100-fold excess of cold keytruda one hour prior to addition of the tracer. Radioactivity associated with cells was measured with a gamma counter (1470 WIZARD Automatic Gamma Counter; Perkin Elmer, Walthem, MA). The counts per minute (cpm) data were background corrected and compared with the total activity versus bound activity. Immunoreactivity was computed by linear regression analysis by plotting of (Y axis: total/bound) activity versus (X axis: 1/[normalized cell concentration]), and calculated as 1/y-intercept × 100 [39, 40].
The serum stability of the [89Zr]keytruda tracer was tested with normal human serum (Sigma Aldrich, St Louis, MO) and incubated at 37°C. Serum with tracer mixture (100uL) was aliquoted and analyzed by radio-HPLC at two different time-points (4 and 48 h), and radio-HPLC elution was collected as 1-mL fractions and counted in a gamma counter. Percent activity of each fraction was computed to measure tracer stability in serum.
Animal studies
Animal studies were approved by the Administrative Panel on Laboratory Animal Care (APLAC) at Stanford University. NSG (NOD.Cg-Prkdcscid Il2rgtm1wjl/SzJ) mice were purchased from the Jackson Laboratory (Bar Harbor, ME) and maintained in-house in an AAALAC-accredited facility. Mice were housed in irradiated, disposable caging pre-bedded with corncob bedding (Innovive, CA) and provided with irradiated food (Teklad 2918, Envigo) and UV-irradiated, acidified, reverse osmosis, bottled water (Innovive, CA). Quarterly testing of sentinels to monitor the health status of the NSG colony showed the absence of ecto- and endoparasites, ectromelia virus, TMEV, LDEV, LCMV, MAV, MHV, MMV, MNV, MPV, PVM, Reo3, EDIM, Sendai, Helicobacter spp., Mycoplasma pulmonis, and Pasteurella pneumotropica. The average weight of the NSG mice was 22.0 ± 3.0 g. Humanized NSG mice (hNSG) were developed as per the methods published elsewhere [42] and utilized for the immunoPET imaging study. NSG-ctl mice did not receive hPBMC. The hPBMCs were isolated from normal human blood and tested by FACS for the expression of huCD45 and hPD-1+ lymphocytes. Positively tested hPBMC (5× 10⁶ cells) were injected via tail-vein in each of the NSG mice. Three days after implantation, hNSG mice were screened by FACS analysis for in vivo hPBMC engraftment. hNSG mouse blood was collected and stained for anti-human CD45 for the confirmation of hPBMC engraftment. Two groups of NSG mice (hNSG-nblk and NSG-ctl), (n = 4) were imaged at 1, 4, 18, 24, 48, 72, 96, 120 and 144 h using small animal PET/CT at the Stanford small animal imaging center. All experimental mice received [89Zr]keytruda [200 μL, corresponding to 3.2 ± 0.4 MBq, 15-16 μg of Df-keytruda] via tail vein injection. In a separate experiment, three groups (n = 4) of NSG mice (NSG-ctl, hNSG-blk [blocking], hNSG-nblk [non-blocking]) received [64Cu]keytruda and were imaged at 1, 2, 4, 18, 24, and 48h using small animal PET/CT. Each of these mice was administered [64Cu]keytruda [200 μL, equivalent of 7.4 ± 0.4 MBq dose, 20 - 25 μg of DOTA-keytruda] via tail vein injection. After radiotracer administration, the animals were scanned at the time points indicated above. Results are reported as percent injected dose per gram of tissue (%ID/g). Statistical analysis was done with Student's t test (two-tailed, unequal variance).
Small animal immunoPET-CT imaging
To acquire the PET-CT images, the immunoPET tracers were administered to a lightly restrained mouse via a lateral tail vein injection. PET-CT imaging was performed on a Siemens Inveon small-animal multimodality PET/CT system (Preclinical Solutions; Siemens Healthcare Molecular Imaging, Knoxville, TN). This system is capable of operating both the PET and CT scanners independently, or in combination, with excellent radial, tangential, and axial resolutions higher than 1.5 mm at the center of the field of view of the PET module. CT imaging was performed at 80 kVp at 500 μA, 2nd bed position, half scan 220° of rotation, and 120 projections per bed position with a cone beam micro-x-ray source (50μm focal spot size) and a 4064 × 4064-pixel X-ray detector. The data were reconstructed using Shepp-Logan filtering and cone-beam filtered back-projection.
The PET-CT images acquired were reconstructed with the two-dimensional ordered-subset expectation maximization (OSEM 2D) algorithm [43]. The microPET scanning [default settings with energy window of 350 to 650 keV] was performed at the following time points after the tracer injection; 1, and 4 hours, for 3 min; 18 and 24 hours, for 5 min; 24, 48, and 72 hours, for 10 min; 96 -144 hours for 15 min scans. Regions of interest (ROI) of organs of interest were computed using Inveon Research Workplace software (Preclinical Solutions; Siemens Healthcare Molecular Imaging, Knoxville, TN). ROI volume was converted to radioactivity concentration in counts per minute (cpm) by using a predetermined conversion factor. The %ID/g tissue was estimated by dividing each tissue's cpm obtained from the region of interest by the injected dose.
Biodistribution study of [89Zr]keytruda and [64Cu]keytruda
In vivo biodistribution studies were performed in two separate experiments to evaluate the uptake of [89Zr]keytruda and [64Cu]keytruda using humanized and control NSG mice groups. [89Zr]keytruda [200 μL, corresponding to 3.7 ± 0.4 MBq, 15-16 μg], was administered to two groups of mice (n=4, per group) NSG-ctl (non-PBMC), and NSG-nblk (with human PBMC) that were sacrificed after 144 h post scanning. The 64Cukeytrudatracer [200 μL, corresponding to 7.4 ± 0.4 MBq, 20-25 μg] was administered in three groups of mice (NSG-ctl, NSG-blk, and NSG-nblk) that were sacrificed after 48 h PET-CT scan. Animals were euthanized by CO2 gas asphyxiation for biodistribution studies. Organs were removed, rinsed in PBS, dried in air for 5 minutes, weighed and counted in a gamma-counter to determine corresponding radioactivity associated with each of the tissues. The immunoPET tracer dose uptake by each organ was determined by measuring the total number of counts per minute (cpm). Count data were background subtracted and decay corrected to the time of injection and the percent-injected dose per gram (%ID/g) for each tissue sample was calculated by normalization to the total activity injected.
Statistical analysis
Unpaired Student's t-test was used for data comparisons. P values less than 0.05 were considered statistically significant.
Results
We have prepared two immunoPET tracers ([89Zr]keytruda and [64Cu]keytruda) and performed imaging studies, to evaluate and select the best tracer for clinical translation. In this report, data pertaining to the synthesis and quality assurance of [89Zr]keytruda is presented; for the other tracer, [64Cu]keytruda, quality assurance data is summarized in a table (Supplemental Table 1).
Synthesis of the immunoPET pre-cursor (Df/DOTA-keytruda)
Keytruda is a fully humanized IgG4 antibody against human PD-1 receptor protein approved by the FDA (September, 2014) for the treatment of unresectable or metastatic melanoma [22, 44]. The immunoPET pre-cursor (Df-keytruda) was prepared by covalently coupling Df-Bz-NCS (Df) to the lysine groups of keytruda at pH 8.0. Precursor synthesis was performed in three different conditions (in duplicate) by addition of 2.5, 5 and 7.5 molar excess of Df to keytruda, incubated at 37°C for 60 min, at pH 8.0. The reaction products were purified by SEC-2000 HPLC and tested for chelate per antibody (c/a) by mass spectrometry. The best immunoconjugation was achieved at 7.5 molar excess of Df to keytruda, resulting in a reproducible Df/keytruda ratio of 1.1 ± 0.2, (mean ± SD, n=3) Df per antibody, confirmed by the MALDI-TOF (Fig. 1A, and Supplemental Fig. 1 MALDI spectrum). The Df-keytruda (filled bar) was tested for its binding ability using hPD-1 expressing 293-T cells, which exhibit specific binding towards the hPD-1 protein, when compared to the naïve 293T cells (open bar) Supplemental Fig. S2, FACS histogram. The data pertaining to DOTA-keytruda, and quality assurance of [64Cu]keytruda is given in the Supplemental data as Table 1.
Fig. 1.
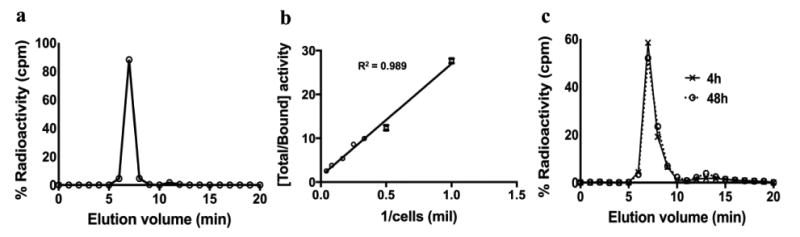
Radio-HPLC, immunoreactivity, and serum stability tests show that the purity and binding affinity of the [89Zr]keytruda tracer was good. (a) Radio-HPLC trace shows >95% purity. (b) Immunoreactivity of the [89Zr]keytruda was tested against the human PD-1 expressing 293T cells (mean ± SD: 74.3 ± 6.2). (c) Tracer in human serum shows > 85% stability for up to 48h.
Synthesis and Quality Assurance of the immunoPET tracer
Table 1 shows the overall quality assurance of the [89Zr]keytruda PET tracer. Radiolabeling of Df-keytruda in 0.1 M sodium acetate (pH 5.5) mixed with [89Zr] in 0.5 M HEPES (pH 7.0–7.5) buffer yielded >60% after purification. Figure 1a, the Radio-HPLC analysis confirmed that the immunoPET tracer purity is > 98 % (mean ± SD: 98.0 ± 1.8%) monomeric antibody with specific activity of 0.22 ± 0.07 MBq/μg. Figure 1b, shows the binding fraction of the [89Zr]keytruda tracer tested on human PD-1 expressing 293T cells was 74 ± 2.3%. The radiochemical stability in normal human serum was >85% tested for up to 48 hours (Fig. 1c). Overall, these assays confirmed that the immunoPET tracer was high quality and good enough to target specifically to human PD-1 receptor. Similarly, [64Cu]keytruda showed >95% purity and 72 ± 1.4% (mean ± SD) immunoreactivity (Supplemental Table 1).
Table 1. The table shows the overall tracer characterization results of the [89Zr]keytruda.
| Tracer Specification | Results |
|---|---|
| Df-Keytruda | ∼ 1 c/a |
| Radiochemistry Yield | >60% |
| Purity HPLC | >95% |
| TLC | >95% |
| Specific activity | 222 MBq/mg |
| Immunoreactivity | 74% |
Humanized NSG mouse model
NSG mice are well known for the engraftment of human hematopoietic stem cells (HSC) or human PBMC (hPBMC) to create humanized mouse models to test drugs [45-48]. Figure 2a shows the quality control of the hPBMC used to create hNSG mice. The assay was performed for the measurement of the human CD45+ cells in hPBMC and the results indicated >95% of the cells were human CD45 +. Figure 2b, demonstrating the percent of human PD-1+ cells in hPBMC stained by keytruda, biotin-anti-human Fc secondary antibody and followed by Streptavidin-APC. The left panel is unstained hPBMC (control), and the right panel is stained for anti-human PD-1, which shows that 17 percent of cells were human PD-1+. This assay illustrated the binding ability of keytruda against human PD-1 in hPBMC, which is used for the engraftment of NSG mice. After hPBMC engraftment, mice were further tested for the presence of hPBMC by analyzing the presence of human CD45+ cells in the hNSG mouse blood pool. FACS data clearly indicated the successful engraftment of hPBMC in all hNSG mice, whereas the control NSG mouse group showed no human CD45+ cells in the blood (Fig. 2c).
Fig. 2.
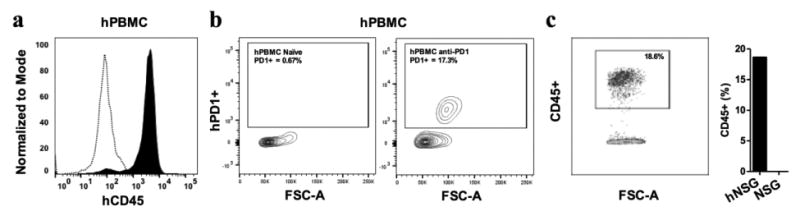
FACS analysis of in vitro hPBMC and ex vivo humanized NSG mouse blood shows the engraftment of hPBMC in NSG mice is successful. (a) Representative FACS image shows purity of human PBMC prior to engraftment in NSG mice. Compared to the unstained control hPBMC (open bars), hPBMC stained with anti-huCD45 antibody (filled bars) shows the expression of hCD45+ is >90%. (b) Representative FACS scattered plot shows the measurement of hPD-1 receptor expression in hPBMC. Left scatter image is unstained control, and right image is stained by an anti-human-PD-1 antibody (17% hPD-1+). (c) The FACS scatter plot shows the presence of huCD45+ hPBMC was 19%, when compared to the control NSG mouse blood.
Small animal PET and CT imaging
[89Zr]keytruda immunoPET imaging
Representative coronal immunoPET images of mice bearing melanoma using the [89Zr]keytruda tracer at various time points are shown in Figure 3. ImmunoPET scans were performed at various time points (1- 144 hours) post injection of 3 - 4 MBq of [89Zr] keytruda (18-20 μg of Df-keytruda). PET images were co-registered with CT to demarcate and visualize the mouse organs. Figure 3, representative PET-CT images (scanned at 24, 72 and 144 hours) indicate that immunoPET tracer binds to human TILs that are homing into the tumor and spleen, compared with the control NSG mice. PET signal appearing at the mouse organs is associated with tracer that specifically binds to human-PD-1 protein expressed on human lymphocytes. However, the PET signal arising from the liver could be non-specific due to slow clearance of the immunoPET tracer. To obtain immunoPET tracer clearance over the period of time, PET scans were performed at various time points for up to 144 hours after tracer injection. Figure 3b, shows that the spleen uptake (ROI mean %ID/g ± SD) by NSG-ctl and hNSG-nblk mice are 11.86 ± 1.27, 13.16 ± 0.7 for 4h, and 12.94 ± 2.13, 16.43 ± 1.42 for 24h, respectively (P = 0.01 and 0.01 for 4 and 24 h respectively). Figure 3c, indicates that the tumor to muscle ratio of [89Zr]keytruda uptake by NSG-ctl and hNSG-nblk mice are 18.9 ± 3.8, and 34.8 ± 2.9 for 4h (P = 0.0004) and at 24h the uptake ratio increased to 20.3 ± 4.6 and 35.0 ± 2.5 (P = 0.002). Figure 4, shows the ROI quantification (mean ± SD), (Fig. 4a: heart and liver); (Fig. 4b: spleen and tumor) results performed on organs of interest of PET-CT images (Fig. 3A) at various points. At 24h the tracer uptake by non-specific organs such as heart and liver of hNSG mice were 0.86 ± 0.15 and 2.5 ± 0.28, respectively and dropped to 0.37 ± 0.08 and 1.84 ± 0.27, respectively at 144h (Fig. 4a). In Figure 4B, ROI of immunoPET shows that the PET signal obtained from the spleen and tumor was due to humanPD-1 that binds to lymphocytes homing into the organs. The maximum uptake observed was at 24 h by the spleen of hNSG (16.4 ± 1.4 %) and control NSG (12.9 ± 2.1 %). However, the tumor uptake by hNSG (3.8 ± 0.4 %) was high compared to the control NSG (2.9 ± 0.9 %). As was expected, the human PD-1 tracer homed well into the tumor and spleen of melanoma xenografts.
Fig. 3.
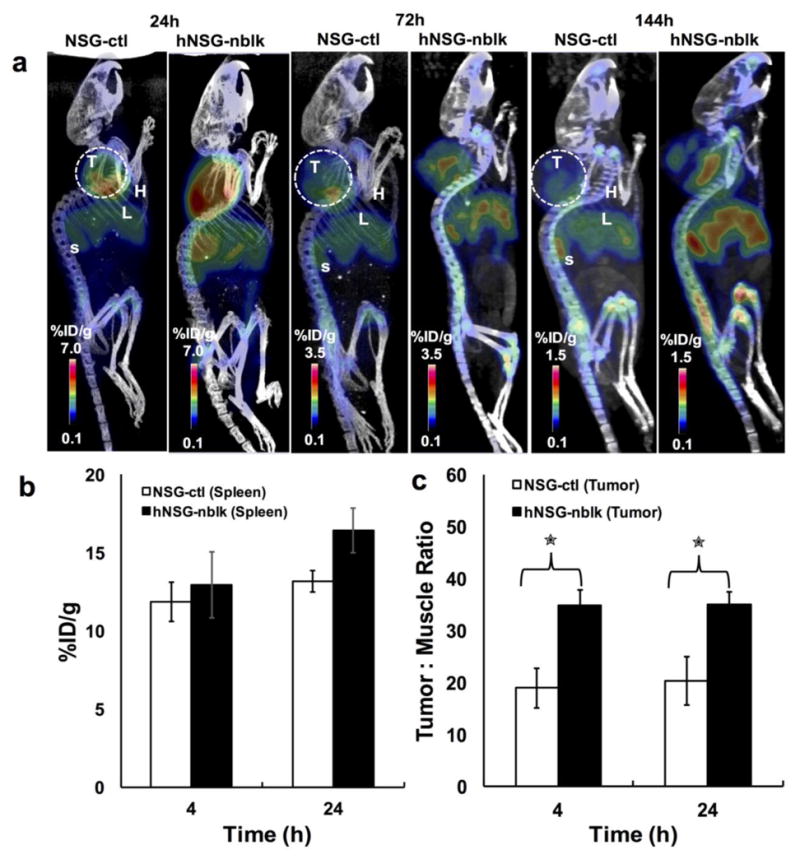
Small animal PET-CT imaging of hPD-1 with [89Zr]keytruda; imaging was performed after PMBC engraftment on NSG (A) Representative PET-CT images at 24, 72, and 144 h post-injection of [89Zr]keytruda (3.2 MBq/16 μg/200 μL) in NSG (control) and hNSG mice bearing A375 melanoma. L, liver; H, Heart; T, tumor; S, Spleen. (B) ROI quantification of immunoPET tracer homing (mean %ID/g ± SD) into spleen of control NSG (NSG-ctl) (n=4) and hNSG-nblk (non-blocking) (n = 4), after 4 and 24 h post-injection. *P < 0.05, **P < 0.01. (C) Tumor to muscle background ratios were computed from ROI at 4 and 24 hours. NSG and hNSG mice were also compared. The tumor-to-muscle ratio (TMR) of hNSG was significantly higher than NSG control mice (p =0.001).
Fig. 4.
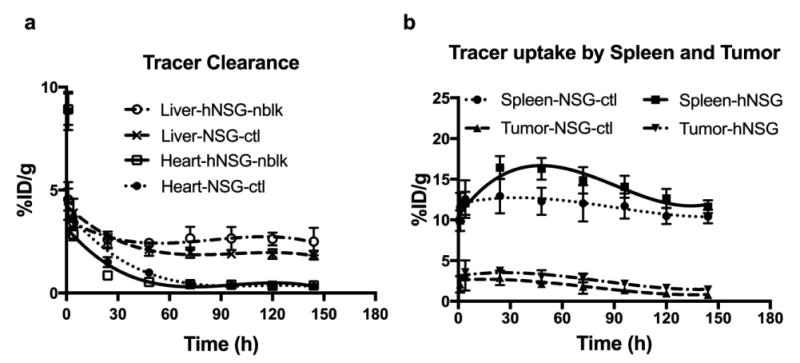
ImmunoPET tracer clearance (a) and uptake (b) profile of NSG and hNSG mice. [89Zr]keytruda tracer signals in tumor, spleen and clearance organs of mice were quantified as ROIs from images in Fig. 3. Regions of interest were drawn around the liver, kidney, spleen, and tumor. The PET signal of each of the organs from NSG and hNSG mice are computed as mean %ID/g ± SD at each time point over 1 - 144 hours post-injection. Data are partial volume and decay corrected.
[64Cu]keytruda immunoPET imaging
Representative coronal immunoPET images of mice bearing melanoma using the [64Cu]keytruda tracers at various time points are shown in Figure 5a. [64Cu]keytruda immunoPET scans were performed at various time points (1- 48 hours) post injection of 7 - 8 MBq of [64Cu]keytruda (20-22 μg of DOTA-keytruda). Figure 5A, representative PET-CT images (scanned at 4, and 24 hours) indicate that immunoPET tracer homing into the tumor of hNSG-nblk mice increased compared with the NSG-ctl, and hNSG-blk mice. Figure 5b, clearance profile of the tracer from heart and liver, shows that the tracer presence was reduced as early as at 24h. At this time point the ROI mean %ID/g ± SD by NSG-ctl, hNSG-blk, and hNSG-nblk mice are 2.8 ± 0.7, 3.1 ± 0.5 and 3.6 ± 0.5, respectively for heart; 3.4 ± 0.6, 4.6 ± 0.6 and 5.6 ± 0.8, respectively for liver; and the tumor uptake was 2.5 ± 1.1, 4.4 ± 1.3 and 6.4 ± 0.7, respectively.
Fig. 5.
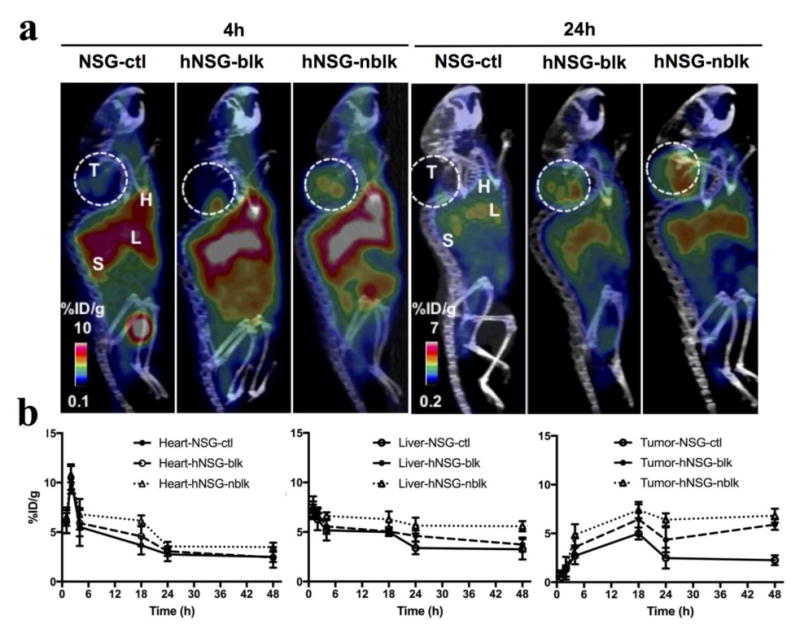
Small animal PET-CT imaging of hPD-1 with [64Cu]keytruda. (a) Representative PET-CT images at 4 and 24 h post-injection of [64Cu]keytruda(7.4MBq / 200 μL) in NSG-ctl, hNSG-blk, and hNSG-nblk mice bearing A375 melanoma. L, liver; H, Heart; T, tumor; S, Spleen. (b) [64Cu]keytruda tracer signals were quantified as ROIs from clearance organs such as the Heart, Liver, and tracer uptake in tumor of mice from images in Fig. 5A. ROIs were drawn around the heart, liver, and tumor. The PET signals of each of the organs from mice are computed as mean %ID/g ± SD at each time point over 1 - 48 hours post-injection. Data are partial volume and decay corrected.
In Figure S3A, ROI of [64Cu]keytruda immunoPET shows the PET signal obtained from the spleen. The tracer uptake by NSG-ctl, and hNSG-blk and hNSG-nblk mice was 9.4 ± 2.6, 11.8 ± 2.1 and 13.7 ± 2.1 for 4 h and 9.7 ± 1.9, 11.1 ± 1.5 and 17.5 ± 2.1 for 24 h, respectively. The maximum uptake observed was at 24 h by the spleen of hNSG-nblk (17.5 ± 2.1%). Figure S3b, indicates that the tumor to muscle ratio of tracer uptake by NSG-ctl, hNSG-blk and hNSG-nblk mice are 5.7 ± 1.4, 19.9 ± 4.5, and 28.5 ± 6.6 for 4h (ctl verses nblk: P = 0.002) and at 24h the uptake ratio increased to 7.5 ± 3.7 and 29.9± 1.7, 48 ± 8.7(ctl verses nblk: P = 0.002).
This was further confirmed by scanning the ex vivo organs by PET-CT (Fig. S4). Figure S4, illustrates the PET-CT coronal image of a humanized NSG mouse (Fig S4a, left panel), and the right panel shows the ex vivo organs of the same mouse harvested after 144 h post scanning. The Figure S4b-c shows the individual tissues of various organs' uptake specifically blood, heart, lungs, liver, spleen, kidney, muscle, bone and tumor on CT and PET-CT respectively. From these images it is evident that [89Zr]keytruda tracer specifically targeted to human PD-1 that is associated with lymphoid organs. Figure S4, clearly shows that the tracer uptake by spleen and tumor are due to human TILs homing into these organs.
Biodistribution studies of tumor-bearing hNSG and control NSG mice
The biodistribution results of both [89Zr]keytruda (144h p.i.; Fig 6a) and [64Cu]keytruda (48h p.i.; Fig 6b) tracers are presented in Figure 6. [89Zr]keytruda tracer biodistribution was studied in NSG-ctl and hNSG-nblk mice groups. Whereas, [64Cu]keytruda was studied in three groups of mice: NSG-ctl, hNSG-blk, and hNSG-nblk after 48h post injection. These data are correlated to the PET ROI quantification results in Figure 4, and 5b. The immunoPET uptake ([89Zr]keytruda, Fig. 6a) by tumor in NSG-ctl and hNSG-nblk mice was (mean % ID/g ± SD) 1.8 ± 0.4 and 3.2 ± 0.7, respectively. After 144h BioD, tumor to muscle ratio of the tracer was shown as ∼15 and 45 for hNSG-ctl and NSG-nblk, respectively. The tracer uptake (mean %ID/g ± SD) of hNSG-nblk, in clearance organs such as liver and kidney are 4.6 ± 2.1 and 1.6 ± 0.2 at 144 h. The [64Cu]keytruda tracer uptake by tumor in hNSG-nblk, hNSG-blk, and NSG-ctl mice was (mean % ID/g ± SD) 9.4 ± 2.5, 5.9 ± 2.1 and 5.7 ± 0.6 respectively. The tracer uptake (mean %ID/g ± SD) of hNSG-nblk, in clearance organs such as liver and kidney are 7.9 ± 1.6 and 4.9 ± 0.9 at 48 h. After 48h BioD (Fig. 6B) the tumor-to-muscle ratio of hNSG-nblk was 12.3 and the NSG-ctl was 5.4.
Fig. 6.
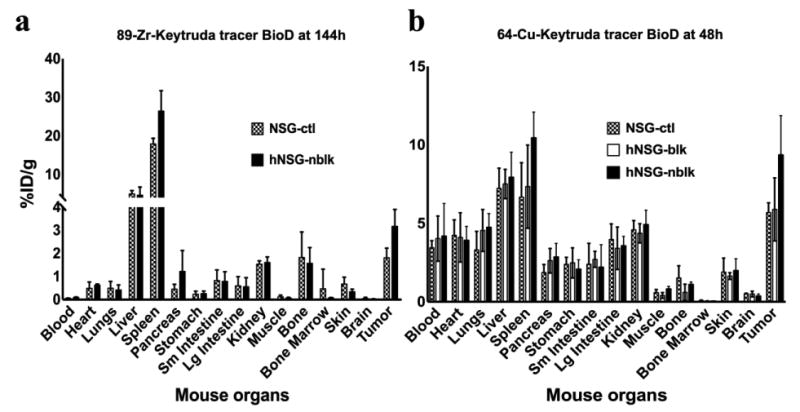
Biodistribution profiles of immunoPET tracers in NSG and hNSG mice (n=4). After PET-CT scans, 144h post injection of [89Zr]keytruda (Fig. 6a; NSG-ctl, and hNSG-nblk) and 48h post injection of [64Cu]keytruda(Fig. 6b; NSG-ctl, hNSG-blk, and NSG-nblk) mice were euthanized and dissected for biodistribution analysis. Each mouse organ was washed in PBS and measured in a gamma counter for counts per minute. Tracer uptake in each of the tissues presented in the figure was computed as mean %ID/g ± SD (decay corrected).
Discussion
Targeting immune checkpoints for cancer therapy is showing clinical success with durable responses and long-term survival in some patients for greater than 10 years [2, 49]. The FDA has already approved several immune checkpoint blockade therapeutics including Pembrolizumab (anti-PD-1 IgG4 by Merck), Nivolumab (anti-PD-1 human IgG4 mAb by Bristol-Myers Squibb), and Atezolizumab (anti-PD-L1 human IgG mAb, MPDL3280A, by Roche) [11]. Other immune checkpoint associated pathways are also under current investigation (e.g., TIM-3, BTLA, and VISTA). Taken together, all of these studies show that blocking immune checkpoint receptors or ligand pathways enhances effector T-cell function in the tumor microenvironment [8, 30]. That said, it is still unclear whether the blockade of a single immune checkpoint is sufficient to drive anti-tumor immunity, or if combinatorial strategies will have to be employed in most cases. While the complex mechanisms governing anti-tumor immunity are still not largely understood, homing of cytotoxic TILs into the tumor interstitium is very much needed for patients to respond to immune checkpoint blockade therapy, and thus these TILs could potentially serve as a predictive biomarker.
The ability to measure activated tumor infiltrating lymphocytes (TILs) in the tumor microenvironment could provide valuable information for selecting which patients would respond to immune check point blockade therapy. It is possible to measure activated TILs directly by cell surface protein markers such as the PD-1 receptor. Presently, PD-1 is measured by an invasive biopsy method and followed by immunohistochemistry (IHC) on the biopsy specimens [8, 30]. It is well known that IHC has serious limitations such as inadequate sampling of the highly heterogeneous primary tumor, and lack of information about expression profiles of metastatic lesions. Also IHC cannot be performed for solid tumors that are inaccessible to biopsy. Alternatively, noninvasive PET imaging could provide a better tool for in vivo imaging of PD-1 checkpoint receptor expression, and it is applicable for dynamic monitoring and overall therapy evaluation. Hence, our goal is to develop a novel tracer to image and quantitatively measure the PD-1 TILs in the tumor microenvironment.
Furthermore, many recent studies have indicated that PD-1 is a sensitive marker in the detection of angioimmunoblastic T-cell lymphoma (AITL) and peripheral T-cell lymphoma (PTCLU) [50]. These study results demonstrated that PD-1 staining is a highly sensitive marker in the diagnosis of peripheral T-cell lymphomas. For example, increased extrafollicular PD-1-positive cells were seen in 93% (76/82) of AITL, 62% (16/26) of PTCLU, and 11% (2/18) of ALK-negative anaplastic large cell lymphomas. Thus our anti-PD-1 immunoPET tracer could also be readily applicable to image T-cell lymphoma patients. In fact while we were developing this tracer, England et al. [51] developed a similar tracer and tested it on hNSG mice but without a xenografted tumor. In contrast, we used a hNSG mouse model xenografted with a human melanoma tumor, and in addition we used two different tracers ([89Zr]keytruda and [64Cu]keytruda) for immunoPET imaging, to measure the amount of TILs homing into the tumor. Further, we administered both tracers with high specific activity, with lower dose regimen per mouse to avoid higher uptake in non-specific organs e.g., liver.
In a previous proof-of-concept study, we developed a radiotracer for mouse PD-1 immunoPET, and demonstrated its ability to measure and image TILs in a melanoma xenograft model [52]. These results encouraged us to further develop a human PD-1 targeting PET tracer for clinical translation. In this report we have shown the development and characterization of an anti-human-PD-1 immunoPET tracer and performed pre-clinical imaging on a preclinical model of humanized mice bearing melanoma xenografts. Table 1, and Fig. 1 indicates the quality assessment of the [89Zr]keytruda immunoPET tracer ([64Cu]keytruda data in Supplemental Table 1) designed to target human PD-1 using the clinically approved keytruda mAb. These novel immunoconjugates yielded 1-2 Df or DOTA chelates per antibody and provided greater than 95% radiochemical purity and high specific activity. The immunoreactivity of the immunoconjugate and immunoPET tracer was >70% (Fig. 1b and S2) as evaluated by an in vitro live cell binding assay. We are further optimizing the immunoconjugate to enhance the immunoreactivity to reach greater than 80% for clinical grade preparation.
A FACS study showed, that Df-keytruda has high specificity towards hPD-1, when compared to the naïve control that was not induced to express hPD-1 (Fig. S2). The radiolabeled keytruda was then tested on hPD-1 expressing 293T cells, which indicated that the radiolabeling did not significantly affect the binding ability of the antibody towards the target (74%, Fig 1b). Immunoreactivity for [64Cu]keytruda was also performed and it showed 72% (Supplemental Table 1).
For pre-clinical studies a humanized NSG mouse model was created, and characterized for the engraftment of human PBMC by drawing blood from the mouse, and tested for the expression of human CD45 and PD-1 by FACS (Fig. 2). These results indicated successful engraftment of hPBMCs in NSG mice. After administration of the radiotracer in the humanized NSG mouse, the PET image clearly showed the novel immunoPET tracer targeting specifically the human PD-1 expressing TILs that had homed to the tumor and spleen (Figs. 3-5). The hNSG-nblk mouse image at 24h, corresponding to the [89Zr]keytruda tracer demonstrated increased immunoPET signal in both the tumor and spleen (mean %ID/g: 4 and 16, respectively; Figs. 3-4) as compared to NSG-ctl mice (mean %ID/g: 2.9 and 13, respectively), which were not engrafted with human PBMCs. The PET signal from hNSG mice was further analyzed by ex vivo organ imaging (Fig. S4) as well as by a BioD study (Fig. 6a).
Figure 5 demonstrates immunoPET images (at 4 and 24h) of the [64Cu]keytruda. These images clearly indicate, that this tracer targets specifically hPD-1 expressing TILs that are homing into the tumor of hNSG-nblk mice (6.4 ± 0.7 %ID/g), which exhibit high uptake when compared to the NSG-ctl (2.1 ± 0.5) and NSG-blk (4.4 ± 1.3) mice at 24h. Tumor to muscle ratios (at 24h) of this tracer show (Fig. S3-b) 7.5 ± 3.6, 29.9 ± 1.7, and 48 ± 8.7 corresponding to NSG-ctl, NSG-blk, and NSG-nblk mice, respectively. Biodistribution at 48h, indicated tumor to muscle ratios of 5.4 ± 1.6, 6.2 ± 1.8, and 12.3 ± 2.2 corresponding to NSG-ctl, NSG-blk, and NSG-nblk mice, respectively. Overall, the PET signal from the tumors corresponding to [89Zr]keytruda and [64Cu]keytruda tracers is high enough to measure in vivo, and well delineated from other background tissue, illustrating both their high sensitivity and specificity.
For both tracers, the PET signal in the spleen is due to the spleen's role in priming T cells before deploying them throughout the body for antigen surveillance and attack. The clearance organs, such as liver and kidney, of the three groups of mice (NSG-ctl, hNSG-blk, and hNSG-nblk), at 24h, show almost similar signal intensity (3 - 5 %ID/g). With respect to muscle, at 24h, NSG-ctl, hNSG-blk, and hNSG-nblk mice groups exhibited insignificant PET signal (<0.5 %ID/g). In this study, to some extent we have correlated hPD-1 expression levels to the PET signal. However, further studies will be needed to better understand the dynamics of T cell engraftment in the humanized mouse model. In summary, we performed labeling of keytruda with two different isotopes ([64Cu] and [89Zr]; half-life =12.7h, 78.4h respectively), to optimize and select the appropriate tracer for clinical imaging of patients. Tumor to muscle ratio data indicated at 24h that both tracers provide sufficient measurable PET signal to identify tumor delineated from other background tissues.
Conclusions
Our study results show that the novel tracers bind in vivo to hPD-1 expressing TILs that have engrafted and homed in the tumor and spleen of our humanized NSG mouse model. Overall, the ease of production, high sensitivity and specificity of our novel keytruda immunoPET tracers illustrates their feasibility of human translation for imaging in vivo cytotoxic PD-1 T cells. We believe these novel tracers have the potential to screen for patients most likely to respond to immune checkpoint blockade therapy, as well as monitor their responses, and together these factors will help to greatly enhance patient management and therapeutic outcomes. In summary, our study indicated that both tracers ([64Cu]keytruda and [89Zr]keytruda) exhibited comparable PET signal with tumor-to-muscle ratio corresponding to hPD-1 expressing TILS in tumor at the 24h time point. However, due to the cost and availability of the isotopes being important factors for clinical translation, the [64Cu]keytruda tracer is the better choice for clinical study.
Supplementary Material
Acknowledgments
We would like to thank The Canary Foundation, The Ben and Catherine Ivy Foundation, and the National Cancer Institute for their support and for helping to fund this research. We acknowledge the support of Drs. Mark Stolowitz, Timothy Doyle, Frezghi Habte, and Lingyun Xu; Sindhuja Ramakrishnan, and Michelle Tran for the experiments performed. MicroPET/CT imaging and Gamma Counter measurements were performed in the SCi3 Stanford Small Animal Imaging Service Center.
Footnotes
Conflict of interest: No potential conflicts of interest relevant to this article were reported
Supporting information: MALDI data for the conjugation of Df to keytruda antibody, live cell binding assay of keytruda and Df-keytruda by FACS, ROI quantification of [64Cu]keytruda tracer homing into hNSG mice spleen and tumor, representative PET-CT images of hNSG mice and its ex vivo organs.
References
- 1.Gentzler R, Hall R, Kunk PR, et al. Beyond melanoma: inhibiting the PD-1/PD L1 pathway in solid tumors. Immunotherapy. 2016;8(5):583–600. doi: 10.2217/imt-2015-0029. [DOI] [PubMed] [Google Scholar]
- 2.Sharma P, Allison JP. The future of immune checkpoint therapy. Science. 2015;348(6230):56–61. doi: 10.1126/science.aaa8172. [DOI] [PubMed] [Google Scholar]
- 3.Topalian SL, Hodi FS, Brahmer JR, et al. Safety, activity, and immune correlates of anti-PD-1 antibody in cancer. N Engl J Med. 2012;366(26):2443–2454. doi: 10.1056/NEJMoa1200690. [DOI] [PMC free article] [PubMed] [Google Scholar]
- 4.Hodi FS, O'Day SJ, McDermott DF, et al. Improved survival with ipilimumab in patients with metastatic melanoma. N Engl J Med. 2010;363(8):711–723. doi: 10.1056/NEJMoa1003466. [DOI] [PMC free article] [PubMed] [Google Scholar]
- 5.Robert C, Thomas L, Bondarenko I, et al. Ipilimumab plus dacarbazine for previously untreated metastatic melanoma. N Engl J Med. 2011;364(26):2517–2526. doi: 10.1056/NEJMoa1104621. [DOI] [PubMed] [Google Scholar]
- 6.Yun S, Vincelette ND, Green MR, et al. Targeting immune checkpoints in unresectable metastatic cutaneous melanoma: a systematic review and meta-analysis of anti-CTLA-4 and anti-PD-1 agents trials. Cancer Medicine. 2016;5(7):1481–1491. doi: 10.1002/cam4.732. [DOI] [PMC free article] [PubMed] [Google Scholar]
- 7.Wolchok JD, Kluger H, Callahan MK, et al. Nivolumab plus ipilimumab in advanced melanoma. N Engl J Med. 2013;369(2):122–133. doi: 10.1056/NEJMoa1302369. [DOI] [PMC free article] [PubMed] [Google Scholar]
- 8.Berghoff AS, Ricken G, Widhalm G, et al. PD1 (CD279) and PD-L1 (CD274, B7H1) expression in primary central nervous system lymphomas (PCNSL) Clin Neuropathol. 2014;33(1):42–49. doi: 10.5414/np300698. [DOI] [PubMed] [Google Scholar]
- 9.Brown JA, Dorfman DM, Ma FR, et al. Blockade of programmed death-1 ligands on dendritic cells enhances T cell activation and cytokine production. J Immunol. 2003;170(3):1257–1266. doi: 10.4049/jimmunol.170.3.1257. [DOI] [PubMed] [Google Scholar]
- 10.Franceschini D, Paroli M, Francavilla V, et al. PD-L1 negatively regulates CD4+CD25+Foxp3+ Tregs by limiting STAT-5 phosphorylation in patients chronically infected with HCV. J Clin Invest. 2009;119(3):551–564. doi: 10.1172/JCI36604. [DOI] [PMC free article] [PubMed] [Google Scholar]
- 11.Hamid O, Robert C, Daud A, et al. Safety and tumor responses with lambrolizumab (anti-PD-1) in melanoma. N Engl J Med. 2013;369(2):134–144. doi: 10.1056/NEJMoa1305133. [DOI] [PMC free article] [PubMed] [Google Scholar]
- 12.Mamalis A, Garcha M, Jagdeo J. Targeting the PD-1 pathway: a promising future for the treatment of melanoma. Arch Dermatol Res. 2014;306(6):511–519. doi: 10.1007/s00403-014-1457-7. [DOI] [PMC free article] [PubMed] [Google Scholar]
- 13.Drake CG, Jaffee E, Pardoll DM. Mechanisms of immune evasion by tumors. Adv Immunol. 2006;90:51–81. doi: 10.1016/S0065-2776(06)90002-9. [DOI] [PubMed] [Google Scholar]
- 14.Fridman WH, Pages F, Sautes-Fridman C, et al. The immune contexture in human tumours: impact on clinical outcome. Nat Rev Cancer. 2012;12(4):298–306. doi: 10.1038/nrc3245. [DOI] [PubMed] [Google Scholar]
- 15.Mellman I, Coukos G, Dranoff G. Cancer immunotherapy comes of age. Nature. 2011;480(7378):480–489. doi: 10.1038/nature10673. [DOI] [PMC free article] [PubMed] [Google Scholar]
- 16.Agata Y, Kawasaki A, Nishimura H, et al. Expression of the PD-1 antigen on the surface of stimulated mouse T and B lymphocytes. Int Immunol. 1996;8(5):765–772. doi: 10.1093/intimm/8.5.765. [DOI] [PubMed] [Google Scholar]
- 17.Mullard A. New checkpoint inhibitors ride the immunotherapy tsunami. Nat Rev Drug Discov. 2013;12(7):489–492. doi: 10.1038/nrd4066. [DOI] [PubMed] [Google Scholar]
- 18.Zou W, Chen L. Inhibitory B7-family molecules in the tumour microenvironment. Nature reviews Immunology. 2008;8:467–477. doi: 10.1038/nri2326. [DOI] [PubMed] [Google Scholar]
- 19.Rosenberg SA. Development of effective immunotherapy for the treatment of patients with cancer. J Am Coll Surg. 2004;198(5):685–696. doi: 10.1016/j.jamcollsurg.2004.01.025. [DOI] [PMC free article] [PubMed] [Google Scholar]
- 20.Ohaegbulam KC, Assal A, Lazar-Molnar E, et al. Human cancer immunotherapy with antibodies to the PD-1 and PD-L1 pathway. Trends Mol Med. 2015;21(1):24–33. doi: 10.1016/j.molmed.2014.10.009. [DOI] [PMC free article] [PubMed] [Google Scholar]
- 21.Topalian SL, Sznol M, McDermott DF, et al. Survival, durable tumor remission, and long-term safety in patients with advanced melanoma receiving nivolumab. J Clin Oncol. 2014;32(10):1020–1030. doi: 10.1200/JCO.2013.53.0105. [DOI] [PMC free article] [PubMed] [Google Scholar]
- 22.Robert C, Ribas A, Wolchok JD, et al. Anti-programmed-death-receptor-1 treatment with pembrolizumab in ipilimumab-refractory advanced melanoma: a randomised dose-comparison cohort of a phase 1 trial. Lancet. 2014;384(9948):1109–1117. doi: 10.1016/S0140-6736(14)60958-2. [DOI] [PubMed] [Google Scholar]
- 23.Kaufman HL, Kirkwood JM, Hodi FS, et al. The Society for Immunotherapy of Cancer consensus statement on tumour immunotherapy for the treatment of cutaneous melanoma. Nat Rev Clin Oncol. 2013;10(10):588–598. doi: 10.1038/nrclinonc.2013.153. [DOI] [PubMed] [Google Scholar]
- 24.Eisenhauer EA, Therasse P, Bogaerts J, et al. New response evaluation criteria in solid tumours: revised RECIST guideline (version 1.1) Eur J Cancer. 2009;45(2):228–247. doi: 10.1016/j.ejca.2008.10.026. [DOI] [PubMed] [Google Scholar]
- 25.Kurtz DM, Gambhir SS. Tracking cellular and immune therapies in cancer. Advances in cancer research. 2014;124:257–296. doi: 10.1016/B978-0-12-411638-2.00008-2. [DOI] [PubMed] [Google Scholar]
- 26.Ahmadzadeh M, Johnson LA, Heemskerk B, et al. Tumor antigen-specific CD8 T cells infiltrating the tumor express high levels of PD-1 and are functionally impaired. Blood. 2009;114(8):1537–1544. doi: 10.1182/blood-2008-12-195792. [DOI] [PMC free article] [PubMed] [Google Scholar]
- 27.Chapon M, Randriamampita C, Maubec E, et al. Progressive upregulation of PD-1 in primary and metastatic melanomas associated with blunted TCR signaling in infiltrating T lymphocytes. J Invest Dermatol. 2011;131(6):1300–1307. doi: 10.1038/jid.2011.30. [DOI] [PubMed] [Google Scholar]
- 28.French JD, Kotnis GR, Said S, et al. Programmed death-1+ T cells and regulatory T cells are enriched in tumor-involved lymph nodes and associated with aggressive features in papillary thyroid cancer. J Clin Endocrinol Metab. 2012;97(6):E934–943. doi: 10.1210/jc.2011-3428. [DOI] [PMC free article] [PubMed] [Google Scholar]
- 29.Lee CM, Tannock IF. The distribution of the therapeutic monoclonal antibodies cetuximab and trastuzumab within solid tumors. BMC Cancer. 2010;10:255. doi: 10.1186/1471-2407-10-255. [DOI] [PMC free article] [PubMed] [Google Scholar]
- 30.Matsuzaki J, Gnjatic S, Mhawech-Fauceglia P, et al. Tumor-infiltrating NY-ESO-1-specific CD8+ T cells are negatively regulated by LAG-3 and PD-1 in human ovarian cancer. Proc Natl Acad Sci U S A. 2010;107(17):7875–7880. doi: 10.1073/pnas.1003345107. [DOI] [PMC free article] [PubMed] [Google Scholar]
- 31.Muenst S, Soysal SD, Gao F, et al. The presence of programmed death 1 (PD-1)-positive tumor-infiltrating lymphocytes is associated with poor prognosis in human breast cancer. Breast Cancer Res Treat. 2013;139(3):667–676. doi: 10.1007/s10549-013-2581-3. [DOI] [PMC free article] [PubMed] [Google Scholar]
- 32.Scott AM, Wolchok JD, Old LJ. Antibody therapy of cancer. Nat Rev Cancer. 2012;12(4):278–287. doi: 10.1038/nrc3236. [DOI] [PubMed] [Google Scholar]
- 33.Sfanos KS, Bruno TC, Meeker AK, et al. Human prostate-infiltrating CD8+ T lymphocytes are oligoclonal and PD-1+ Prostate. 2009;69(15):1694–1703. doi: 10.1002/pros.21020. [DOI] [PMC free article] [PubMed] [Google Scholar]
- 34.Sun S, Fei X, Mao Y, et al. PD-1(+) immune cell infiltration inversely correlates with survival of operable breast cancer patients. Cancer Immunol Immunother. 2014;63(4):395–406. doi: 10.1007/s00262-014-1519-x. [DOI] [PMC free article] [PubMed] [Google Scholar]
- 35.Zhang Y, Huang S, Gong D, et al. Programmed death-1 upregulation is correlated with dysfunction of tumor-infiltrating CD8+ T lymphocytes in human non-small cell lung cancer. Cell Mol Immunol. 2010;7(5):389–395. doi: 10.1038/cmi.2010.28. [DOI] [PMC free article] [PubMed] [Google Scholar]
- 36.Shi F, Shi M, Zeng Z, et al. PD-1 and PD-L1 upregulation promotes CD8(+) T-cell apoptosis and postoperative recurrence in hepatocellular carcinoma patients. Int J Cancer. 2011;128(4):887–896. doi: 10.1002/ijc.25397. [DOI] [PubMed] [Google Scholar]
- 37.Taube JM, Klein A, Brahmer JR, et al. Association of PD-1, PD-1 ligands, and other features of the tumor immune microenvironment with response to anti-PD-1 therapy. Clin Cancer Res. 2014;20(19):5064–5074. doi: 10.1158/1078-0432.CCR-13-3271. [DOI] [PMC free article] [PubMed] [Google Scholar]
- 38.McDermott DF, Drake CG, Sznol M, et al. Survival, Durable Response, and Long-Term Safety in Patients With Previously Treated Advanced Renal Cell Carcinoma Receiving Nivolumab. J Clin Oncol. 2015;33(18):2013–2020. doi: 10.1200/JCO.2014.58.1041. [DOI] [PMC free article] [PubMed] [Google Scholar]
- 39.Natarajan A, Habte F, Gambhir SS. Development of a novel long-lived immunoPET tracer for monitoring lymphoma therapy in a humanized transgenic mouse model. Bioconjug Chem. 2012;23(6):1221–1229. doi: 10.1021/bc300039r. [DOI] [PMC free article] [PubMed] [Google Scholar]
- 40.Lindmo T, Boven E, Cuttitta F, et al. Determination of the immunoreactive fraction of radiolabeled monoclonal antibodies by linear extrapolation to binding at infinite antigen excess. J Immunol Methods. 1984;72(1):77–89. doi: 10.1016/0022-1759(84)90435-6. [DOI] [PubMed] [Google Scholar]
- 41.Natarajan A, Gambhir SS. Radiation Dosimetry Study of [(89)Zr]rituximab Tracer for Clinical Translation of B cell NHL Imaging using Positron Emission Tomography. Mol Imaging Biol. 2015;17(4):539–547. doi: 10.1007/s11307-014-0810-8. [DOI] [PMC free article] [PubMed] [Google Scholar]
- 42.Suffner J, Hochweller K, Kuhnle MC, et al. Dendritic cells support homeostatic expansion of Foxp3+ regulatory T cells in Foxp3.LuciDTR mice. J Immunol. 2010;184(4):1810–1820. doi: 10.4049/jimmunol.0902420. [DOI] [PubMed] [Google Scholar]
- 43.Natarajan A, Gambhir SS. Radiation Dosimetry Study of [Zr]rituximab Tracer for Clinical Translation of B cell NHL Imaging using Positron Emission Tomography. Mol Imaging Biol. 2014 doi: 10.1007/s11307-014-0810-8. [DOI] [PMC free article] [PubMed] [Google Scholar]
- 44.Khoja L, Butler MO, Kang SP, et al. Pembrolizumab. J Immunother Cancer. 2015;3:36. doi: 10.1186/s40425-015-0078-9. [DOI] [PMC free article] [PubMed] [Google Scholar]
- 45.Amadori A, Veronesi A, Coppola V, et al. The hu-PBL-SCID mouse in human lymphocyte function and lymphomagenesis studies: achievements and caveats. Semin Immunol. 1996;8(4):249–254. doi: 10.1006/smim.1996.0031. [DOI] [PubMed] [Google Scholar]
- 46.Greiner DL, Hesselton RA, Shultz LD. SCID mouse models of human stem cell engraftment. Stem Cells. 1998;16(3):166–177. doi: 10.1002/stem.160166. [DOI] [PubMed] [Google Scholar]
- 47.Legrand N, Weijer K, Spits H. Experimental models to study development and function of the human immune system in vivo. J Immunol. 2006;176(4):2053–2058. doi: 10.4049/jimmunol.176.4.2053. [DOI] [PubMed] [Google Scholar]
- 48.King M, Pearson T, Shultz LD, et al. A new Hu-PBL model for the study of human islet alloreactivity based on NOD-scid mice bearing a targeted mutation in the IL-2 receptor gamma chain gene. Clin Immunol. 2008;126(3):303–314. doi: 10.1016/j.clim.2007.11.001. [DOI] [PubMed] [Google Scholar]
- 49.Sharma P, Allison JP. Immune checkpoint targeting in cancer therapy: toward combination strategies with curative potential. Cell. 2015;161(2):205–214. doi: 10.1016/j.cell.2015.03.030. [DOI] [PMC free article] [PubMed] [Google Scholar]
- 50.Krishnan C, Warnke RA, Arber DA, et al. PD-1 expression in T-cell lymphomas and reactive lymphoid entities: potential overlap in staining patterns between lymphoma and viral lymphadenitis. Am J Surg Pathol. 2010;34(2):178–189. doi: 10.1097/PAS.0b013e3181cc7e79. [DOI] [PMC free article] [PubMed] [Google Scholar]
- 51.England CG, Ehlerding EB, Hernandez R, et al. Preclinical Pharmacokinetics and Biodistribution Studies of 89Zr-labeled Pembrolizumab. J Nucl Med. 2016 doi: 10.2967/jnumed.116.177857. [DOI] [PMC free article] [PubMed] [Google Scholar]
- 52.Natarajan A, Mayer AT, Xu L, et al. Novel Radiotracer for ImmunoPET Imaging of PD-1 Checkpoint Expression on Tumor Infiltrating Lymphocytes. Bioconjug Chem. 2015;26(10):2062–2069. doi: 10.1021/acs.bioconjchem.5b00318. [DOI] [PubMed] [Google Scholar]
Associated Data
This section collects any data citations, data availability statements, or supplementary materials included in this article.