

Abstract
Angptl4 (Angiopoietin-like 4) is a circulating protein secreted by white and brown adipose tissues and the liver. Structurally, Angptl4 contains an N-terminal coiled-coil domain (CCD) connected to a C-terminal fibrinogen-like domain (FLD) via a cleavable linker, and both full-length Angptl4 and its individual domains circulate in the bloodstream. Angptl4 inhibits extracellular lipoprotein lipase (LPL) activity and stimulates the lipolysis of triacylglycerol stored by adipocytes in the white adipose tissue (WAT). The former activity is furnished by the CCD, but the Angptl4 domain responsible for stimulating adipocyte lipolysis is unknown. We show here that the purified FLD of Angptl4 is sufficient to stimulate lipolysis in mouse primary adipocytes and that increasing circulating FLD levels in mice through adenovirus-mediated overexpression (Ad-FLD) not only induces WAT lipolysis in vivo but also reduces diet-induced obesity without affecting LPL activity. Intriguingly, reduced adiposity in Ad-FLD mice was associated with increased oxygen consumption, fat utilization, and the expression of thermogenic genes (Ucp1 and Ppargc1a) in subcutaneous WAT. Moreover, Ad-FLD mice exhibited increased glucose tolerance. Chronically enhancing WAT lipolysis could produce ectopic steatosis because of an overflow of lipids from the WAT to peripheral tissues; however, this did not occur when Ad-FLD mice were fed a high-fat diet. Rather, these mice had reductions in both circulating triacylglycerol levels and the mRNA levels of lipogenic genes in the liver and skeletal muscle. We conclude that separating the FLD from the CCD-mediated LPL-inhibitory activity of full-length Angptl4 reveals lipolytic and thermogenic properties with therapeutic relevance to obesity and diabetes.
Keywords: adipocyte, metabolic disease, metabolism, obesity, type 2 diabetes, angiopoietin-like, Energy expenditure
Introduction
Angptl4 (angiopoietin-like 4; also known as fasting-induced adipose factor, FIAF) is a circulating protein expressed in and secreted by white and brown adipose tissues (WAT and BAT, respectively)4 and the liver (1–4). Angptl4 is a part of the eight-member angiopoietin-like family of structurally related proteins, and the human ANGPTL4 gene is highly conserved among mammals, sharing a 77% amino acid sequence similarity with that of mice (3, 5). Structurally, Angptl4 contains an N-terminal coiled-coil domain (CCD) connected to a C-terminal fibrinogen-like domain (FLD) via a cleavable linker (3, 6). Both full-length and truncated forms of Angptl4 circulate in the bloodstream, and the processing of Angptl4 may be tissue-dependent: the liver secretes mainly truncated forms, whereas WAT secretes mainly the full-length form (7, 9). The expression of Angptl4 can be induced by several stimuli, including fasting, glucocorticoids, non-esterified fatty acids, thyroid hormone, and relative hypoxia (7, 9–12).
The CCD of Angptl4 is responsible for the ability of Angptl4 to inhibit lipoprotein lipase (LPL) (13, 14), the enzyme responsible for hydrolyzing circulating lipoprotein-associated triacylglycerol (TG) to produce free fatty acids (FFAs) for uptake by surrounding tissues. Adenoviral overexpression of full-length human ANGPTL4 in mice causes severe hypertriglyceridemia and hepatic steatosis, whereas mice lacking the gene encoding Angptl4 (Angptl4−/−) have much lower plasma and liver TG levels than WT controls (15). This hypolipidemic phenotype correlates with human genetic data supporting a key role for ANGPTL4 in maintaining plasma TG levels (16, 17).
Most notably, ∼3% of European Americans harbor a single nucleotide polymorphism in which the glutamic acid at position 40 of ANGPTL4, within the CCD, is replaced by a lysine (E40K), decreasing the ability of ANGPTL4 to inhibit LPL (16, 18, 19). Indeed, people expressing E40K have reduced plasma levels of TG and LDL cholesterol and elevated levels of HDL-cholesterol, although it is not associated with altered body mass index or adiposity.
The E40K mutation in ANGPTL4 was initially viewed as the human equivalent of Angptl4−/− mice; however, it is now known that ANGPTL4 is a bifunctional protein that stimulates adipocyte lipolysis in addition to inhibiting LPL activity (8, 20). However, the domain of ANGPTL4 responsible for stimulating adipocyte lipolysis is unknown. One possibility is that FLD might carry out this function.
Prior studies showed that FLD binds β1, β3, and β5 integrins (21–23); activates the integrin-dependent focal adhesion kinase-Src–p21–activated kinase 1 cascade required for keratinocyte migration (21); interacts with vitronectin and fibronectin to induce the activation of integrin-dependent focal adhesion kinase, 14-3-3 proteins, and PKC during wound healing (24); and stimulates NADPH oxidase-dependent O2˙̄ production to protect cancer cells from anoikis and apoptosis (23). By contrast, the role of FLD in metabolism has not been explored.
We showed that purified ANGPTL4 directly induces adipocyte lipolysis by increasing intracellular cAMP levels. Moreover, lipolysis induced by fasting or glucocorticoid treatment is reduced in Angptl4−/− mice (8). Here, we show that the FLD of Angptl4 alone stimulates adipocyte lipolysis through a mechanism structurally distinct from that by which Angptl4 inhibits LPL. We retained the pro-lipolytic activity of Angptl4 while eliminating its LPL-inhibitory activity by using adenoviral delivery to specifically increase circulating FLD levels in mice (Ad-FLD). Remarkably, doing so increases WAT lipolysis, lowers adiposity by increasing energy expenditure in conjunction with beige thermogenesis, prevents ectopic tissue steatosis, and improves glucose homeostasis under conditions of dietary excess.
Results
The FLD of Angptl4 is sufficient to stimulate adipocyte lipolysis
Prior studies showed that the CCD of Angptl4 can inhibit extracellular LPL activity (14). To determine whether the CCD is required to stimulate intracellular TG hydrolysis in adipocytes, we used adenovirus to express a FLAG-tagged mutant form of human ANGPTL4, which retains both the signal sequence needed for secretion and the intact FLD but which lacks amino acids 38–165 of the CCD (Ad-FLD), in the livers of adult mice (Fig. 1A). Controls included mice overexpressing either FLAG-tagged human full-length ANGPTL4 (Ad-ANGPTL4) or LacZ (Ad-LacZ) (Fig. 1B). Immunoblot analysis of plasma collected from mice 3 weeks after adenoviral injection (anti-FLAG) confirmed the presence of FLAG-tagged FLD or ANGPTL4 in the appropriate mice (the FLAG tag is located at the C terminus in each case). Notably, full-length ANGPTL4 is normally post-translationally cleaved into both CCD and FLD forms (7, 9), accounting for our seeing FLAG-detected proteins from the plasma of Ad-FLD and Ad-ANGPTL4 mice running at similar molecular weights (Fig. 1B). As expected, no signal was detected in the plasma of Ad-LacZ mice (Fig. 1B). Plasma TG levels were increased in Ad-ANGPTL4 mice (versus Ad-LacZ) but were not altered in Ad-FLD mice, consistent with the role of CCD in LPL inhibition (Fig. 1C). Plasma FFA levels, on the other hand, were markedly increased in both Ad-ANGPTL4 and Ad-FLD mice, suggesting that FLD alone is sufficient to promote WAT lipolysis (Fig. 1D).
Figure 1.

FLD exerts effects on lipid homeostasis, in vivo and in vitro, that are distinct from those of full-length Angptl4. A, graphical depiction of the Ad-ANGPTL4 and Ad-FLD constructs. B, top panel, schematic showing adenoviral strategy to generate Ad-ANGPTL4, Ad-FLD, and Ad-LacZ mice. Bottom panel, immunoblot using anti-FLAG M2 antibody (Sigma, 1:1000) and a corresponding ANTI-FLAG affinity gel showing increased FLD abundance in the plasma of both Ad-ANGPTL4 and Ad-FLD mice (blot was cropped). C and D, plasma TG (C) and (D) FFA measurements showing that Ad-ANGPTL4 mice fed a standard chow diet have increased levels of both TG and FFAs versus Ad-LacZ controls, whereas Ad-FLD mice have elevated FFA levels without concomitant hypertriglyceridemia (n = 5–6 mice/group for A–D; *, p < 0.05 versus Ad-LacZ). E and F, glycerol release (E) and intracellular cAMP (F) levels measured from primary mouse adipocytes treated for 1 h with purified ANGPTL4, FLD, or the E40K mutant form of ANGPTL4 showing that each stimulates adipocyte lipolysis with similar potency (n = 7 mice/group; *, p < 0.05 versus PBS-treated controls).
To directly test this, we treated isolated primary adipocytes with 20 nm of either purified ANGPTL4 or FLD for 1 h. Both ANGPTL4 and FLD treatments increased adipocyte glycerol release (Fig. 1E), indicating enhanced lipolysis. Seeing that FLD alone is sufficient to stimulate intracellular lipolysis by adipocytes led us to predict that this ability would be retained by the C-terminal E40K mutant form of ANGPTL4, which cannot properly inhibit LPL. Indeed, purified E40K ANGPTL4 also stimulated glycerol release from primary adipocytes (Fig. 1E). Moreover, ANGPTL4, FLD, and E40K treatment each significantly increased cAMP levels in adipocytes, supporting the concept that each stimulates a common pro-lipolytic pathway (Fig. 1F). Together, these findings demonstrate that the FLD of ANGPTL4 is sufficient to stimulate intracellular adipocyte lipolysis.
Ad-FLD mice are protected from diet-induced obesity (DIO)
Given the ability of FLD to stimulate adipocyte lipolysis, we used Ad-FLD and Ad-LacZ mice to determine whether increasing plasma FLD levels in mice would reduce adiposity. Immunoblot analysis of plasma collected from mice 10 days after adenoviral injection (anti-FLAG) confirmed the presence of FLAG-tagged FLD in the appropriate mice (Fig. 2A, left panel). No signal was detected in the plasma of Ad-LacZ mice (Fig. 2A, left panel). To estimate the plasma concentration of exogenous FLD expression in Ad-FLD mice, similar immunoblots were performed on 20.5 ng of purified FLAG-FLD protein run alongside 3 μl of plasma from Ad-FLD mice. By comparing the relative intensity of the bands produced by these immunoblots, we calculated that the plasma samples from Ad-FLD mice contained ∼2 ng/μl, or 61.5 nm, of FLAG-FLD (Fig. 2A, right panel). In accordance with this degree of FLD overexpression, Ad-FLD mice fed a HFD gained less weight than Ad-LacZ mice, with a divergence beginning after 1 week on the diet (Fig. 2B), despite having food intake similar to control (Fig. 2C).
Figure 2.

Increasing circulating levels of FLD in isolation limits DIO in mice. A, immunoblot (left panel) and quantification (right panel) of purified (20.5 ng) FLAG-FLD proteins and plasma samples (3 μl) from Ad-LacZ and Ad-FLD mice, using an anti-FLAG M2 antibody (Sigma, 1:1000). Plasma was isolated from both Ad-LacZ and Ad-FLD mice 10 days after infection. B and C, body weight curves (B) and average food intake values (C) for Ad-LacZ and Ad-FLD mice fed a HFD for 3 weeks. D, representative images showing the reduction in BAT, iWAT, and eWAT masses induced by FLD overexpression in the context of a HFD. E, quantification of C, as well as equivalent weight values for other tissues represented in percentage of body weight in Ad-LacZ and Ad-FLD mice fed HFD for 3 weeks. F, respective lean and fat masses represented in percentage of body weight in the mice mentioned above, as determined by DEXA, showing the specific reduction in fat mass seen in Ad-FLD mice fed a HFD for 3 weeks. In all cases, n = 6 mice/group; *, p < 0.05 versus Ad-LacZ.
Analyzing this protection against DIO revealed that Ad-FLD mice fed a HFD have a pervasive reduction in body fat that includes the inguinal and epididymal WAT (iWAT and eWAT) and BAT depots, which weighed 37, 46, and 36% less, respectively, than those from Ad-LacZ mice (Fig. 2, D and E). By contrast, hepatic, cardiac, and gastrocnemius muscle weights were similar between Ad-FLD and Ad-LacZ mice (Fig. 2E), indicating that increasing systemic FLD levels lowers body weight by specifically reducing adiposity. This specificity was confirmed by monitoring body composition (DEXA) 21 days after adenoviral injection; the lean mass of Ad-FLD mice was increased compared with Ad-LacZ controls, whereas the fat mass of Ad-FLD mice was reduced by 67% versus Ad-LacZ controls (Fig. 2F).
Given that Ad-FLD mice had elevated plasma FFA levels and unaffected plasma TG levels when fed a standard chow diet, we hypothesized that we would see a similar pattern of dyslipidemia when Ad-FLD and Ad-LacZ mice were fed a HFD. Indeed, plasma TG levels in the context of a HFD were not different between Ad-FLD and Ad-LacZ mice, consistent with the role of CCD in LPL inhibition (Fig. 3A). Moreover, plasma FFA levels were elevated in Ad-FLD mice fed a HFD, just as when the mice were fed a chow diet, further supporting that FLD alone is sufficient to promote WAT lipolysis (Fig. 3B).
Figure 3.

Increasing circulating levels of FLD reduces indicators of fat uptake, synthesis, and storage. A and B, measurements of plasma TG (A) and plasma FFA (B) concentrations showing that Ad-FLD mice fed a HFD have elevated FFA levels versus Ad-LacZ controls without concomitant hypertriglyceridemia (n = 4–5 mice/group; *, p < 0.05 versus Ad-LacZ). C, liver and skeletal muscle (gastrocnemius) TG content showing reduced values for Ad-FLD mice fed a HFD in both tissues (n = 6 mice/group; *, p < 0.05 versus Ad-LacZ). D, qPCR data showing markedly lower mRNA levels of genes involved in glycerolipid synthesis, FFA uptake, lipogenesis, and the transcriptional control of these processes, in the iWAT, eWAT, livers, and skeletal muscles (gastrocnemius) of Ad-FLD mice versus Ad-LacZ controls (n = 5–6 mice/group; *, p < 0.05 versus control).
We hypothesized that chronic, FLD-mediated WAT lipolysis enhances the flux of mobilized FFAs to ectopic tissues such as the liver and skeletal muscle, where they might be stored as TG, resulting in tissue steatosis. However, we found surprisingly that that the protection against DIO seen in the context of increasing systemic FLD levels occurred without inducing non-adipose tissue steatosis. Indeed, TG levels in the livers and skeletal muscle of Ad-FLD mice were 24 and 44% lower, respectively, than in Ad-LacZ mice (Fig. 3C).
One possible mechanism for the lack of steatosis in Ad-FLD mice fed a HFD is that these mice have enhanced fatty acid oxidation (FAO) in non-adipose tissues. However, the mRNA levels of genes involved in FAO were not different between genotypes (data not shown). Another possibility is that Ad-FLD mice fed a HFD have reduced TG synthesis, storage, or fat uptake in the liver and skeletal muscle. Examining this possibility revealed that the mRNA levels of genes encoding proteins involved in TG synthesis (e.g. Dgat2 (DGAT2), Lpin1 (Lipin-1), and Agpat2 (AGPAT2)), transcriptional control of lipogenesis (Srebf1 (SREBP-1c) and Mlxipl (ChREBP)), and fatty acid uptake and synthesis (Cd36 (FAT/CD36) and Fasn (FAS)) are on the whole markedly lower in the livers, gastrocnemius muscles, and the iWAT and eWAT of Ad-FLD mice versus Ad-LacZ controls (Fig. 3D). Thus, the potential impact of FLD-induced WAT lipolysis on hepatic and muscle steatosis may be offset by the transcriptional down-regulation of fat synthesis and storage programs in these tissues.
Ad-FLD mice have enhanced cold-inducible energy expenditure
Beyond linking increased adipocyte lipolysis with decreased adiposity in the WAT, we explored how Ad-FLD mice are protected from DIO more mechanistically. To do so, we fed singly housed Ad-FLD and Ad-LacZ mice a HFD for 21 days and then placed them into a comprehensive laboratory animal monitoring system (CLAMS) to perform indirect calorimetry. Ad-FLD mice fed a HFD had 9.9% higher oxygen consumption (VO2) and 8.3% higher carbon dioxide production (VCO2) during the dark period than did Ad-LacZ mice (Fig. 4, A–D). There were no differences in VO2 or VCO2 between groups during the light period. In accordance with these findings, the respiratory exchange ratios (RERs) of Ad-FLD mice fed a HFD were reduced versus control mice (Fig. 4E) and were present during both the light period (6.8% reduction) and the dark period (1.8% reduction). These results indicate that Ad-FLD mice rely more on fat to fuel metabolic processes than do control mice and correspond with the ability of FLD to induce WAT lipolysis and raise plasma FFA levels. Overall, these results strongly support the concept that increasing circulating FLD levels in mice augments energy expenditure and thus lowers adiposity by coordinately coupling enhanced WAT lipolysis to greater fat utilization.
Figure 4.

Increasing circulating levels of FLD in isolation enhances energy expenditure in mice fed a HFD. A, whole-body oxygen consumption (VO2) measured at 23 °C over a 24-h period in Ad-LacZ and Ad-FLD mice (n = 6 mice/group) fed a HFD for 3 weeks. B, average VO2 during the light and dark periods for the data in A. C, carbon dioxide production (VCO2) measured over 24 h from the mice in A. D, average VCO2 during light and dark periods for the data in C. E, RERs measured at 23 °C and during light and dark periods from the mice in A. *, p < 0.05 versus Ad-LacZ in all cases.
After establishing the ability of FLD to stimulate energy expenditure at room temperature (22–23 °C), which prior studies indicate is cold enough to stimulate reactive thermogenesis in mice (25), we examined Ad-FLD mice at thermoneutrality to eliminate any such thermogenic stress. Ad-FLD and Ad-LacZ mice fed a HFD for 21 days were placed into a CLAMS maintained at 30 °C, and indirect calorimetry was performed. Interestingly, measuring VO2 and VCO2 in this setting eliminated the excess energy expenditure that had been seen in Ad-FLD mice at room temperature (Fig. 5, A–D), indicating that FLD drives energy expenditure in mice by potentiating their non-shivering thermogenic response to cold. Notably, the temperature dependence of FLD-stimulated energy expenditure was not reflective of its impact on fuel utilization; RER was 5.3% lower in Ad-FLD (light period) even at thermoneutrality (Fig. 5E).
Figure 5.

Ad-FLD mice fed a HFD at thermoneutrality do not have enhanced energy expenditure. A, whole-body oxygen consumption (VO2) measured at 30 °C over a 24-h period in Ad-LacZ and Ad-FLD mice (n = 6 mice/group) fed a HFD for 3 weeks. B, average VO2 during the light and dark periods for the data in A. C, carbon dioxide production (VCO2) measured over 24 h from the mice in A. D, average VCO2 during light and dark periods for the data in C. E, RERs measured at 30 °C and during light and dark periods from the mice in A. *, p < 0.05 versus Ad-LacZ in all cases.
Increasing systemic FLD levels induces beige conversion in the WAT
To test whether the ability of FLD to enhance cold-inducible energy expenditure in Ad-FLD mice results from the activation of BAT or beige conversion within the iWAT, we isolated iWAT and BAT from Ad-LacZ and Ad-FLD mice fed a HFD for 3 weeks. Oxygen consumption, which we monitored in each of these tissues ex vivo, was increased 2.5-fold in the iWAT of Ad-FLD mice (Fig. 6A) but was similar in the BAT of Ad-LacZ and Ad-FLD mice (Fig. 6B). Similarly, the extracellular acidification rate (ECAR), indicative of glucose utilization, was 2.9-fold higher in the iWAT of Ad-FLD mice versus control (Fig. 6C) but was not altered in the BAT (Fig. 6D). Therefore, increasing systemic FLD levels enhances cellular respiration and increases glucose utilization specifically in the iWAT, highlighting the role of this specific fat depot in FLD stimulation of systematic energy expenditure.
Figure 6.

Increasing circulating levels of FLD in isolation induces beige/brown conversion in mice fed a HFD. A, OCR measured from iWAT samples taken from Ad-LacZ and Ad-FLD mice fed a HFD for 3 weeks. B–D, OCR measured from the BAT (B), ECAR measured from the iWAT (C), and ECAR measured from the BAT (D) of the same mice as in A. E, qPCR data showing markedly increased mRNA levels of thermogenic genes involved in the iWAT of Ad-FLD mice fed a HFD as in A. F, qPCR data showing markedly increased mRNA levels of Ucp1 (left panel) and representative immunoblots (right panel; blots are cropped) showing a sharp induction of Ucp1 (U6382; Sigma) in the iWAT of Ad-FLD mice versus Lac-Z mice fed a HFD as in A. GAPDH used as internal control (ab9483; Abcam) (n = 5–6 mice/group; *, p < 0.05 versus Ad-LacZ for all experiments).
We also monitored oxygen consumption rate (OCR) and ECAR in the iWAT and BAT of Ad-LacZ and Ad-FLD mice at thermoneutrality. Again, although OCR and ECAR remained elevated in the iWAT of Ad-FLD mice versus control, these elevations were greatly diminished (46% for OCR and 43% for ECAR) when compared with values taken at standard room temperature (Fig. 6, A and C). These data support the temperature-dependent nature by which increased systemic FLD levels stimulate energy utilization in the iWAT. Notably, whereas OCR values in the BAT were similar in Ad-FLD and Ad-LacZ mice whether the mice were housed at 23 or 30 °C, ECAR in the BAT of Ad-FLD mice fell by 34% in response to thermoneutrality (Fig. 6B and D).
Certain WAT depots contain so-called “beige” adipocytes that can acquire a phenotype reminiscent of “brown” adipocytes residing in the BAT when exposed to cold or certain agents (26–29). Unlike white adipocytes, beige and brown adipocytes dissipate energy as heat. That Ad-FLD mice have elevated OCR in the iWAT, where beige precursor cells are prevalent (30), suggests that increasing systemic FLD levels induces beige/brown conversion in the iWAT. Supporting this contention, we found that the mRNA levels of thermogenic genes (Ppargc1a (a.k.a. Pgc1α), Cidea and Ucp1), were significantly elevated in iWAT of Ad-FLD mice housed at 23 °C (Fig. 6, E and F, left panel).
We also assessed tissue levels of uncoupling protein-1 (Ucp1), which is encoded by the Ucp1 gene and is indicative of thermogenic activation in beige and brown adipocytes. We saw that Ad-FLD mice had a striking increase over Ad-LacZ mice in the expression Ucp1 in the iWAT, but not the eWAT or BAT (Fig. 6F, right panel). Taken together, our data indicate that systemically increasing FLD levels promotes beige/brown conversion and thermogenic activation within the iWAT and strongly suggests that this mechanism is chiefly responsible for driving energy expenditure in Ad-FLD mice.
Ad-FLD mice have improved glucose intolerance under conditions promoting DIO
Reduced adiposity and increased energy expenditure are frequently accompanied by improved glucose homeostasis. We thus performed glucose tolerance tests on Ad-LacZ and Ad-FLD mice fed a HFD for 3 weeks. Indeed, Ad-FLD mice under these dietary circumstances have markedly improved glucose tolerance, despite also having an ∼50% reduction in fasting plasma insulin levels (Fig. 7, A and B). Gene expression analysis showed that the mRNA levels of genes encoding gluconeogenic enzymes, such as phosphoenolpyruvate carboxykinase (Pck1) and glucose-6-phosphatase catalytic subunit (G6pc), were lower in livers of Ad-FLD mice than those of Ad-LacZ mice (Fig. 7C), suggesting that reduced hepatic glucose production contributes to the improved glucose tolerance seen in Ad-FLD mice fed a HFD.
Figure 7.

Increasing circulating FLD levels in isolation improves measures of glucose homeostasis in mice fed a HFD. A and B, lower serum glucose levels (A) and lower plasma insulin levels (B) versus Ad-LacZ controls during glucose tolerance testing in Ad-FLD mice fed a HFD for 14 days (n = 6 mice/group). C, reduced hepatic mRNA levels of genes encoding the gluconeogenic enzymes PEPCK (Pepck) and G6Pase (G6pc) in Ad-FLD mice fed a HFD for 3 weeks (n = 5–6 mice/group). *, p < 0.05 versus Ad-LacZ in all cases.
Discussion
Angptl4 mobilizes FFAs from the WAT by promoting adipocyte lipolysis and limits uptake of circulating TG into the WAT by inhibiting extracellular LPL activity (31). The N-terminal CCD of Angptl4 is responsible for its ability to inhibit LPL. We show here that the C-terminal FLD of Angptl4 is responsible for stimulating adipocyte lipolysis, a finding that has important physiological and pharmacological implications for obesity and type 2 diabetes.
Angptl4 circulates in full-length and truncated forms, including its CCD and FLD, respectively. Therefore, stimuli such as fasting and glucocorticoids by definition increase circulating levels of full-length Angptl4, together with its individual CCD and FLD components, which then coordinately regulate lipid homeostasis. Supporting this concept, we noted that the FLAG-tagged proteins circulating in Ad-ANGPTL4 and Ad-FLD mice were of a similar size. This indicates either that most, if not all, circulating Angptl4 is cleaved into CCD and FLD components or that the ability of Ad-Angptl4 mice to secrete full-length protein had waned by the time we drew plasma samples, leaving only long-lived truncated forms in the circulation.
Although artificially increasing circulating levels of full-length Angptl4 should reduce adiposity, this process would also be expected to produce marked hypertriglyceridemia and potentially widespread non-adipose tissue steatosis. On the other hand, if FLD levels could be systemically increased without concomitantly increasing CCD levels, then it might be possible to mitigate DIO without risking hyperlipidemia or ectopic steatosis. However, the FLD of Angptl4 had not been studied in isolation, and its impact on lipid, energy, and glucose homeostasis had not been explored. We used an adenoviral system to overexpress FLD in the livers of mice, thus markedly increasing its levels in the circulation. Remarkably, this strategy reduced adiposity in mice without raising circulating TG levels. Although a previous report showed that injecting FLD into the brains of mice reduces food intake (32), we did not observe such a phenotype, suggesting that circulating FLD may not cross the blood–brain barrier. We estimated that the plasma levels of FLD achieved in our overexpression model was ∼61.5 nm when measured 10 days following adenoviral infection. Interestingly, we previously estimated that plasma levels of intact full-length Angptl4 reach to 11.6 nm after a 24-h fast (8). Thus, circulating FLD levels in our overexpression model may be at least 5.3 times higher than what might be achieved by prolonged fasting.
On the other hand, there are two factors to consider when evaluating FLD levels in the blood of Ad-FLD mice. First, the ELISA we performed previously used antibodies recognizing the CCD, rather than FLD, of Angptl4. Thus, we could have underestimated the plasma levels of FLD in our analysis of full-length Angptl4 levels. It is also possible that peak circulating FLD levels in Ad-FLD mice are higher than 61.5 nm, based on the fact that peak adenovirus-mediated FLD expression could be either prior to or after the 10-day postinfection time point when our measurements were made. Future experiments should utilize the administration of purified FLD proteins to confirm the exact concentrations of plasma FLD needed to produce the types of metabolic effects we observed here.
In exploring the mechanism(s) underlying the promising metabolic phenotype of Ad-FLD mice, we discovered that Ad-FLD mice have an elevation in systemic energy expenditure at relatively cold ambient temperatures, an effect profoundly suppressed at thermoneutrality. These results indicate that FLD acts to potentiate adaptive thermogenesis. Probing this phenotype revealed that Ad-FLD mice have increased expression of several thermogenic genes, including Ucp1, and consume more oxygen and glucose specifically in the iWAT. These features combine to suggest that FLD may promote beige/brown conversion in the subcutaneous WAT. Interestingly, an earlier study showed that overexpressing full-length Angptl4 in the WAT and skeletal muscle increases Ucp1 mRNA levels in the eWAT of mice, although the iWAT was not assessed (33). It is possible that elevating FLD levels for longer than the 3-week period in our study would have also induced Ucp1 expression in eWAT. Nonetheless, subcutaneous WAT depots such as iWAT have more abundant beige precursors than do visceral WAT depots such as eWAT (29, 34), In our experiments, Ucp1 expression and oxygen consumption in the BAT were not augmented by FLD, despite its ability to activate cAMP signaling in brown adipocytes. This is likely because baseline Ucp1 mRNA levels and oxygen consumption rates in the BAT are already quite up-regulated, even in control mice.
We propose that FLD could promote thermogenic energy expenditure through two potential mechanisms (Fig. 8). First, it could do so through the stimulation of cAMP-dependent PKA activation in adipocytes, leading to downstream transcriptional induction of thermogenic mediators (26–29) (Fig. 8). Supporting this idea, we saw that mRNA levels of Ppargc1a, which is transcriptionally regulated by cAMP-PKA signaling (30, 35, 36), were elevated in the iWAT of Ad-FLD mice. Induction of Ppargc1α would, in turn, activate transcription of other thermogenic genes, such as Ucp1 and Cidea. For example, adipocyte-specific knock-out of Ppargc1a reduces Ucp1 expression and thermogenic capacity in WAT (37). Second, FLD could increase the availability of intracellular FFAs mobilized through the cAMP-dependent stimulation of adipocyte lipolysis. These FFAs could then be oxidized by mitochondria to generate heat and also serve as critical required factors for the stimulation of Ucp1 activity (38, 39). Future work should focus on determining the relative contribution of these two possibilities to FLD-induced thermogenesis.
Figure 8.
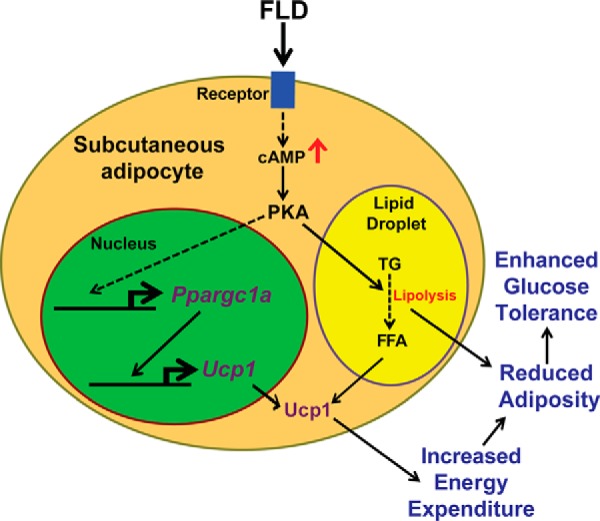
The model of FLD-induced energy expenditure. FLD acts through an unidentified receptor to increase intracellular cAMP levels in adipocytes, which promotes lipolysis. Fatty acids generated from lipolysis are required for Ucp1 activation. Increasing cAMP levels in adipocytes could also augment the expression of thermogenic genes, such as Ppargc1a and Ucp1, which promotes thermogenesis. Dashed lines indicate multiple steps.
Although lipolysis has been targeted to reduce body weight (40), unchecked lipolysis can lead to ectopic lipid accumulation and insulin resistance (41, 42). Indeed, overexpression of full-length ANGPTL4 was shown to cause hepatic steatosis in mice (43). How does increased adipocyte lipolysis in Ad-FLD mice avoid this outcome? One potential explanation is based on our finding that Ad-FLD mice have suppressed mRNA levels of genes involved in in fat uptake, synthesis, and storage in both the liver and skeletal muscle. This down-regulation may reduce the rate at which FAs fluxing from the WAT to the liver and muscle are incorporated into TG, thus preventing steatosis.
Alternatively, FAs in the liver and skeletal muscle could be consumed through FAO. Although gene expression analysis did not reveal FLD regulation of genes involved in FAO, FLD could augment FAO by post-transcriptionally modifying FAO enzymes and/or molecules involved in mitochondrial respiration. Further studies should compare and contrast the relative roles of FAO, mitochondrial respiration, de novo lipogenesis, and TG synthesis on the impact of FLD on hepatic and muscle TG homeostasis. In any case, what is clear is that the tissue steatosis produced when full-length Angptl4 is overexpressed in mice requires the LPL-inhibitory action of CCD, because increasing systemic FLD levels without concomitantly increasing CCD levels prevents, rather than promotes, steatosis.
Overexpressing full-length ANGPTL4 in mice improved glucose tolerance (43, 44); however, our studies indicate that overexpressing FLD on its own is sufficient to improve glucose tolerance in mice fed a HFD. As may be true for energy expenditure, it is possible that FLD improves glucose homeostasis through mechanisms other than the enhancement of WAT lipolysis per se. For example, Ad-FLD mice fed a HFD had reduced hepatic mRNA levels of gluconeogenic genes, suggesting that FLD may enhance insulin sensitivity in the liver and reduce hepatic glucose production. Future work will need to determine the extent to which FLD directly regulates hepatic glucose metabolism versus effects that result indirectly from its regulation of hepatic TG homeostasis.
We show that Angptl4 exerts metabolic effects through both its CCD and FLD and that the FLD is specifically responsible for the ability of Angptl4 to stimulate adipocyte lipolysis. Moreover, FLD may be more appropriate than full-length Angptl4 when considering clinical translation, because FLD can stimulate lipolysis and reduce adiposity without inducing hypertriglyceridemia. Indeed, increasing the levels of FLD systemically in mice not only limits DIO but also improves glucose homeostasis and protects against hepatic and muscular steatosis. Although this phenotypic constellation may involve pleiotropic mechanisms, including enhanced adipocyte lipolysis, beige/brown conversion, and the potentiation of adaptive thermogenesis, our study highlights the potential value of FLD in ameliorating metabolic diseases linked to obesity.
Experimental procedures
Adenovirus production
The adenoviral vector containing full-length human ANGPTL4 cDNA was provided by Dr. Ron Kahn (Joslin Diabetes Center, Boston, MA). To generate the FLD vector, the nucleotide sequence coding amino acids 38–165 of ANGPTL4 was deleted using the QuikChange site-directed mutagenesis kit (Agilent, Santa Clara, CA). Adenoviruses were produced, packaged, and amplified by Vector Biolabs (Malvern, PA). Adenoviruses were injected via tail vein (1 × 10⁹ pfu/mouse in PBS).
Mice
All animal experiments were approved by the animal care and use committee of either the University of California Berkeley (approval number R306-0111) or the University of California San Francisco (approval number AN111420-02). 8-week-old male C57BL/6J mice (Charles River, Wilmington, MA) were injected with adenovirus and fed either a standard low-fat chow diet or a HFD (42% Kcal from fat; Envigo, Indianapolis, IN) ad libitum for 21 days. The mice were either housed at 20–22 °C for the entire study or switched to thermoneutral (30 °C) housing for the last 5 days. Oxygen consumption (VO2), carbon dioxide production (VCO2), and RER were monitored in mice by a CLAMS 18 days after adenoviral injection. The data were normalized to body weight.
Immunoblotting
Tissues were lysed in radioimmune precipitation assay buffer, and the proteins from lysates were separated by SDS-PAGE, transferred to nitrocellulose membrane, and probed with the indicated antibodies. To measure plasma FLAG-FLD and FLAG-ANGPTL4 levels, 40 μl of plasma from Ad-ANGPTL4, Ad-FLD, or Ad-LacZ mice was diluted to 1 ml with lysis buffer and incubated 2 h at 4 °C. Lysates were run through an anti-FLAG M2 affinity gel (A2220; Sigma) to pull down FLAG-tagged proteins. The resin was washed with TBS and boiled for 5 min at 100 °C in sample buffer, and the eluent subjected to SDS-PAGE. Additionally, 3 μl of plasma from Ad-FLD or Ad-LacZ mice fed a HFD, along with 20.5 ng of purified FLAG-FLD proteins, were diluted 10-fold in saline, incubated at 95 °C in sample buffer (31 mm Tris-HCl, pH 6.8, 1% (w/v) glycerol), and then run on SDS-PAGE. After immunoblotting using FLAG antibodies (F3165; Sigma; 1:1000 in 5% BSA), ImageJ software was used to measure the intensity of the resulting bands. The relative concentration of FLAG-FLD in plasma of Ad-FLD mice was then calculated.
RNA isolation and quantitative real-time PCR (qPCR)
qPCR was performed as described (45). The primer sequences are listed (supplemental Table S1).
Plasma TG and FFA measurement
Plasma TG levels were measured using a serum triglyceride determination kit (TR0100; Sigma). Plasma FFA levels were measured using a colorimetric kit (MAK044; Sigma).
Body composition analysis
Body composition was analyzed by DEXA with a PIXImus2 scanner (GE Healthcare).
Tissue TG measurement
Liver samples were weighed and homogenized in a buffer containing 50 mm Tris-HCl (pH 7.4) and 250 mm sucrose. Lipids were extracted in chloroform/methanol (2:1) and separated by TLC on silica gel G-60 plates with the solvent hexane/ethyl ether/acetic acid (v/v/v, 80:20:1). The TG bands were visualized by exposure to iodine, scraped and analyzed as described (8) with triolein (T7140; Sigma) as a standard, and expressed per tissue weight.
Seahorse XF24e analysis
Tissue explants were collected and minced in Krebs–Henseleit buffer (46). 3–5-mg pieces were transferred to Seahorse XF24e islet capture microplates with 500 μl of KHB per well. These microplates were then incubated for 1 h at 37 °C in absence of CO2, read using an XF24e Analyzer (Seahorse Bioscience, Billerica, MA), and then homogenized in radioimmune precipitation assay buffer. OCR and ECAR data were normalized to protein concentration.
Measuring lipolysis from isolated adipocytes
Adipocytes from iWAT were isolated from C57BL/6J mice and treated with either 20 nm Angptl4, 20 nm FLD, 20 nm E40K, or buffer as described (8). Glycerol release was measured using free glycerol reagent (Sigma). cAMP levels were measured by ELISA (Enzo Life Sciences, Farmingdale, NY). The measurements were normalized to protein concentration (Bio-Rad).
Purification of FLAG-tagged proteins
AD293 cells cultured in DMEM plus 10% FBS and 1% penicillin/streptomycin were infected with adenovirus expressing FLAG-ANGPTL4, FLAG-FLD, or FLAG-E40K, and FLAG-tagged proteins were purified as described (8).
Measuring glucose tolerance and plasma insulin levels in mice
The mice were fasted for 6 h and then given i.p. glucose (1g/kg body weight). To perform an intraperitoneal glucose tolerance test, tail blood collected at 0, 15, 30, 60, 90, and 120 min after glucose administration was used measure glucose levels by glucometer (Contour, Bayer). Fasting plasma insulin levels were measured by an ultra-sensitive mouse insulin ELISA kit (Crystal Chem, Downers Grove, IL).
Statistical analyses
The data are expressed as means ± S.E. Statistically significant differences between two groups were assessed by Student's t test. Intraperitoneal glucose tolerance test, CLAMS, and Seahorse results were also analyzed by calculating the area under the curve.
Author contributions
A. E. M. designed and conducted the experiments, analyzed the data, and prepared initial figures and manuscript. D. K., K. Y., N. E. G., L. W., M. L. L., A. C., A. H., and D. S. assisted in conducting and interpreting experiments. S. K. K. and J.-C. W. jointly conceived of the studies, supervised their design and completion, and wrote the final manuscript. A. E. M. and S. K. K. prepared the final figures. The laboratory of J. C. W. lab prepared the adenoviral constructs and performed the in vitro studies and some in vivo studies. The laboratory of S. K. K. performed most of the in vivo studies. J.-C. W. and S. K. K. are guarantors of this work and, as such, had full access to all the data in the study and take responsibility for the integrity of the data and the accuracy of the data analysis.
Supplementary Material
Acknowledgments
We thank Drs. C. Ronald Kahn and Sara Vienberg for the adenoviral vector harboring full-length human ANGPTL4 cDNA; Donghui Wang (UCSF Helen Diller Cancer Center) for performing tail vein injections; Dr. Christophe Paillart and the UCSF Nutrition and Obesity Research Center Mouse Metabolism Core for help with CLAMS experiments; and Dr. Jon Dempersmier for critical reading of the manuscript.
This work was supported by National Institutes of Health Grant R01DK084591 (to J.-C. W.) and American Heart Association Grant 15GRNT22920008 (to J.-C. W.). The UCSF Nutrition and Obesity Research Center Mouse Metabolism Core is supported by NIDDK, National Institutes of Health Grant P30 DK098722-01A1. The authors declare that they have no conflicts of interest with the contents of this article. The content is solely the responsibility of the authors and does not necessarily represent the official views of the National Institutes of Health.

This article contains supplemental Table S1.
- WAT
- white adipose tissue
- iWAT
- inguinal WAT
- eWAT
- epididymal WAT
- BAT
- brown adipose tissue
- CCD
- coiled-coil domain
- FLD
- fibrinogen-like domain
- LPL
- lipoprotein lipase
- Ad
- adenovirus
- TG
- triacylglycerol
- FFA
- free fatty acid
- DIO
- diet-induced obesity
- FAO
- fatty acid oxidation
- CLAMS
- comprehensive lab animal monitoring system
- HFD
- high-fat diet
- RER
- respiratory exchange ratio
- ECAR
- extracellular acidification rate
- qPCR
- quantitative real-time PCR
- DEXA
- dual energy X-ray absorptiometry
- OCR
- oxygen consumption rate.
References
- 1. Kersten S., Mandard S., Tan N. S., Escher P., Metzger D., Chambon P., Gonzalez F. J., Desvergne B., and Wahli W. (2000) Characterization of the fasting-induced adipose factor FIAF, a novel peroxisome proliferator-activated receptor target gene. J. Biol. Chem. 275, 28488–28493 [DOI] [PubMed] [Google Scholar]
- 2. Dijk W., Heine M., Vergnes L., Boon M. R., Schaart G., Hesselink M. K., Reue K., van Marken Lichtenbelt W. D., Olivecrona G., Rensen P. C., Heeren J., and Kersten S. (2015) ANGPTL4 mediates shuttling of lipid fuel to brown adipose tissue during sustained cold exposure. Elife 4, e08428. [DOI] [PMC free article] [PubMed] [Google Scholar]
- 3. Zhu P., Goh Y. Y., Chin H. F., Kersten S., and Tan N. S. (2012) Angiopoietin-like 4: a decade of research. Biosci. Rep. 32, 211–219 [DOI] [PubMed] [Google Scholar]
- 4. Kim I., Kim H. G., Kim H., Kim H. H., Park S. K., Uhm C. S., Lee Z. H., and Koh G. Y. (2000) Hepatic expression, synthesis and secretion of a novel fibrinogen/angiopoietin-related protein that prevents endothelial-cell apoptosis. Biochem. J. 346, 603–610 [PMC free article] [PubMed] [Google Scholar]
- 5. Santulli G. (2014) Angiopoietin-like proteins: a comprehensive look. Front. Endocrinol. (Lausanne) 5, 4. [DOI] [PMC free article] [PubMed] [Google Scholar]
- 6. Dijk W., and Kersten S. (2014) Regulation of lipoprotein lipase by Angptl4. Trends Endocrinol. Metab. 25, 146–155 [DOI] [PubMed] [Google Scholar]
- 7. Mandard S., Zandbergen F., Tan N. S., Escher P., Patsouris D., Koenig W., Kleemann R., Bakker A., Veenman F., Wahli W., Müller M., and Kersten S. (2004) The direct peroxisome proliferator-activated receptor target fasting-induced adipose factor (FIAF/PGAR/ANGPTL4) is present in blood plasma as a truncated protein that is increased by fenofibrate treatment. J. Biol. Chem. 279, 34411–34420 [DOI] [PubMed] [Google Scholar]
- 8. Gray N. E., Lam L. N., Yang K., Zhou A. Y., Koliwad S., and Wang J. C. (2012) Angiopoietin-like 4 (Angptl4) protein is a physiological mediator of intracellular lipolysis in murine adipocytes. J. Biol. Chem. 287, 8444–8456 [DOI] [PMC free article] [PubMed] [Google Scholar]
- 9. Koliwad S. K., Kuo T., Shipp L. E., Gray N. E., Backhed F., So A. Y., Farese R. V. Jr, and Wang J. C. (2009) Angiopoietin-like 4 (ANGPTL4, fasting-induced adipose factor) is a direct glucocorticoid receptor target and participates in glucocorticoid-regulated triglyceride metabolism. J. Biol. Chem. 284, 25593–25601 [DOI] [PMC free article] [PubMed] [Google Scholar]
- 10. Catoire M., Alex S., Paraskevopulos N., Mattijssen F., Evers-van Gogh I., Schaart G., Jeppesen J., Kneppers A., Mensink M., Voshol P. J., Olivecrona G., Tan N. S., Hesselink M. K., Berbée J. F., Rensen P. C., et al. (2014) Fatty acid-inducible ANGPTL4 governs lipid metabolic response to exercise. Proc. Natl. Acad. Sci. U.S.A. 111, E1043–E1052 [DOI] [PMC free article] [PubMed] [Google Scholar]
- 11. Yuan C., Lin J. Z., Sieglaff D. H., Ayers S. D., Denoto-Reynolds F., Baxter J. D., and Webb P. (2012) Identical gene regulation patterns of T3 and selective thyroid hormone receptor modulator GC-1. Endocrinology 153, 501–511 [DOI] [PMC free article] [PubMed] [Google Scholar]
- 12. Le Jan S., Amy C., Cazes A., Monnot C., Lamandé N., Favier J., Philippe J., Sibony M., Gasc J. M., Corvol P., and Germain S. (2003) Angiopoietin-like 4 is a proangiogenic factor produced during ischemia and in conventional renal cell carcinoma. Am. J. Pathol. 162, 1521–1528 [DOI] [PMC free article] [PubMed] [Google Scholar]
- 13. Ge H., Yang G., Yu X., Pourbahrami T., and Li C. (2004) Oligomerization state-dependent hyperlipidemic effect of angiopoietin-like protein 4. J. Lipid Res. 45, 2071–2079 [DOI] [PubMed] [Google Scholar]
- 14. Yau M. H., Wang Y., Lam K. S., Zhang J., Wu D., and Xu A. (2009) A highly conserved motif within the NH2-terminal coiled-coil domain of angiopoietin-like protein 4 confers its inhibitory effects on lipoprotein lipase by disrupting the enzyme dimerization. J. Biol. Chem. 284, 11942–11952 [DOI] [PMC free article] [PubMed] [Google Scholar]
- 15. Köster A., Chao Y. B., Mosior M., Ford A., Gonzalez-DeWhitt P. A., Hale J. E., Li D., Qiu Y., Fraser C. C., Yang D. D., Heuer J. G., Jaskunas S. R., and Eacho P. (2005) Transgenic angiopoietin-like (angptl)4 overexpression and targeted disruption of angptl4 and angptl3: regulation of triglyceride metabolism. Endocrinology 146, 4943–4950 [DOI] [PubMed] [Google Scholar]
- 16. Romeo S., Pennacchio L. A., Fu Y., Boerwinkle E., Tybjaerg-Hansen A., Hobbs H. H., and Cohen J. C. (2007) Population-based resequencing of ANGPTL4 uncovers variations that reduce triglycerides and increase HDL. Nat. Genet. 39, 513–516 [DOI] [PMC free article] [PubMed] [Google Scholar]
- 17. Romeo S., Yin W., Kozlitina J., Pennacchio L. A., Boerwinkle E., Hobbs H. H., and Cohen J. C. (2009) Rare loss-of-function mutations in ANGPTL family members contribute to plasma triglyceride levels in humans. J. Clin. Invest. 119, 70–79 [DOI] [PMC free article] [PubMed] [Google Scholar]
- 18. Dewey F. E., Gusarova V., O'Dushlaine C., Gottesman O., Trejos J., Hunt C., Van Hout C. V., Habegger L., Buckler D., Lai K. M., Leader J. B., Murray M. F., Ritchie M. D., Kirchner H. L., Ledbetter D. H., et al. (2016) Inactivating variants in ANGPTL4 and risk of coronary artery disease. New Engl. J. Med. 374, 1123–1133 [DOI] [PMC free article] [PubMed] [Google Scholar]
- 19. Myocardial Infarction Genetics and CARDIoGRAM Exome Consortia Investigators, Stitziel N. O., Stirrups K. E., Masca N. G., Erdmann J., Ferrario P. G., König I. R., Weeke P. E., Webb T. R., Auer P. L., Schick U. M., Lu Y., Zhang H., Dube M. P., et al. (2016) Coding Variation in ANGPTL4, LPL, and SVEP1 and the Risk of Coronary Disease. New Engl. J. Med. 374, 1134–1144 [DOI] [PMC free article] [PubMed] [Google Scholar]
- 20. Sanderson L. M., Degenhardt T., Koppen A., Kalkhoven E., Desvergne B., Müller M., and Kersten S. (2009) Peroxisome proliferator-activated receptor β/δ (PPARβ/δ) but not PPARα serves as a plasma free fatty acid sensor in liver. Mol. Cell Biol. 29, 6257–6267 [DOI] [PMC free article] [PubMed] [Google Scholar]
- 21. Goh Y. Y., Pal M., Chong H. C., Zhu P., Tan M. J., Punugu L., Lam C. R., Yau Y. H., Tan C. K., Huang R. L., Tan S. M., Tang M. B., Ding J. L., Kersten S., and Tan N. S. (2010) Angiopoietin-like 4 interacts with integrins β1 and β5 to modulate keratinocyte migration. Am. J. Pathol. 177, 2791–2803 [DOI] [PMC free article] [PubMed] [Google Scholar]
- 22. Gomez Perdiguero E., Liabotis-Fontugne A., Durand M., Faye C., Ricard-Blum S., Simonutti M., Augustin S., Robb B. M., Paques M., Valenzuela D. M., Murphy A. J., Yancopoulos G. D., Thurston G., Galaup A., Monnot C., et al. (2016) ANGPTL4-αvβ3 integrin interaction counteracts hypoxia-induced vascular permeability by modulating Src signalling downstream of vascular endothelial growth factor receptor 2. J. Pathol. 240, 461–471 [DOI] [PubMed] [Google Scholar]
- 23. Zhu P., Tan M. J., Huang R. L., Tan C. K., Chong H. C., Pal M., Lam C. R., Boukamp P., Pan J. Y., Tan S. H., Kersten S., Li H. Y., Ding J. L., and Tan N. S. (2011) Angiopoietin-like 4 protein elevates the prosurvival intracellular Ȱ:H2O2 ratio and confers anoikis resistance to tumors. Cancer Cell 19, 401–415 [DOI] [PubMed] [Google Scholar]
- 24. Goh Y. Y., Pal M., Chong H. C., Zhu P., Tan M. J., Punugu L., Tan C. K., Huang R. L., Sze S. K., Tang M. B., Ding J. L., Kersten S., and Tan N. S. (2010) Angiopoietin-like 4 interacts with matrix proteins to modulate wound healing. J. Biol. Chem. 285, 32999–33009 [DOI] [PMC free article] [PubMed] [Google Scholar]
- 25. Cannon B., and Nedergaard J. (2011) Nonshivering thermogenesis and its adequate measurement in metabolic studies. J. Exp. Biol. 214, 242–253 [DOI] [PubMed] [Google Scholar]
- 26. Himms-Hagen J., Melnyk A., Zingaretti M. C., Ceresi E., Barbatelli G., and Cinti S. (2000) Multilocular fat cells in WAT of CL-316243-treated rats derive directly from white adipocytes. Am. J. Physiol. Cell Physiol. 279, C670–C681 [DOI] [PubMed] [Google Scholar]
- 27. Dickson L. M., Gandhi S., Layden B. T., Cohen R. N., and Wicksteed B. (2016) Protein kinase A induces UCP1 expression in specific adipose depots to increase energy expenditure and improve metabolic health. Am. J. Physiol. Regul. Integr. Comp. Physiol. 311, R79–R88 [DOI] [PMC free article] [PubMed] [Google Scholar]
- 28. Wu J., Cohen P., and Spiegelman B. M. (2013) Adaptive thermogenesis in adipocytes: is beige the new brown? Genes Dev. 27, 234–250 [DOI] [PMC free article] [PubMed] [Google Scholar]
- 29. Harms M., and Seale P. (2013) Brown and beige fat: development, function and therapeutic potential. Nat. Med. 19, 1252–1263 [DOI] [PubMed] [Google Scholar]
- 30. Wang W., and Seale P. (2016) Control of brown and beige fat development. Nat. Rev. Mol. Cell Biol. 17, 691–702 [DOI] [PMC free article] [PubMed] [Google Scholar]
- 31. Koliwad S. K., Gray N. E., and Wang J. C. (2012) Angiopoietin-like 4 (Angptl4): a glucocorticoid-dependent gatekeeper of fatty acid flux during fasting. Adipocyte 1, 182–187 [DOI] [PMC free article] [PubMed] [Google Scholar]
- 32. Kim H. K., Youn B. S., Shin M. S., Namkoong C., Park K. H., Baik J. H., Kim J. B., Park J. Y., Lee K. U., Kim Y. B., and Kim M. S. (2010) Hypothalamic angptl4/fiaf is a novel regulator of food intake and body weight. Diabetes 59, 2772–2780 [DOI] [PMC free article] [PubMed] [Google Scholar]
- 33. Mandard S., Zandbergen F., van Straten E., Wahli W., Kuipers F., Müller M., and Kersten S. (2006) The fasting-induced adipose factor/angiopoietin-like protein 4 is physically associated with lipoproteins and governs plasma lipid levels and adiposity. J. Biol. Chem. 281, 934–944 [DOI] [PubMed] [Google Scholar]
- 34. Vitali A., Murano I., Zingaretti M. C., Frontini A., Ricquier D., and Cinti S. (2012) The adipose organ of obesity-prone C57BL/6J mice is composed of mixed white and brown adipocytes. J. Lipid Res. 53, 619–629 [DOI] [PMC free article] [PubMed] [Google Scholar]
- 35. Cao W., Daniel K. W., Robidoux J., Puigserver P., Medvedev A. V., Bai X., Floering L. M., Spiegelman B. M., and Collins S. (2004) p38 mitogen-activated protein kinase is the central regulator of cyclic AMP-dependent transcription of the brown fat uncoupling protein 1 gene. Mol. Cell Biol. 24, 3057–3067 [DOI] [PMC free article] [PubMed] [Google Scholar]
- 36. Inagaki T., Sakai J., and Kajimura S. (2016) Transcriptional and epigenetic control of brown and beige adipose cell fate and function. Nat. Rev. Mol. Cell Biol. 17, 480–495 [DOI] [PMC free article] [PubMed] [Google Scholar]
- 37. Kleiner S., Mepani R. J., Laznik D., Ye L., Jurczak M. J., Jornayvaz F. R., Estall J. L., Chatterjee Bhowmick D., Shulman G. I., and Spiegelman B. M. (2012) Development of insulin resistance in mice lacking PGC-1α in adipose tissues. Proc. Natl. Acad. Sci. U.S.A. 109, 9635–9640 [DOI] [PMC free article] [PubMed] [Google Scholar]
- 38. Fedorenko A., Lishko P. V., and Kirichok Y. (2012) Mechanism of fatty-acid-dependent UCP1 uncoupling in brown fat mitochondria. Cell 151, 400–413 [DOI] [PMC free article] [PubMed] [Google Scholar]
- 39. Cannon B., and Nedergaard J. (2004) Brown adipose tissue: function and physiological significance. Physiol. Rev. 84, 277–359 [DOI] [PubMed] [Google Scholar]
- 40. Langin D. (2006) Adipose tissue lipolysis as a metabolic pathway to define pharmacological strategies against obesity and the metabolic syndrome. Pharmacol. Res. 53, 482–491 [DOI] [PubMed] [Google Scholar]
- 41. Morigny P., Houssier M., Mouisel E., and Langin D. (2016) Adipocyte lipolysis and insulin resistance. Biochimie 125, 259–266 [DOI] [PubMed] [Google Scholar]
- 42. Arner P., and Langin D. (2014) Lipolysis in lipid turnover, cancer cachexia, and obesity-induced insulin resistance. Trends Endocrinol. Metab. 25, 255–262 [DOI] [PubMed] [Google Scholar]
- 43. Xu A., Lam M. C., Chan K. W., Wang Y., Zhang J., Hoo R. L., Xu J. Y., Chen B., Chow W. S., Tso A. W., and Lam K. S. (2005) Angiopoietin-like protein 4 decreases blood glucose and improves glucose tolerance but induces hyperlipidemia and hepatic steatosis in mice. Proc. Natl. Acad. Sci. U.S.A. 102, 6086–6091 [DOI] [PMC free article] [PubMed] [Google Scholar]
- 44. Wang Y., Liu L. M., Wei L., Ye W. W., Meng X. Y., Chen F., Xiao Q., Chen J. Y., and Zhou Y. (2016) Angiopoietin-like protein 4 improves glucose tolerance and insulin resistance but induces liver steatosis in high-fat-diet mice. Mol. Med. Rep. 14, 3293–3300 [DOI] [PubMed] [Google Scholar]
- 45. Kuo T., Chen T. C., Yan S., Foo F., Ching C., McQueen A., and Wang J. C. (2014) Repression of glucocorticoid-stimulated angiopoietin-like 4 gene transcription by insulin. J. Lipid Res. 55, 919–928 [DOI] [PMC free article] [PubMed] [Google Scholar]
- 46. Dempersmier J., Sambeat A., Gulyaeva O., Paul S. M., Hudak C. S., Raposo H. F., Kwan H. Y., Kang C., Wong R. H., and Sul H. S. (2015) Cold-inducible Zfp516 activates UCP1 transcription to promote browning of white fat and development of brown fat. Mol. Cell 57, 235–246 [DOI] [PMC free article] [PubMed] [Google Scholar]
Associated Data
This section collects any data citations, data availability statements, or supplementary materials included in this article.