

Abstract
Background
Ovulation rate and litter size are important reproductive traits in sheep with high economic value. Recent work has revealed a potential link between DNA methylation and prolificacy. However, a genome-wide study that sought to identify potential DNA methylation sites involved in sheep prolificacy indicated that it is still unknown. Here, we aimed to investigate the genome-wide DNA methylation profiles of Hu sheep ovaries by comparing a high-prolificacy group (HP, litter size of three for at least 2 consecutive lambings) and low prolificacy group (LP, litter size of one for at least 2 consecutive lambings) using deep whole-genome bisulfite sequencing (WGBS).
Results
First, our results demonstrated lower expression levels of DNA methyltransferase (DNMT) genes in the ovaries of the HP group than that in the ovaries of the LP group. Both groups showed similar proportions of methylation at CpG sites but different proportions at non-CpG sites. Subsequently, we identified 70,899 differential methylated regions (DMRs) of CG, 16 DMRs of CHG, 356 DMRs of CHH and 12,832 DMR-related genes(DMGs). Gene Ontology (GO) analyses revealed that some DMGs were involved in regulating female gonad development and ovarian follicle development. Finally, we found that 10 DMGs, including BMP7, BMPR1B, CTNNB1, FST, FSHR, LHCGR, TGFB2 and TGFB3, are more likely to be involved in prolificacy of Hu sheep, as assessed by correlation analysis and listed in detail.
Conclusions
This study revealed the global DNA methylation pattern of sheep ovaries associated with high and low prolificacy groups, which may contribute to a better understanding of the epigenetic regulation of sheep reproductive capacity.
Electronic supplementary material
The online version of this article (doi:10.1186/s12864-017-4068-9) contains supplementary material, which is available to authorized users.
Keywords: DNA Methylation, WGBS, Prolificacy, Ovary, Sheep
Background
DNA methylation is an epigenetic regulatory mechanism that plays a significant role in mediating biological processes such as gene expression, genomic imprinting, cell differentiation and embryogenesis, as well as in determining phenotypic plasticity in organisms [1]. DNA methylation occurs at the cytosine residue of CpG dinucleotides, which are unevenly distributed throughout the genomes. Recently, the whole genome methylation of genes involved in vital biological functions has been extensively examined in mammalian species [2, 3] by using advanced high-throughput sequencing technologies. The reproductive efficiency of sheep in terms of litter size has an important impact on the economic returns of farmers [4]. Reproductive traits typically have low to medium heritability and do not exhibit a noticeable response to phenotypic selection [4]. Therefore, investigation of the genetic information associated with reproductive ability could efficiently enhance selection. Prolificacy is controlled by ovarian folliculogenesis, a process that is highly regulated by precise proliferation and differentiation events. Recent research has shifted focus to how DNA methylation regulates the initiation of ovarian and sexual maturation. Evidence has revealed that ovarian maturation is regulated by DNA methylation [5, 6]. By profiling the methylome of porcine ovaries, researchers examined the methylation changes during the process of sexual and ovarian maturation in pigs [7]. Similar studies also found that DNA methylation alterations influenced gene expression profiles in the goat hypothalamus during the onset of puberty [8]. Despite these findings, our understanding of DNA methylation patterns associated with prolificacy remains limited. Hu sheep are widely recognized as having early sexual maturity and high prolificacy; however, in recent years, much attention has been focused on meat rather than reproductive traits during the selection process. Reproduction is a complex process, and traits such as litter size are affected by many minor genes and some major genes; thus, understanding the role of DNA methylation in gene function is necessary.
Of the four DNA methylation sequencing technologies: methylated DNA binding domain sequencing, methylated DNA immunoprecipitation sequencing, representation bisulfite sequencing (RRBS) and whole-genome bisulfite sequencing (WGBS), WGBS is similar to whole genome sequencing, except for one detail: bisulfite conversion. It achieves single-base resolution through bisulfite conversion and does not have a base preference as it can yield almost complete information about methylcytosine with excellent specificity and non-sensitivity [9]. Therefore, WGBS is the most comprehensive of the existing methods. In this study, we investigated DNA methylation profiles in the ovaries of high and low prolificacy sheep at 3 years of age during the estrus stage using WGBS technology. Our research systematically analyzed the DNA methylation patterns potentially involved in litter size. In addition, our findings would advance knowledge and understanding of the sheep methylome.
Methods
Animals and tissue collection
A total of 6 non-pregnant ewes with identical lambing records (3 records) were selected and divided into a high prolificacy group (HP: n = 3, litter size = 3) and a low prolificacy group (LP: n = 3, litter size = 1). Progesterone sponges were intravaginally implanted in ewes for estrus synchronization and were removed after 11 days. Then the estrus status of the ewes was checked every day. Ewes were slaughtered within 12 h during the estrus stage, and ovaries were immediately collected and snap-frozen in liquid nitrogen immediately and then stored at −80 °C until use.
DNA, bisulfite treatment and RNA/cDNA preparation
Each whole ipsilateral ovary per sheep was collected, and the genomic DNA was extracted using a Genomic DNA kit (TIANamp, Cat.#DP304–02), and then bisulfite conversion was performed using the EZ DNA Methylation Direct Kit (Zymo Research Corporation, Cat#D5020). Total RNA was isolated using the TRIzol reagent (Invitrogen Corp, Cat.#15,596–026) and dissolved in RNase-Free water (QIAGEN, Cat.#129,112). The quality and quantity of DNA and RNA were determined using a NanoDrop instrument (NanoDrop Technologies, Wilmington, DE, USA). cDNA samples were synthesized from total RNA using a reverse transcription (RT) reagent kit with gDNA Eraser (Takara, Cat.#RR047A). All operations were conducted following the manufacturer’s recommended instructions.
WGBS library preparation and data analysis
Three samples from each group were selected for WGBS sequencing. Genomic DNA was fragmented by ultrasonication. The fragments were then end-repaired, 3′-end-adenylated and ligated with adapters. Agarose gel electrophoresis was used to select fragments of 400–500 bp in length. The selected fragments were treated with bisulfite and subjected to PCR amplification to form the sequencing library. Then, the qualified library was sequenced using an IlluminaHiSeq™2500 system (Biomarker Technologies, Beijing, China). The peak signal produced by the Illumina HiSeq was transformed into base sequence by base calling as Raw Data or Raw Reads. The Raw Reads were then filtered for subsequent information analysis to ensure the quality of information analysis, including the removal of reads that have adapters and filtration of reads with more than 10% N content or more than 50% low quality bases. The final filtered data are called clean reads.
Mapping reads to known genome
The sequencing reads need to be aligned with the reference genome (Oar_v3.1) before conducting the methylation analysis. Bismark software was used to perform a comparison of the alignments of bisulfite-treated reads to a reference genome using the default parameters. Reads that aligned with the same region of the genome were taken as the duplicate number. And the duplicate number was used to summarize the sequencing depth and coverage. The conversion rate of bisulfite was calculated as the percentage of the methylated clean reads as a percentage of the total number of clean reads in the lambda genome by using Bismark software. As unmethylated cytosine from the genome was converted into T after bisulfite treatment and PCR amplification, but methylated cytosine remained unchanged. Bismark was able to extract information about genome cytosine sites from the results of the comparison of the clean reads with the reference genome and thereby acquire cytosine site coverage statistics and the number of different types (CG as CpG, CHG and CHH) of methylated cytosine reads. As the methylation single C site cannot be discriminated by Bismark, we used the binomial distribution test for each C site to confirm the methylated C site by screening conditions for coverage ≥4× and false discovery rate (FDR) < 0.05.
Estimating methylation levels and the identification of DMRs
All cytosine sites with reads coverage >10X were used for DMRs analysis with MOABS [10]. First, to detect the different methylated C sites in a region, we defined C i as the number of supporting methylation reads at a single C site, T i as the number of supporting unmethylation reads at a single C site, i as the position of C, and n as the total number of C positions. The methylation level of a C site was counted as follows [11]:
The binomial distribution test was used to determine whether the C site was methylated. Subsequently, DMRs were defined that three different methylation sites at least in the region, and in which the difference in methylation levels was greater than 0.2 (0.3 for CG type) with p value from Fisher’s exact test of less than 0.05. The methylation level of regions was counted as follows [11]:
Bioinformatics analysis of DMGs
The DMGs were compared with functional databases such as GO, COG (Cluster of Orthologous Groups of proteins) and KEGG (Kyoto Encyclopedia of Genes and Genomes) by BLAST to obtain the annotation of these genes for analyzing gene function. The GO enrichment analysis was implemented by the Wallenius non-central hyper-geometric distribution in the GOseq R packages [12]. KOBAS software was used to test for statistically significant enrichment of differentially expressed genes in KEGG pathways [13]. The interaction networks of selected DMGs were analyzed using the String database (http://string-db.org/) [14].
Quantitative reverse transcriptase PCR
Quantitative reverse transcriptase PCR (qRT-PCR) was used to examine DNA methyltransferase gene expression levels and validate the DMGs from the sequencing results by detecting the mRNAs expression level. Ten DMGs were randomly selected, and the specific primers used in the qRT-PCR are listed in Additional file 1: Table S1.
qRT-PCR was performed on a StepOnePlus Real-Time PCR System (Life Technologies, USA). Each PCR (a reaction volume of 20 μL) system included 10 μL of SYBR Green Master mix (Roche Applied Science, Mannheim, Germany), 0.6 μL each of 10 μM forward and reverse primer, 1 μL of reverse transcription product and 7.8 μL of RNase-Free water. The comparative quantification of each of the results was standardized to GAPDH by the 2-ΔΔCt method.
Statistical analysis
All data were analyzed using the SPSS 24.0 software package (SPSS, Chicago, IL, USA). The qRT-PCR results are expressed as the mean ± standard error, and each group contained three samples and the experiments were repeated at least 3 times. The different mRNA expression levels of genes in the HP and LP groups were compared using the independent-samples t-test. Differences were considered significant at P < 0.05.
Results
Expression levels of DNMTs
The expression levels of DNMTs (DNMT1, DNMT3A and DNMT3B) in ovaries were first analyzed by qRT-PCR in the HP and LP sheep. As Fig. 1 shows, DNMT1 and DNMT3A were expressed at significantly lower levels in the HP group than in the LP group (P < 0.05).
Fig. 1.
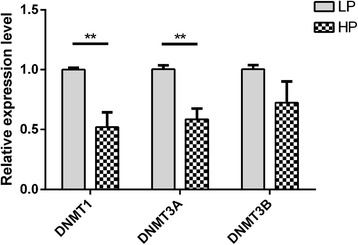
The mRNA expression level of DNMTs as determinded by qRT-PCR. The relative expressions of DNMTs in ovaries was detected by qRT-PCR. The experiment was performed using 3 biological repeats and 3 technical repeats. The relative expression levels were normalized to the expression amount of GAPDH. The results are expressed relative to the LP group as the mean ± SEM and the ordinate represents log10-transformed values. **, P < 0.01
DNA methylation mapping and patterns
A total of 63.79 G and 66.72 G raw bases were generated on average for the HP group and the LP group respectively. After data filtering, approximately 200 million clean reads were generated for each group. These reads were detected in all chromosomal regions for each group. The mapped reads were used for subsequent analysis as the rates were from 71.36% to 74.68% (Table 1).
Table 1.
Whole genome DNA bisulfite sequencing data
| Groups | Sample | Clean Base (Gb) | Clean Reads | Mapped (%) | Bisulfite Conversion Rate (%) | Total_mC (%) |
|---|---|---|---|---|---|---|
| HP | J07 | 66.06 | 221,116,974 | 73.88 | 99.35 | 3.65 |
| J08 | 62.23 | 207,777,912 | 74.31 | 99.36 | 3.61 | |
| J09 | 62.47 | 208,906,017 | 74.53 | 99.38 | 3.53 | |
| LP | J10 | 63.61 | 212,805,686 | 74.68 | 99.39 | 3.49 |
| J11 | 71.87 | 240,143,585 | 73.74 | 99.49 | 3.40 | |
| J12 | 64.68 | 216,081,063 | 71.36 | 99.43 | 3.62 |
Clean Base (Gb) The number of Clean Base throughout the sequence
Clean Reads The number of clean reads
Mapped (%) The number of clean reads matched to the reference genome relative to the total clean reads
Bisulfite Conversion Rate (%) The number of clean reads matched to the reference genome relative to the amount of methylation of the clean reads matched to the reference genome
Total mC (%) The number of clean reads matched to the reference genome relative to the amount of methylated cytosine within the clean reads matched to the reference genome
In each group, approximately 3.5% of all genomic C sites were methylated (Table 1). Methylation in sheep was found to exist in three sequence contexts: CG, CHG (where H is A, C or T), and CHH. These contexts were present in similar proportions in each group, and we found overall genome-wide methylated cytosine levels of 89.78% CG, 2.46% CHG, 7.76% CHH in the HP group and 88.60% CG, 2.66% CHG, 8.74% CHH in the LP group (Fig. 2).
Fig. 2.
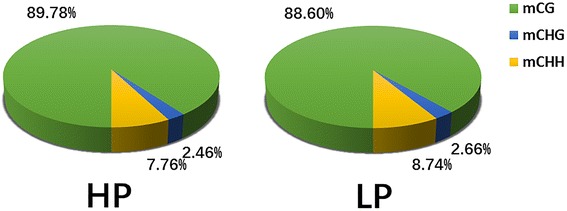
The average ratio of DNA methylation types in the genomes of HP and LP. HP, High Prolificacy. LP, Low Prolificacy, H = A, C or T. The green, blue and yellow colors represent mCG, mCHG and mCHH, respectively
Sequence preferences analysis for methylation
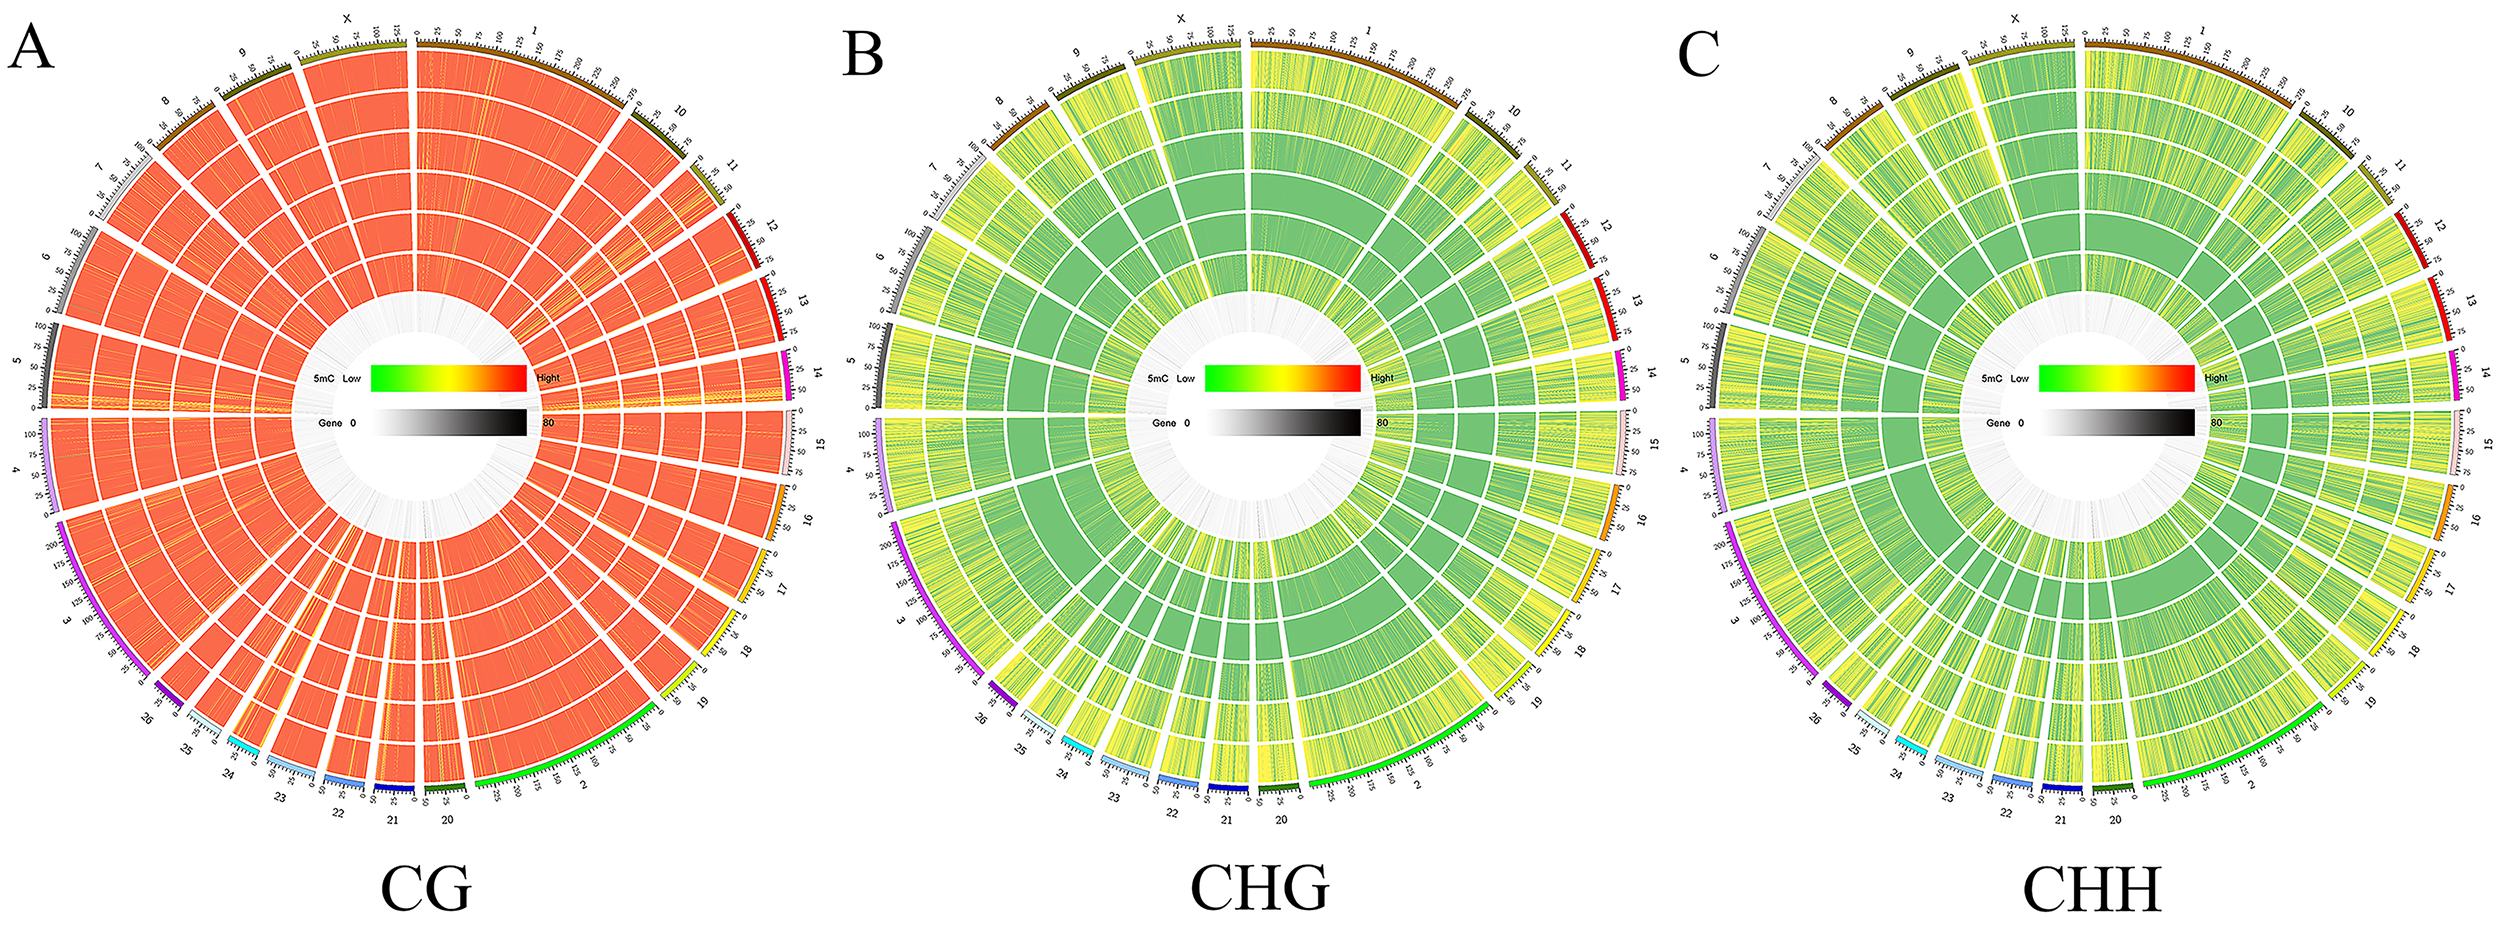
A violin graph was plotted with dots representing different methylation levels, and we found that the methylation levels were high with wide sections in the violin plot for CG methylation types (Fig. 3a), but the methylation levels were low with narrow sections in the violin plot for CHG and CHH methylation types (Fig. 3b and c). Then, we plotted chromosome methylation maps for each sample. The results showed that most hypermethylation cytosine were of the CG type in chromosomes and that the mC (methylated cytosine) sites were different on the chromosome like chromosome 18 between the two groups (Additional file 2: Figure S1).
Fig. 3.
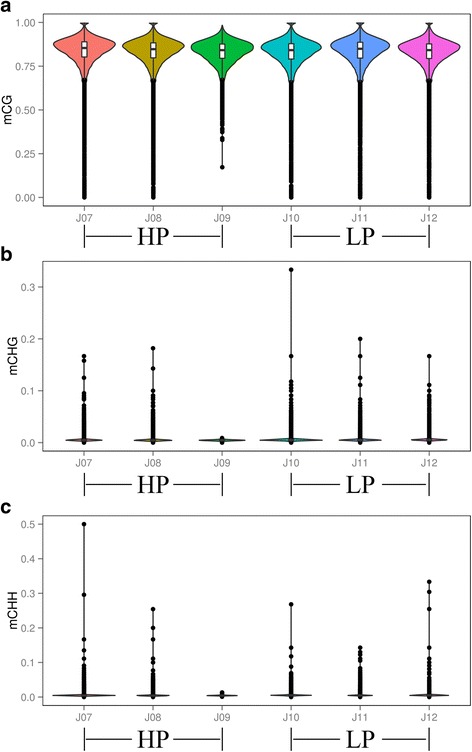
Violin plot for the overall distribution of methylation levels for different methylation types. a, CG. b, CHG. c, CHH. HP (J07, J08, J09), High Prolificacy. LP (J10, J11, J12), Low Prolificacy. H = A, C or T. The abscissa represents the different samples, the ordinate represents the level of methylation of the samples; and the width of each violin represents the density of the point at that methylation level; while the boxplot shows the methylation levels in each violin
Furthermore, we analyzed the relationship between sequence context and methylation preference. We calculated the percentage methylation for all possible 9-mer sequences in which either the methylated cytosine was in the fourth position (allowing analysis of the three nucleotides upstream of CG, CHG, and CHH methylation), the mC sites were in a hypermethylation state, the CAG was the most common sequence motif in the CHG mC sites, and different frequencies of the CHH contexts was discovered for the two groups (Fig. 4).
Fig. 4.
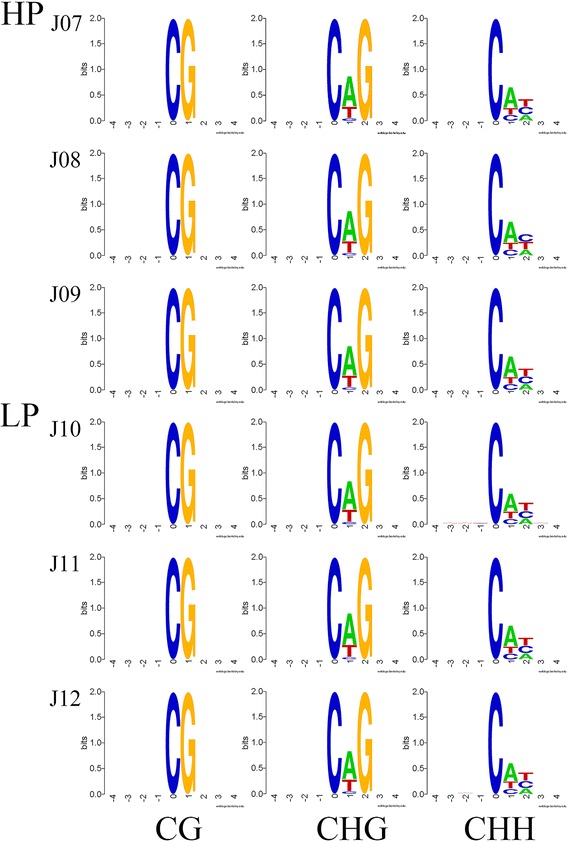
Methylation preferences in 9 bp spanning CG, CHG, and CHH methylcytosine sites. HP (J07, J08, J09), High Prolificacy. LP (J10, J11, J12), Low Prolificacy. H = A, C or T. The abscissa is the base number of the methylation site, the total height of each position is the sequence conservation of the base, which represents the relative frequency of the base at that position
DNA methylation levels of different functional regions
We divided all mC into specific gene features: promoter, 5’UTR (Untranslated Regions), exons, introns, and 3’UTR. The methylation levels were evaluated in these functional regions. As shown in Fig. 5, the trend of methylation levels in the specified regions of the two groups were similar in the two groups, and the methylation levels for the CG type were higher than those for the CHG and CHH types. Intron regions, exons (except for the first exon) and downstream regions are the major components of mC containing sites (Additional file 3: Table S2). Moreover, the methylation levels of CG in the first exon were lower than those of the other elements except for the upstream region, as the levels showed a downward trend in upstream region, and the methylation levels of CG sites near the TSS were lower than those in the first exon. In addition, high levels of DNA methylation were detected in inner exons and introns, and the levels of methylation decreased gradually from the promoters to the TSS (Transcription Start Site) and increased from the TSS to the introns; the CHH type was hypomethylation and stable in each functional element; the CHG type was almost entirely unmethylated. More detailed information is listed in Additional file 4: Table S3.
Fig. 5.
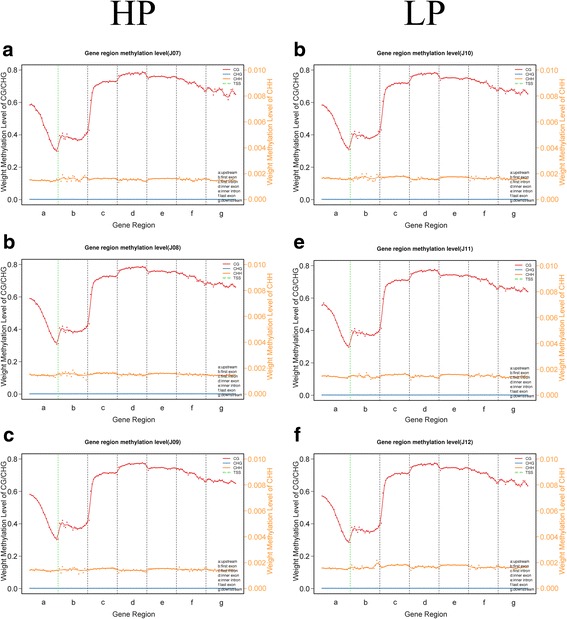
The trend in CGI distribution in different functional elements. a, J07. b, J08. c, J09. d, J10. e, J11. f, J12. HP (J07, J08, J09), High Prolificacy. LP (J10, J11, J12), Low Prolificacy. H = A, C or T. The abscissa represents the different regions of gene functional elements that a, b, c, d, e, f, g denote upstream, first exon, first intron, inner exon, inner intron, last exon and downstream, respectively. The left ordinate represents the methylation levels of CG/CHG, and the right ordinate represents the methylation levels of CHH. The dotted, green, vertical line represents the TSS, and the red, orange and blue solid lines represent CG, CHH and CHG, respectively, which show the methylation levels fluctuating in the different regions
Annotation of methylation CGI regions
We counted the quantity of hypermethylation CGI (CG islands) regions (hypermethylation CGI definition: methylation level over 0.7 except when the proportion of C sites with high confidence was less than 0.1) and annotated these with gene functional elements (with 3000 bp 5′ to the TSS and 3′ to transcription termination site as the gene upstream and downstream functional regions respectively). As Fig. 6 shows, approximately 68% hypermethylation CGI was distributed in distal intergenic regions, within 1.5% hypermethylation CGI was distributed in UTR and there was no significant difference between the two groups (P > 0.05).
Fig. 6.
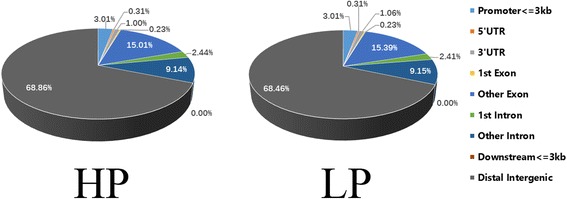
The ratio of hypermethylation CGI distribution in different functional elements of gene. HP, High Prolificacy. LP, Low Prolificacy. The charcoal, blue, orange, gray, yellow, hyacinthine, green, dark blue and brown colors represent distal intergenic, promoter (<=3 kb), 5’UTR, 3’UTR, 1st exon, other exon, 1st intron, other intron and downstream regions (<=3 kb), respectively
DMRs analysis for the HP and LP groups
DMRs were detected in the two groups and were annotated into gene functional elements according to different methylation types. In total, 70,899 CG DMRs, 16 CHG DMRs and 356 CHH DMRs were identified, most of which were in distal intergenic regions, with only 33 and 162 DMRs were in the 5’UTR and 3’UTR respectively. For all methylation types, the ratio of DMRs located in introns was the highest except for those in distal intergenic regions (Fig. 7). The difference in methylation levels between the two groups in chr12(74369711–74,369,728), chr14(9182359–9,182,369), chr12(69412005–69,412,018), chr3(176960930–176,960,977) and chr1(230630159–230,630,190) had exceed 90% (Additional file 5: Table S4). A heat map was generated using a cluster analysis of DMRs for the HP and LP groups (Fig. 8). More detailed DMRs results are listed in Additional file 5: Table S4.
Fig. 7.
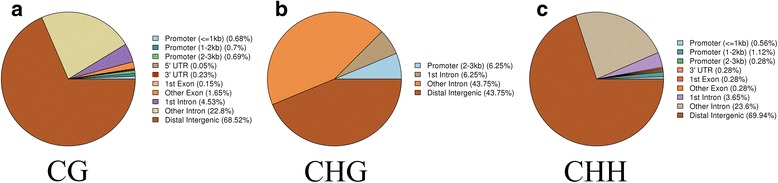
The ratio of DMRs with different methylation types in different gene functional regions. a, CG. b, CHG. c, CHH. H = A, C or T. The blue, dark blue, green, khaki, red, yellow, orange, purple, light yellow and brown colors represent promoter (<=1 kb), promoter (1-2 kb), promoter (2-3 kb),5’UTR, 3’UTR, 1st exon, other exon, 1st intron, other intron and distal intergenic regions, respectively
Fig. 8.
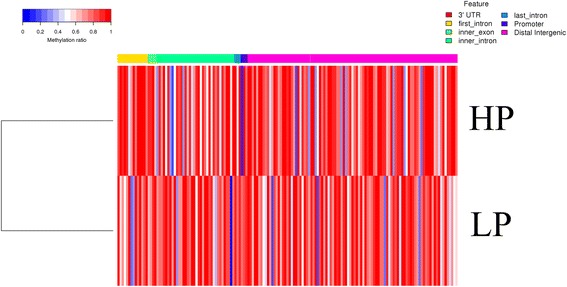
Heat map cluster analysis of DMRs in different gene functional regions. Each column represents an individual DMR and each row represents one group. The colors in each block from blue to white to red sequentially represents the methylation ratio from 0 to 0.5 to 1, respectively. In addition, the red, yellow, green, turquoise, blue, purple and pink colors represent the 3’UTR, first intron, inner exon, inner intron, last intron, promoter and distal intergenic regions respectively which are shown above the heatmap
Verification of sequencing results
To further validate the sequencing results, 10 DMGs from the sequencing results were randomly selected for detection by qRT-PCR. As shows in Fig. 9, the GPNMB, ELK4, BACH1, CDIPT levels were significantly lower and the SCYL1 levels were significantly higher in the HP than in the LP group (P < 0.05), and the ABCG2, mTOR, STK3, ACVR1 and PSMD7 levels were not significantly different between the two group (P > 0.05). More detailed information of these genes/DMRs is listed in Additional file 6: Table S5. In total, the qRT-PCR results showed that the sequencing data were reliable.
Fig. 9.
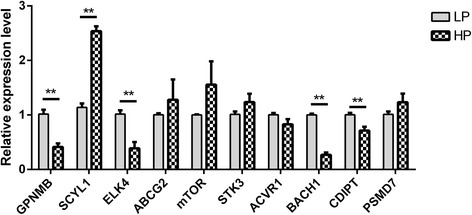
The mRNA expression level of DMGs as determined by qRT-PCR. The relative expressions of DMGs in ovaries was detected by qRT-PCR. The experiment was performed using 3 biological repeats and 3 technical repeats. The relative expression levels were normalized to the expression amount of GAPDH. The results are expressed relative to the LP group as the mean ± SEM, and the ordinate represents log10-transformed values. *, P < 0.05. **, P < 0.01
Database enrichment analysis for DMGs: COG, GO and KEGG
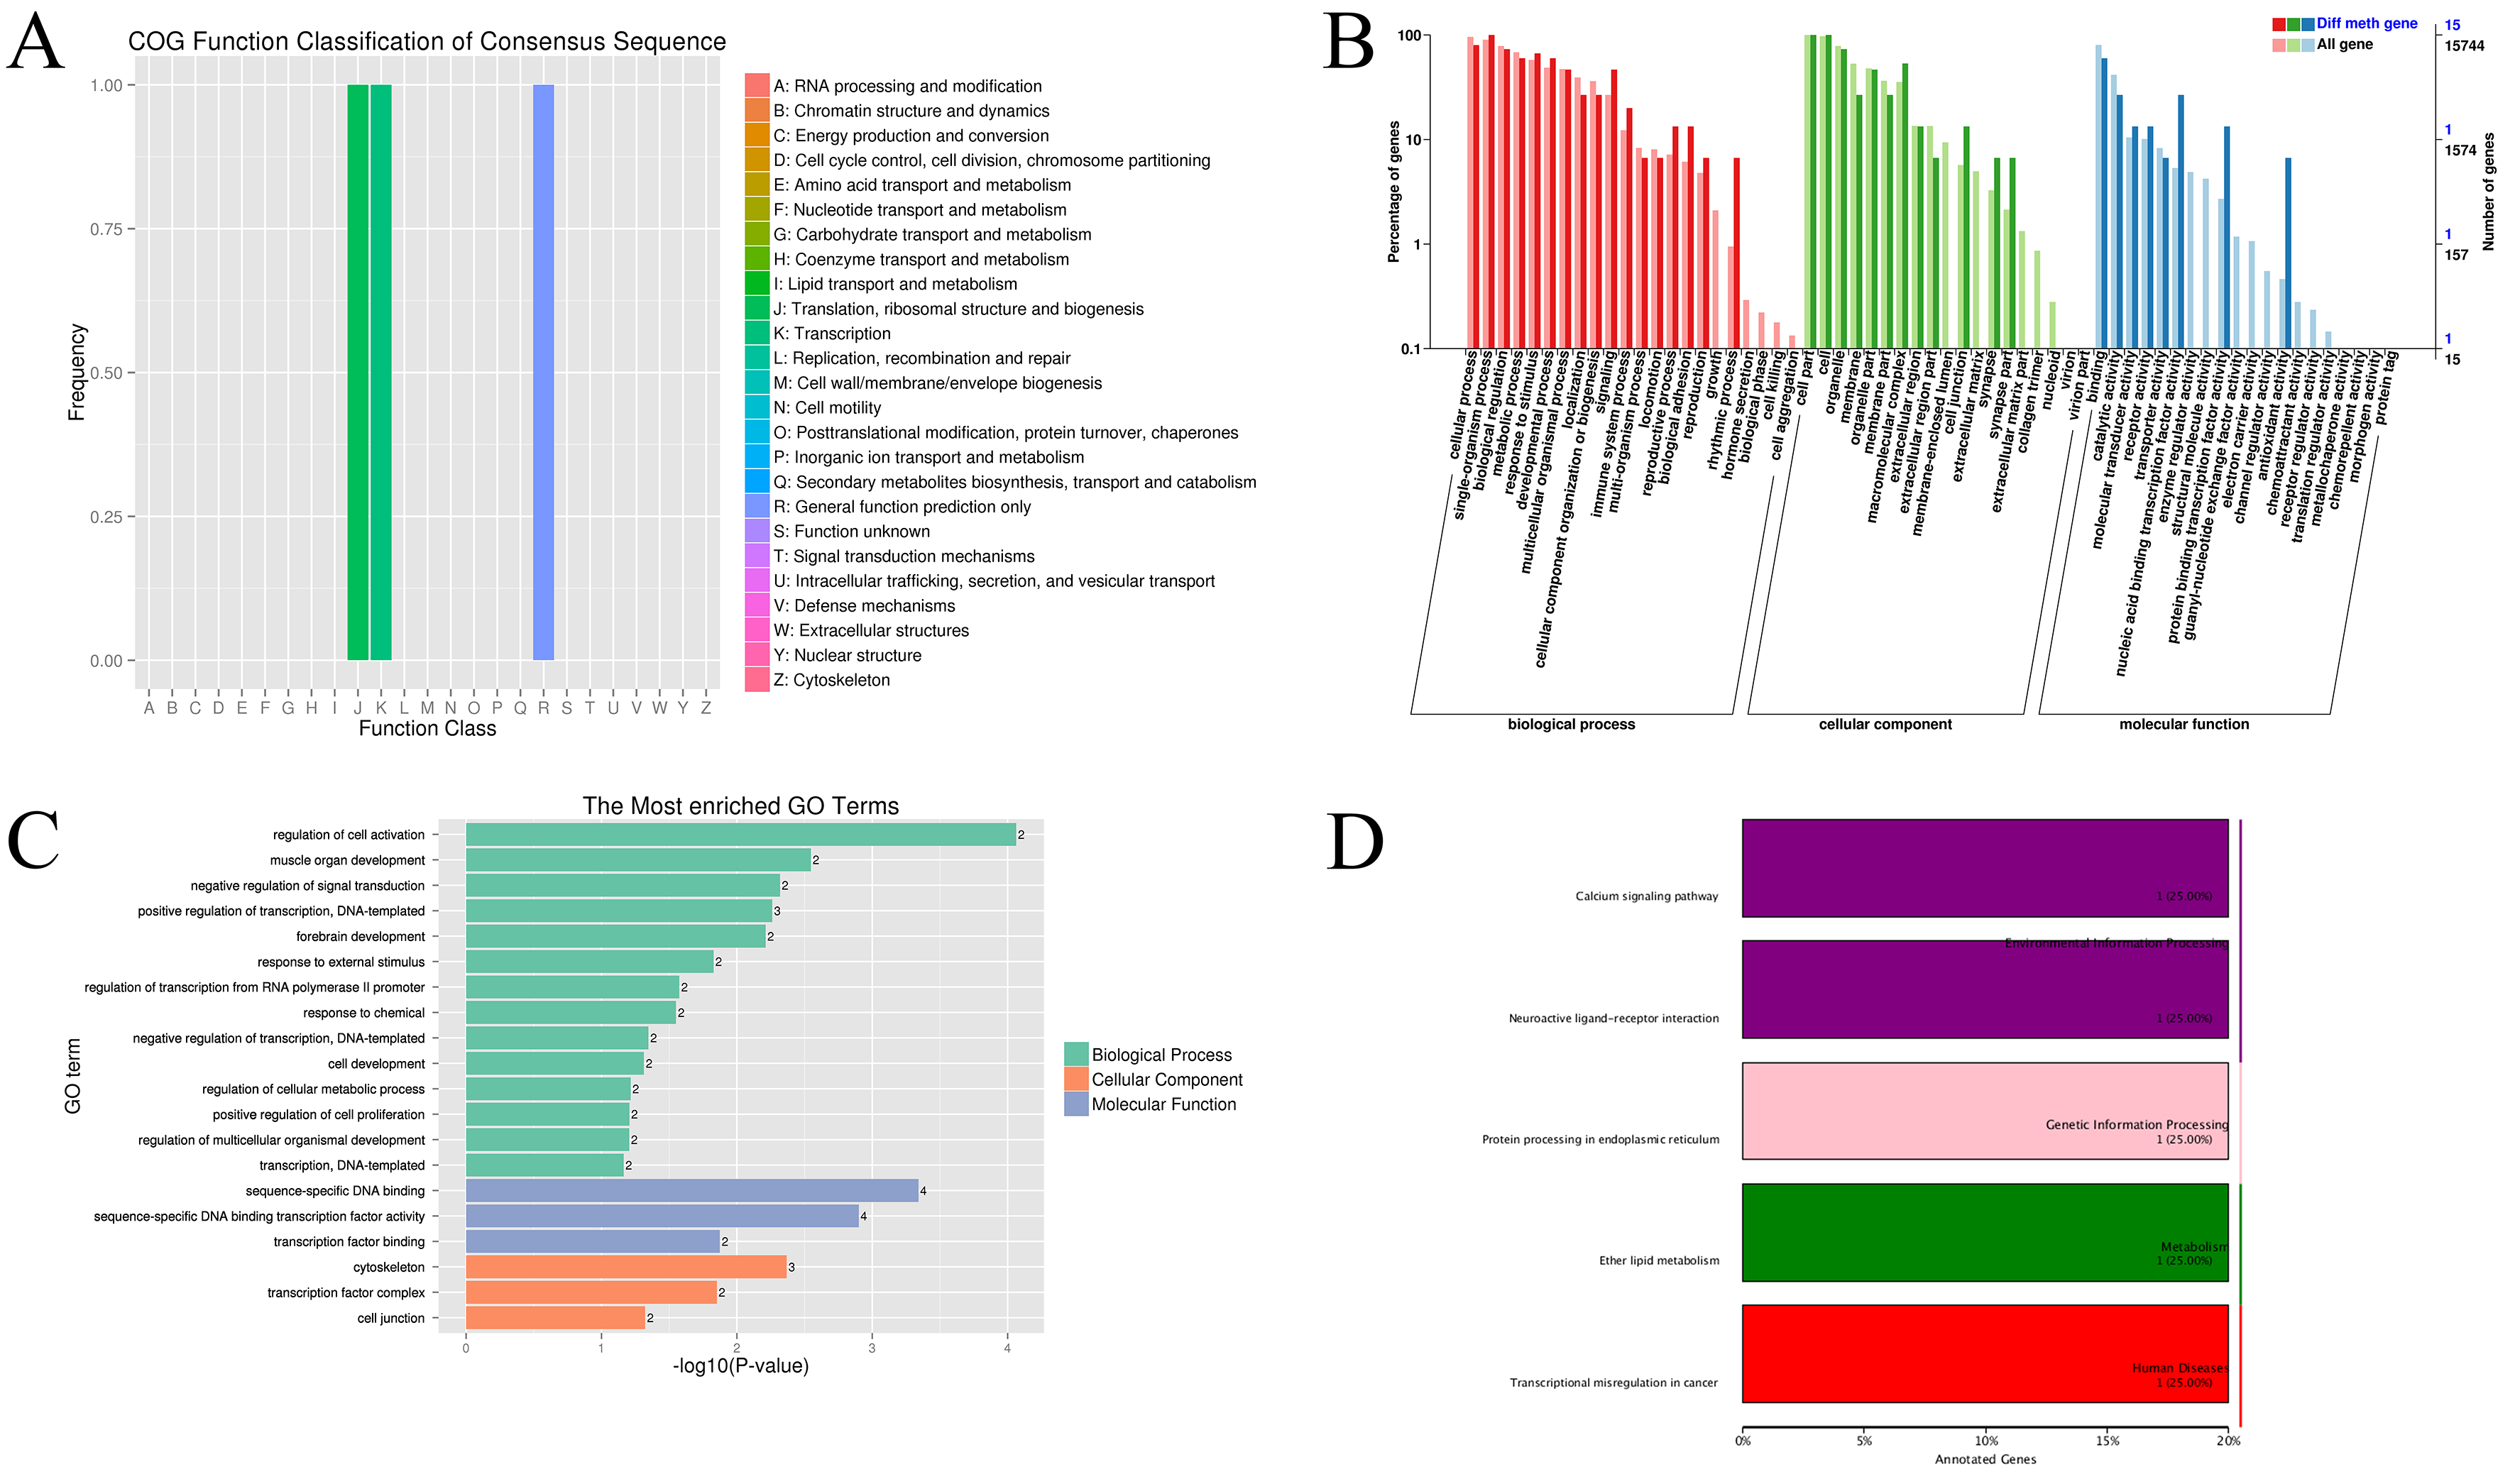
To probe changes in the methylation status of gene functions under prolificacy traits, the COG, GO and KEGG pathway databases were analysed to characterize the 12,832 DMGs that were detected in the DMRs. The COG analyses revealed that DMGs were enriched on general function prediction mostly for CG (Fig. 10a). The GO analysis revealed that for the CG type, DMGs were significantly enriched in the categories of cell migration, anatomical structure formation involved in morphogenesis, cell projection, and intracellular membrane-bounded organelle (Fig. 10b). The KEGG analysis revealed that for CG type, DMGs were significantly enriched in the categories mucin type O-Glycanbiosynthesis, long-term depression and nicotine addiction (Fig. 10c). Importantly, we also found that some DMGs were involved in biological processes important for female gonad development, including ovarian follicle development (GO: 0001541), ovulation from ovarian follicle (GO:0001542), antral ovarian follicle growth (GO:0001547), luteinization (GO:0001553), ovulation cycle process (GO:0022602), negative regulation of female gonad development (GO:2,000,195), which suggested that these specific genes, which are influenced by DNA methylation could affect the development of ovarian follicles, subsequently impacting ewes’ prolificacy. For more detailed results of the COG, GO, KEGG analyses of CG, CHG and CHH (see Additional files 7, 8, 9 and 10).
Fig. 10.
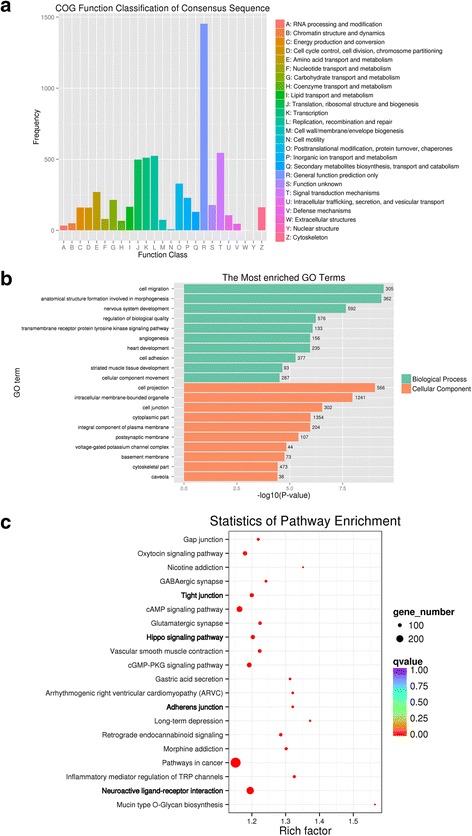
COG, top GO and top KEGG pathway analysis of CG type DMGs. a, COG analysis. b, top GO analysis. c, top KEGG analysis. In graph a, the abscissa represents the COG function classification; the ordinate represents the number of genes that were enriched in this classification. In graph b, the ordinate represents the GO terms that were the most enriched; the abscissa represents the P-value that was calculated using -log10-transformed values; the green and orange colors indicate biological process and cellular component. The size of the circles represent the number of genes contained in the particular class in the graph c, the larger the circle is, the more genes there are; Differently colored circles represent the enrichment degree of false positives, the redder the circle is, the lower is the false positive rate
Correlation analysis of DMGs and sheep prolificacy
To further understand the relationship between DNA methylation and different levels of prolificacy, we set two limiting factors to perform an association analysis. First, the DMGs of the two groups should be enriched in female reproduction related pathways in the GO analysis. Second, the pathway in KEGG (except for disease and cancer pathways) that was enriched for the selected DMGs should significantly differ between the two groups (P < 0.05). As a result, 28 genes meeting these two criteria were detected (more detailed information on these genes is listed in Additional file 11: Table S7). Subsequently, these genes were analyzed using the STRING database.
As Fig. 11 shows, within the network analysis, we focused on the DMGs that interacted with 5 or more other genes. BMP7, BMPR1B, CTNNB1, FST, FSHR, LHCGR, TGFB2, and TGFB3 are hub genes in the network, related to the female reproduction pathway. More detailed results on the abovementioned genes are listed in Table 2.
Fig. 11.
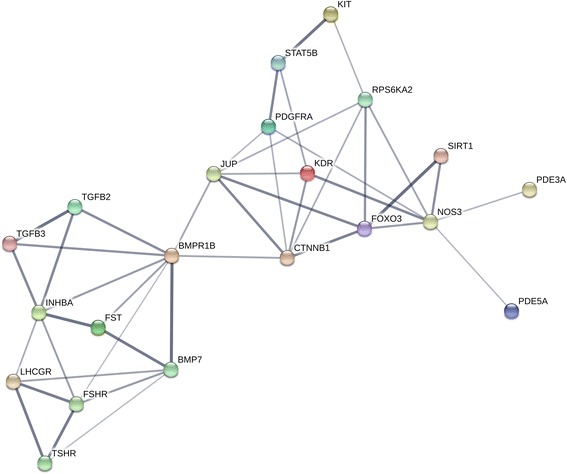
STRING analysis of DMGs associated with prolificacy. The detected DMGs were analyzed using the STRING database, with setting as follows: organism: Bos Taurus, interaction score: medium confidence, 1st shell: none/query proteins only, 2nd shell: none
Table 2.
DMGs most likely involved in female prolificacy pathways
| Gene Name | DMR | GO pathway | GO ID | KEGG Pathway | KO ID | ||
|---|---|---|---|---|---|---|---|
| location in chr | meth diff (LP vs HP) | P-value | |||||
| BMP7 | 13(58222103–58,222,185) | −0.243 | 4.71E-08 | menstrual cycle phase | GO:0022601 | TGF-beta signaling pathway | ko04350 |
| 13(58258207–58,258,215) | 0.203 | 8.29E-06 | Hippo signaling pathway | ko04390 | |||
| 13(58174539–58,174,596) | 0.218 | 0.000243 | Cytokine-cytokine receptor interaction | ko04060 | |||
| 13(58235661–58,235,840) | 0.344 | 3.01E-06 | |||||
| BMPR1B | 6(29427102–29,427,372) | −0.232 | 7.32E-05 | ovarian cumulus expansion | GO:0001550 | TGF-beta signaling pathway | ko04350 |
| 6(29490707–29,490,892) | 0.227 | 0.000308 | Hippo signaling pathway | ko04390 | |||
| 6(29297691–29,297,945) | 0.266 | 6.21E-06 | Cytokine-cytokine receptor interaction | ko04060 | |||
| CTNNB1 | 19(14002501–14,002,561) | −0.541 | 2.32E-10 | oocyte development | GO:0048599 | Hippo signaling pathway | ko04390 |
| 19(14008957–14,009,244) | −0.442 | 9.27E-14 | Adherens junction | ko04520 | |||
| 19(13978757–13,978,906) | −0.424 | 4.50E-20 | Tight junction | ko04530 | |||
| 19(13870396–13,870,492) | −0.409 | 9.06E-11 | Leukocyte transendothelial migration | ko04670 | |||
| 19(13826519–13,826,590) | −0.333 | 3.17E-10 | |||||
| 19(13831621–13,831,667) | −0.322 | 1.81E-11 | |||||
| 19(14018620–14,018,858) | −0.313 | 3.71E-07 | |||||
| 19(13959030–13,959,259) | −0.308 | 2.10E-14 | |||||
| 19(13989628–13,989,661) | −0.282 | 1.63E-06 | |||||
| 19(13882120–13,882,179) | −0.275 | 8.06E-08 | |||||
| 19(13959905–13,959,997) | −0.271 | 0.00168 | |||||
| 19(13993527–13,994,032) | −0.243 | 5.13E-11 | |||||
| 19(13685445–13,685,483) | −0.231 | 7.72E-05 | |||||
| 19(13675322–13,675,759) | 0.207 | 7.68E-07 | |||||
| 19(13676205–13,676,451) | 0.209 | 1.74E-05 | |||||
| 19(13706582–13,706,880) | 0.233 | 8.69E-07 | |||||
| 19(13853573–13,853,684) | 0.277 | 1.04E-07 | |||||
| 19(13793737–13,793,755) | 0.319 | 0.000111 | |||||
| 19(13707639–13,707,973) | 0.344 | 3.25E-07 | |||||
| 19(13682987–13,683,047) | 0.404 | 4.49E-08 | |||||
| 19(13815477–13,815,573) | 0.418 | 1.70E-06 | |||||
| 19(13708400–13,708,447) | 0.617 | 2.94E-26 | |||||
| FSHR | 3(75192698–75,192,705) | −0.371 | 2.39E-05 | primary ovarian follicle growth | GO:0001545 | cAMP signaling pathway | ko04024 |
| 3(75379496–75,379,558) | −0.365 | 1.81E-08 | Neuroactive ligand-receptor interaction | ko04080 | |||
| 3(74644092–74,644,099) | 0.154 | 8.92E-05 | |||||
| 3(74716438–74,716,537) | 0.213 | 9.40E-06 | |||||
| 3(75040358–75,040,859) | 0.218 | 9.66E-07 | |||||
| 3(75387483–75,387,659) | 0.224 | 0.000138 | |||||
| 3(75366395–75,366,601) | 0.226 | 5.29E-05 | |||||
| 3(75298678–75,298,880) | 0.249 | 3.49E-09 | |||||
| 3(75134625–75,134,944) | 0.257 | 6.08E-07 | |||||
| 3(74739631–74,739,782) | 0.352 | 3.21E-08 | |||||
| 3(75132060–75,132,090) | 0.402 | 9.62E-11 | |||||
| 3(75027605–75,027,609) | 0.466 | 1.72E-08 | |||||
| 3(75289648–75,289,665) | 0.483 | 2.63E-09 | |||||
| 3(75291188–75,291,243) | 0.625 | 9.79E-18 | |||||
| FST | 16(25647868–25,647,877) | −0.291 | 2.30E-06 | female gonad development | GO:0008585 | TGF-beta signaling pathway | ko04350 |
| LHCGR | 3(75688216–75,688,347) | −0.286 | 1.48E-05 | ovarian follicle development | GO:0001541 | Neuroactive ligand-receptor interaction | ko04080 |
| 3(75736243–75,736,624) | −0.214 | 1.87E-07 | |||||
| 3(75712912–75,712,941) | 0.209 | 0.00544 | |||||
| TGFB2 | 12(20040207–20,040,350) | 0.229 | 5.70E-08 | menstrual cycle phase | GO:0022601 | Cytokine-cytokine receptor interaction | ko04060 |
| 12(20044759–20,045,177) | 0.23 | 2.80E-05 | FoxO signaling pathway | ko04068 | |||
| 12(20286676–20,286,930) | 0.245 | 0.000418 | TGF-beta signaling pathway | ko04350 | |||
| 12(20300287–20,300,401) | 0.316 | 1.90E-06 | Hippo signaling pathway | ko04390 | |||
| 12(19982100–19,982,518) | 0.206 | 4.89E-09 | |||||
| 12(19995176–19,995,216) | 0.243 | 5.97E-07 | |||||
| 12(20020000–20,020,214) | 0.278 | 8.20E-11 | |||||
| TGFB3 | 7(84205818–84,206,098) | −0.205 | 0.000768 | menstrual cycle phase | GO:0022601 | Cytokine-cytokine receptor interaction | ko04060 |
| 7(84097027–84,097,093) | 0.217 | 0.000423 | FoxO signaling pathway | ko04068 | |||
| 7(84139476–84,139,762) | 0.227 | 8.22E-06 | TGF-beta signaling pathway | ko04350 | |||
| 7(84057073–84,057,143) | 0.24 | 4.51E-05 | Hippo signaling pathway | ko04390 | |||
| 7(84105957–84,106,089) | 0.262 | 0.000133 | |||||
| INHBA | 4:79,346,323–79,346,467 | 0.281 | 7.62E-06 | ovarian follicle development | GO:0001541 | TGF-beta signaling pathway | ko04350 |
| 4:79,358,172–79,358,309 | 0.2 | 1.35E-07 | positive regulation of ovulation | GO:0060279 | |||
| 4:79,364,290–79,364,421 | 0.223 | 1.30E-05 | |||||
| 4:79,410,632–79,410,649 | 0.433 | 3.46E-09 | |||||
| 4:79,467,732–79,468,003 | 0.286 | 0.000264 | |||||
| 4:79,470,908–79,471,096 | 0.324 | 8.99E-07 | |||||
| 4:79,511,040–79,511,072 | −0.227 | 0.00129 | |||||
| 4:79,522,334–79,522,542 | 0.553 | 1.75E-12 | |||||
| 4:79,524,739–79,524,926 | 0.346 | 1.16E-08 | |||||
| 4:79,544,088–79,544,103 | −0.309 | 1.46E-09 | |||||
| 4:79,554,774–79,554,784 | 0.334 | 4.59E-06 | |||||
| 4:79,568,886–79,568,895 | 0.545 | 1.61E-08 | |||||
| 4:79,580,604–79,580,858 | 0.643 | 6.50E-17 | |||||
| 4:79,581,799–79,582,035 | 0.507 | 6.30E-12 | |||||
| 4:79,595,470–79,595,497 | 0.625 | 1.59E-15 | |||||
| 4:79,601,022–79,601,037 | −0.129 | 9.26E-06 | |||||
| 4:79,605,844–79,606,024 | 0.465 | 5.60E-14 | |||||
| 4:79,658,524–79,658,656 | −0.28 | 0.000333 | |||||
| 4:79,658,703–79,658,930 | 0.206 | 0.000186 | |||||
| 4:79,794,804–79,794,808 | 0.385 | 1.32E-09 | |||||
| 4:79,818,557–79,818,672 | 0.266 | 6.96E-09 | |||||
| 4:79,821,799–79,821,883 | 0.403 | 7.91E-08 | |||||
| 4:79,823,656–79,823,864 | 0.47 | 1.76E-08 | |||||
| 4:79,829,698–79,829,729 | −0.222 | 0.0017 | |||||
| 4:79,836,260–79,836,367 | 0.56 | 5.75E-09 | |||||
| 4:79,968,621–79,968,690 | −0.37 | 1.87E-09 | |||||
| 4:80,049,783–80,050,296 | −0.254 | 4.52E-14 | |||||
| 4:80,063,788–80,063,855 | −0.244 | 1.31E-06 | |||||
| 4:80,085,854–80,085,996 | −0.223 | 4.88E-05 | |||||
| 4:80,150,315–80,150,500 | 0.274 | 2.37E-06 | |||||
| 4:80,157,514–80,157,656 | 0.475 | 6.14E-13 | |||||
| JUP | 11(41441802–41,442,083) | −0.22 | 0.000192 | oocyte development | GO:0048599 | ||
| 11(41458174–41,458,384) | 0.254 | 8.93E-07 | |||||
chr chromosome, DMR different methylated regions, meth diff the difference in methylation levels between HP and LP (LP vs HP); a positive number means the methylation levels of this region in the HP group are higher than those in the LP group, and a negative number means that the methylation levels of this region in the HP group are lower than those in the LP group, GO pathway The name of the GO term, GO ID The ID of the GO term, KEGG pathway The name of the KEGG pathway, KO ID The ID of the KEGG pathway
Discussion
DNA methylation is the main feature of the epigenetic regulatory mechanism that plays an important role in the regulation of gene expression. Recently, studies have been conducted to identify the genome-wide methylation profiles of farm animals [15–18]. Previously, some studies have been conducted to describe DNA methylation for sheep ovary [19–22], but few reports from the ovarian genome-wide methylation pattern [23]. WGBS, which allows unbiased genome wide DNA methylation profiling, has allowed us to investigate prolificacy related DNA methylation in unprecedented detail [9]. In this study, we used WGBS to investigate the DNA methylation profiles of the genome in ovarian tissues of high prolificacy and low prolificacy sheep to discover the relationship between DNA methylation and different levels of prolificacy. Further correlation analysis indicated that several DMR-related genes were most likely involved in Hu sheep prolificacy.
DNMTs are the writers of the epigenome. DNMTs constitute a highly conserved family of proteins in mammals, and there are 3 major DNMTs: DNMT1, DNMT3a and DNMT3b. DNMT1 is a maintenance DNMT, while DNMT3a and 3b are de novo DNMTs. Lynch et al. (2016) indicated that DNMT3a has broad downstream effects on the timing of the genomic control of reproductive function [24]. Our results showed that the mRNA expressions of DNMT1 and DNMT3a in ovary tissue were significantly lower in the HP group than that in the LP group, which indicated that DNMTs may regulate the transcription of genes associated with sheep prolificacy. In our study, approximately 3.5% of cytosine sites were methylated, and the CG methylation type was present in the highest proportion and at the highest level in the genome. These results were similar to those found in other species, including humans and pigs [17, 25]. Non-CpG information was also obtained in the present study, CAG was the most common sequence motif in the CHG mC sites, as also found in other studies [26], and the sequence motif in CHH differed between the two groups. The methylation levels near the TSS were the lowest of all the gene functional regions, which was consistent with the results found in pig ovaries by RRBS [27]. Most hypermethylation CGI (over 68%) were located in distal intergenic regions, while only 1.5% were in UTR.
As the DNA methylation status of promoter and gene body regions could affect gene expression thorough changes in chromatin structure or transcription efficiency [28, 29], we compared the genome-wide methylation patterns of the HP and LP sheep to identify DMGs that may affect prolificacy. We identified 71,271 DMRs and 12, 831 genes related to these DMRs were predicted, and 68.60% of the DMRs were located in distal intergenic regions, but only 0.27% of the DMRs were located in UTRs, a finding that was also similar to the previous research in pig ovary tissues by RRBS [27]. To further validate the sequencing results, qRT-PCR was performed to detect the mRNA expression of 10 randomly selected DMGs, the expression patterns of which were consistent with the sequencing data. Because DMGs such as ABCG2, mTOR, STK3, ACVR1 and PSMD7 may contain two or more DMRs, these did not show significant differences between the HP and LP groups in our study.
In our study, 11,520 of the 12,831 DMGs were enriched in three categories, as determined by GO analysis: biological processes, molecular function and cellular components. Strict conditions were followed to select the most likely DMR related genes involved in the regulation of ovarian functions. Eventually, we identified 10 eligible DMGs, compared with LP group, CTNNB1, FST, LHCGR, and TGFB3 were hypomethylated, and BMP7, BMPR1B, FSHR, TGFB2, INHBA and JUP were hypermethylated in the HP group. Moreover, the DMRs of these DMGs were all located in intron and distal intergenic regions in the genome. Recent evidence has shown that intragenic DNA methylation plays a role in the regulation of alternative splicing [30].
Key DMGs in the TGF-β superfamily
Bone morphogenetic proteins, which belong to the transforming growth factor β (TGFβ) superfamily, are known to have effects on reproduction. A mutation in the BMPR1B gene, called FecB, was the first major gene associated with prolificacy in sheep [31, 32]. Previously, it was also reported that highly prolific Booroola sheep have a mutation in the intracellular kinase domain of BMPR1B (ALK-6) which is expressed in both oocytes and granulosa cells, and is associated with hyper prolificacy of these ewes [31]. BMPR1B has an additive effect on ovulation rates and litter size in several sheep breeds [4]. BMP7 has been reported to have a significant role in ovarian folliculogenesis due to its expression from the time of committed follicles onward in rat thecal cells [33, 34], and BMP7 was shown to have the function of down-regulating StAR and progesterone production in human granulosa-lutein cells [35]. However, the information regarding how the TGFβ family alters mammalian reproduction through DNA methylation is limited. Our findings in Hu sheep also support the earlier reports, in which significant differences were found in the levels of hypermethylation BMPR1B and BMP7 genes in HP ovaries, and the pathways involving these genes were enriched in ovarian cumulus expansion and the menstrual cycle phase respectively. Moreover, using STRING analysis, we also found that BMPR1B was the hub of these reproduction related DMGs and correlated with BMP7, FSHR and LHCGR.
Key DMGs in Gonadotropin hormone
In our study, several DMGs related to hormone function, such as FSHR and FST, showed significant differences in methylation levels (FSHR and FST are up-regulated, and LHCGR is down-regulated) in ovary tissue from the HP group compared with that from the LP group, which may influence mRNA expressions of these genes. Earlier studies provided strong evidence that ovarian follicles lacking FSH or FSH receptors fail to progress to a preovulatory stage, resulting in infertility [36], and expression of the LHCGR at relatively high levels in granulosa cells was required for preovulatory follicles to respond to the midcycle surge of LH that promotes ovulation, oocyte maturation, and corpus luteum formation [37]. The relatively higher levels of expression were found for the transcripts of FSHR and LHCGR across ovaries and ovarian follicles in FecB carrier ewes [33]. FST has been considered to play an important role in ovarian development in species such as mice and pigs [38, 39]. FST secreted by granulosa cells specifically inhibits FSH biosynthesis and secretion. However, FST expression patterns show significant divergence among species; in our study, only one DMR (chr16:25,647,868–25,647,877 on the antisense strand, strong hypomethylation in the HP group) was related to FST and located in the distal intergenic region after the TSS, which indicated that the expression of FST may be influenced by this DMRs, just as intragenic DNA methylation status can down-regulate IGF2 gene expression in bovines [40]. Above all, changes in these gonadotropin receptor mRNA expression levels may determine follicular responses to gonadotropins thereby inducing the release of ovum.
Key DMGs in folliculogenesis and ovulation
In our study, several DMGs relating to folliculogenesis and ovulation were identified, including CTNNB1, INHBA and JUP. Previous studies have shown that CTNNB1 can facilitate FSH induced follicular growth and decreases follicle atresia, but that it negatively affects LH induced ovulation and luteinization in mice [41]. Moreover, it plays important roles in regulating patterning and morphogenesis that are related to adherent junctions and are required for gonadogenesis [42, 43], and similar results were also found in our study, moreover, the DMRs related to CTNNB1 were located in distal intergenic and intron regions (2nd, 4th, 5th of 36). INHBA expression was stimulated by BMP15 in granulosa cells from wild type ewes, and may play roles in the increased ovulation rates [44], and in our study, INHBA was correlated with FST, LHCGR, FSHR, BMPR1B, TGFB2 and TGFB3. Up to now, several studies have reported on the function of JUP in ovarian cancers [45–49], but information regarding JUP function in mammal reproduction has been limited, our study supports JUP as being related to oocyte development, as identified GO analysis, and two DMRs (chr11:41,441,802–41,442,083 on the antisense strand, strong hypomethylation in the HP group; chr11:41,458,174–41,458,384 on the antisense strand, strong hypermethylation in the HP group) were related to JUP and located in distal intergenic and intron regions respectively.
In summary, this study provides a comprehensive analysis of the DNA methylation profiles of Hu sheep ovaries for HP and LP ewes. We identified DMRs and genes associated with these regions. Pathway and network analyses of these DMRs revealed several candidate genes that may affect ovarian function including gonadotropin, folliculogenesis and ovulation. We will validate those DMR-related genes from this study in different stages of follicles development in the future. The results of this study might therefore provide novel clues for deciphering the epigenetic mechanisms of sheep ovarian function and will likely contribute to improving reproductive capacity.
Conclusion
This study revealed the global DNA methylation patterns of sheep ovaries associated with high and low prolificacy. We explained the differences in genomic DNA methylation between HP and LP sheep, and we observed that several DMRs/DMGs were most likely related to changes in Hu sheep prolificacy. Our results demonstrate that DNA methylation may contribute to a better understanding of epigenetic regulation in sheep reproductive capacity.
Additional files
Primer information for qRT-PCR. (DOCX 22 kb)
Plot of genome chromosome 5-methylcytosine map. A, CG type. B, CHG type. C, CHH type. H = A, C or T. The methylation levels of each window are described using colors (the redder the window is, higher is the methylation level; the greener the window is, the lower is the methylation level). HP (J07, J08, J09), High Prolificacy. LP (J10, J11, J12), Low Prolificacy. (PNG 14 mb)
The rates of methylcytosine in gene functional elements in the HP group and the LP group. (XLSX 10 kb)
DNA methylation levels in gene functional elements in the HP group and the LP group. (DOCX 22 kb)
Information of DMRs in HP and LP. methChr: the chromosome the DMR is located. start: the start site of the DMR island in the chromosome. end: the end site of the DMR in the chromosome. width: the length of the DMR. methDif: the different levels of DMR between the LP and the HP groups. Annotation: the type of DMR in gene functional elements. geneStrand: + is the sense strand, - is the antisense strand. methType: the methylation type of the DMR. geneId: the gene number which the DMR is related. (XLSX 4 mb).
Information about the methylation tendency of the chosen DMGs and the mRNA expression of the corresponding gene for the two groups. CGI_start: the start site of the CpG island in the chromosome. CGI_end: the end site of the CpG island in the chromosome. CGI_width: the length of the CpG island. strand: * the gene strand in which the DMR is located. methDif: the different levels of DMR between the LP and the HP groups. Annotation: the type of DMR in gene functional elements. geneStrand: + is the sense strand, - is the antisense strand. meth_direction: the direction of the methylation difference for DMRs (LP vs HP). exp_direction: the direction of the expression difference for DMGs (LP vs HP). (XLSX 14 kb)
GO and KEGG pathway analysis in CG type DMGs. A, GO analysis. C, KEGG analysis. (PNG 4 mb)
COG, GO and KEGG pathway analysis in CHG-type DMGs. A, COG analysis. B, GO analysis. C, top GO. D, KEGG analysis. (PNG 3 mb)
COG, GO and KEGG pathway analysis in CHH-type DMGs. A, COG analysis. B, GO analysis. C, top GO. D, KEGG analysis. E, top KEGG. (PNG 5 mb)
Information about the COG, GO and KEGG analyses of DMGs. (XLSX 2 mb)
DMGs that were selected under strict conditions. (DOCX 24kb)
Acknowledgments
We thank all members of the Jiangsu Livestock Embryo Engineering Laboratory for stimulating discussions.
Funding
This work was financially supported by the Key Research and Development Program of Jiangsu Province (NO.BE2015362), China Agriculture Research System (NO.CARS-38) and Chinese Fundamental Research Funds for the Central Universities(KYDK201702).
Availability of data and materials
Additional data can be found in supplementary files.
Abbreviations
- ACVR1
Activin A receptor type 1
- BACH1
BTB domain and CNC homolog 1
- BMP7
Bone morphogenetic protein 7 precursor
- BMPR1B
Bone morphogenetic protein receptor type 1B
- CDIPT
CDP-diacylglycerol--inositol 3-phosphatidyltransferase
- CGI
CG island
- chr
chromosome
- COG
Cluster of orthologous groups of proteins
- CTNNB1
Catenin (cadherin-associated protein), beta 1
- DMGs
Differential methylated regions related genes
- DMRs
Differential methylated regions
- DNMT1
DNA methyltransferase 1
- DNMT3a
DNA methyltransferase 3 alpha
- DNMT3b
DNA methyltransferase 3 beta
- DNMTs
DNA methyltransferases
- ELK4
ETS transcription factor
- FDR
False discovery rate
- FSHR
Follicle-stimulating hormone receptor precursor
- FST
Follistatin
- GAPDH
Glyceraldehyde-3-phosphate dehydrogenase
- GO
Gene ontology
- GPNMB
Glycoprotein nmb
- HP
High prolificacy group
- IGF2
Insulin like growth factor 2
- INHBA
Inhibin beta A subunit
- JUP
Junction plakoglobin
- KEGG
Kyoto encyclopedia of genes and genomes
- LHCGR
Luteinizing hormone/choriogonadotropin receptor
- LP
Low prolificacy group
- mC
Methylated cytosine
- mTOR
Mechanistic target of rapamycin
- PSMD7
Proteasome 26S subunit: non-ATPase 7
- qRT-PCR
Quantitative reverse transcriptase PCR
- RRBS
Representation bisulfite sequencing
- StAR
Proteasome 26S subunit, non-ATPase 7
- STK3
Serine/threonine kinase 3
- TGFB2
Transforming growth factor beta 2
- TGFB3
Transforming growth factor beta 3
- TGFβ
Transforming growth factor beta
- TSS
Transcription start site
- UTR
Untranslated regions
- WGBS
Whole-genome bisulfite sequencing
Authors’ contributions
ZYL and LFZ conceived of the study, participated in its design and coordination and drafted the manuscript; FX and ZGM performed the experiment preparations; YH, ZTT and PJ conducted qRT-PCR validation; WZY and HL carried out the analysis of data and revised the manuscript critically for important intellectual content; ZYL and WF participated in the design and coordination and helped to draft the manuscript and provided the fund. All authors read and approved the final manuscript.
Ethics approval
All experimental procedures were conducted in strict compliance with the recommendations of the Guide for Animal Experiments of Nanjing Agricultural University, China and were approved by the Animal Care and Use Committee of Nanjing Agricultural University, China (Approval ID: SYXK2011–0036). All efforts were made to minimize animal suffering. Animal was provided and fed by Hailun sheep breeding farm in Jiangsu, China.
Consent for publication
Not applicable.
Competing interests
The authors declare that they have no competing interests.
Publisher’s Note
Springer Nature remains neutral with regard to jurisdictional claims in published maps and institutional affiliations.
Footnotes
Electronic supplementary material
The online version of this article (doi:10.1186/s12864-017-4068-9) contains supplementary material, which is available to authorized users.
References
- 1.He XJ, Chen T, Zhu JK. Regulation and function of DNA methylation in plants and animals. Cell Res. 2011;21(3):442. doi: 10.1038/cr.2011.23. [DOI] [PMC free article] [PubMed] [Google Scholar]
- 2.Guo H, Zhu P, Yan L, Li R, Hu B, Lian Y, Yan J, Ren X, Lin S, Li J, et al. The DNA methylation landscape of human early embryos. Nature. 2014;511(7511):606–610. doi: 10.1038/nature13544. [DOI] [PubMed] [Google Scholar]
- 3.Agius F, Kapoor A, Zhu JK. Role of the Arabidopsis DNA glycosylase/lyase ROS1 in active DNA demethylation. Proc Natl Acad Sci U S A. 2006;103(31):11796–11801. doi: 10.1073/pnas.0603563103. [DOI] [PMC free article] [PubMed] [Google Scholar]
- 4.Abdoli R, Zamani P, Mirhoseini SZ, Ghavi Hossein-Zadeh N, Nadri S. A review on prolificacy genes in sheep. Reprod Domest Anim. 2016;51(5):631–637. doi: 10.1111/rda.12733. [DOI] [PubMed] [Google Scholar]
- 5.Lomniczi A, Loche A, Castellano JM, Ronnekleiv OK, Bosch M, Kaidar G, Knoll JG, Wright H, Pfeifer GP, Ojeda SR. Epigenetic control of female puberty. Nat Neurosci. 2013;16(3):281–289. doi: 10.1038/nn.3319. [DOI] [PMC free article] [PubMed] [Google Scholar]
- 6.Lomniczi A, Wright H, Ojeda SR. Epigenetic regulation of female puberty. Front Neuroendocrinol. 2015;36:90–107. doi: 10.1016/j.yfrne.2014.08.003. [DOI] [PMC free article] [PubMed] [Google Scholar]
- 7.Yuan XL, Gao N, Xing Y, Zhang HB, Zhang AL, Liu J, He JL, Xu Y, Lin WM, Chen ZM. Profiling the genome-wide DNA methylation pattern of porcine ovaries using reduced representation bisulfite sequencing. Sci Rep. 2015;6:22138. doi: 10.1038/srep22138. [DOI] [PMC free article] [PubMed] [Google Scholar]
- 8.Yang C, Ye J, Li X, Gao X, Zhang K, Luo L, Ding J, Zhang Y, Li Y, Cao H, et al. DNA Methylation patterns in the hypothalamus of female pubertal goats. PLoS One. 2016;11(10):e0165327. doi: 10.1371/journal.pone.0165327. [DOI] [PMC free article] [PubMed] [Google Scholar]
- 9.Kurdyukov S, Bullock M. DNA Methylation analysis: choosing the right method. Biology (Basel). 2016;5(1) [DOI] [PMC free article] [PubMed]
- 10.Sun D, Xi Y, Rodriguez B, Park HJ, Tong P, Meong M, Goodell MA, Li W. MOABS: model based analysis of bisulfite sequencing data. Genome Biol. 2014;15(2):R38. doi: 10.1186/gb-2014-15-2-r38. [DOI] [PMC free article] [PubMed] [Google Scholar]
- 11.Schultz MD, Schmitz RJ. Ecker JR: 'Leveling' the playing field for analyses of single-base resolution DNA methylomes. Trends Genet. 2012;28(12):583. doi: 10.1016/j.tig.2012.10.012. [DOI] [PMC free article] [PubMed] [Google Scholar]
- 12.Young MD, Wakefield MJ, Smyth GK, Oshlack A. Gene ontology analysis for RNA-seq: accounting for selection bias. Genome Biol. 2010;11(2):1–12. doi: 10.1186/gb-2010-11-2-r14. [DOI] [PMC free article] [PubMed] [Google Scholar]
- 13.Mao X, Cai T, Olyarchuk JG, Wei L. Automated genome annotation and pathway identification using the KEGG Orthology (KO) as a controlled vocabulary. Bioinformatics. 2005;21(19):3787–3793. doi: 10.1093/bioinformatics/bti430. [DOI] [PubMed] [Google Scholar]
- 14.Franceschini A, Szklarczyk D, Frankild S, Kuhn M, Simonovic M, Roth A, Lin J, Minguez P, Bork P, Mering CV. STRING v9.1: protein-protein interaction networks, with increased coverage and integration. Nucleic Acids Res. 2013;41(Database issue):808–815. doi: 10.1093/nar/gks1094. [DOI] [PMC free article] [PubMed] [Google Scholar]
- 15.Hu Y, Xu H, Li Z, Zheng X, Jia X, Nie Q, Zhang X. Comparison of the genome-wide DNA methylation profiles between fast-growing and slow-growing broilers. PLoS One. 2013;8(2):e56411. doi: 10.1371/journal.pone.0056411. [DOI] [PMC free article] [PubMed] [Google Scholar]
- 16.Xu J, Bao X, Peng Z, Wang L, Du L, Niu W, Sun Y. Comprehensive analysis of genome-wide DNA methylation across human polycystic ovary syndrome ovary granulosa cell. Oncotarget. 2016;7(19):27899-909. [DOI] [PMC free article] [PubMed]
- 17.Hao Y, Cui Y, Gu X. Genome-wide DNA methylation profiles changes associated with constant heat stress in pigs as measured by bisulfite sequencing. Sci Rep. 2016;6:27507. doi: 10.1038/srep27507. [DOI] [PMC free article] [PubMed] [Google Scholar]
- 18.Zhang D, Cong J, Shen H, Wu Q, Wu X. Genome-wide identification of aberrantly methylated promoters in ovarian tissue of prenatally androgenized rats. Fertil Steril. 2014;102(5):1458–1467. doi: 10.1016/j.fertnstert.2014.07.1203. [DOI] [PubMed] [Google Scholar]
- 19.Russo V, Bernabo N, Di Giacinto O, Martelli A, Mauro A, Berardinelli P, Curini V, Nardinocchi D, Mattioli M, Barboni B. H3K9 trimethylation precedes DNA methylation during sheep oogenesis: HDAC1, SUV39H1, G9a, HP1, and Dnmts are involved in these epigenetic events. J Histochem Cytochem. 2013;61(1):75–89. doi: 10.1369/0022155412463923. [DOI] [PMC free article] [PubMed] [Google Scholar]
- 20.Barboni B, Russo V, Cecconi S, Curini V, Colosimo A, Garofalo ML, Capacchietti G, Di Giacinto O, Mattioli M. In vitro grown sheep preantral follicles yield oocytes with normal nuclear-epigenetic maturation. PLoS One. 2011;6(11):e27550. doi: 10.1371/journal.pone.0027550. [DOI] [PMC free article] [PubMed] [Google Scholar]
- 21.Colosimo A, Di Rocco G, Curini V, Russo V, Capacchietti G, Berardinelli P, Mattioli M, Barboni B. Characterization of the methylation status of five imprinted genes in sheep gametes. Anim Genet. 2009;40(6):900–908. doi: 10.1111/j.1365-2052.2009.01939.x. [DOI] [PubMed] [Google Scholar]
- 22.Russo V, Martelli A, Berardinelli P, Di Giacinto O, Bernabo N, Fantasia D, Mattioli M, Barboni B. Modifications in chromatin morphology and organization during sheep oogenesis. Microsc Res Tech. 2007;70(8):733–744. doi: 10.1002/jemt.20462. [DOI] [PubMed] [Google Scholar]
- 23.Cao J, Wei C, Zhang S, Capellini TD, Zhang L, Zhao F, Li L, Zhong T, Wang L, Du L. Screening of reproduction-related single-nucleotide variations from MeDIP-seq data in sheep. Mol Reprod Dev. 2016;83(11):958. doi: 10.1002/mrd.22734. [DOI] [PubMed] [Google Scholar]
- 24.Lynch EW, Coyle CS, Lorgen M, Campbell EM, Bowman AS, Stevenson TJ. Cyclical DNA Methyltransferase 3a expression is a seasonal and Estrus timer in reproductive tissues. Endocrinology. 2016;157(6):2469–2478. doi: 10.1210/en.2015-1988. [DOI] [PubMed] [Google Scholar]
- 25.Lister R, Pelizzola M, Kida YS, Hawkins RD, Nery JR, Hon G, Antosiewiczbourget J, O'Malley R, Castanon R, Klugman S. Hotspots of aberrant epigenomic reprogramming in human induced pluripotent stem cells. Nature. 2014;514(7520):68–73. doi: 10.1038/nature13843. [DOI] [PMC free article] [PubMed] [Google Scholar]
- 26.Zhang S, Qin C, Cao G, Guo L, Feng C, Zhang W. Genome-wide Analysis of DNA Methylation Profiles in a Senescence-accelerated Mouse Prone 8 Brain using Whole-genome Bisulfite Sequencing. Bioinformatics. 2017;33(11):1591–95. doi: 10.1093/bioinformatics/btx051. [DOI] [PubMed] [Google Scholar]
- 27.Yuan XL, Gao N, Xing Y, Zhang HB, Zhang AL, Liu J, He JL, Xu Y, Lin WM, Chen ZM, et al. Profiling the genome-wide DNA methylation pattern of porcine ovaries using reduced representation bisulfite sequencing. Sci Rep. 2016;6:22138. doi: 10.1038/srep22138. [DOI] [PMC free article] [PubMed] [Google Scholar]
- 28.Lorincz MC, Dickerson DR, Schmitt M, Groudine M. Intragenic DNA methylation alters chromatin structure and elongation efficiency in mammalian cells. Nat Struct Mol Biol. 2004;11(11):1068–1075. doi: 10.1038/nsmb840. [DOI] [PubMed] [Google Scholar]
- 29.Klose RJ, Bird AP. Genomic DNA methylation: the mark and its mediators. Trends Biochem Sci. 2006;31(2):89–97. doi: 10.1016/j.tibs.2005.12.008. [DOI] [PubMed] [Google Scholar]
- 30.Wang W, Zhang T, Wang J, Zhang G, Wang Y, Zhang Y, Zhang J, Li G, Xue Q, Han K, et al. Genome-wide association study of 8 carcass traits in Jinghai yellow chickens using specific-locus amplified fragment sequencing technology. Poult Sci. 2016;95(3):500–506. doi: 10.3382/ps/pev266. [DOI] [PMC free article] [PubMed] [Google Scholar]
- 31.Wilson T, Wu XY, Juengel JL, Ross IK, Lumsden JM, Lord EA, Dodds KG, Walling GA, Mcewan JC, O'Connell AR. Highly prolific Booroola sheep have a mutation in the intracellular kinase domain of bone morphogenetic protein IB receptor (ALK-6) that is expressed in both oocytes and granulosa cells. Biol Reprod. 2001;64(4):1225–1235. doi: 10.1095/biolreprod64.4.1225. [DOI] [PubMed] [Google Scholar]
- 32.Mulsant P, Lecerf F, Fabre S, Schibler L, Monget P, Lanneluc I, Pisselet C, Riquet J, Monniaux D, Callebaut I. Mutation in bone morphogenetic protein receptor-IB is associated with increased ovulation rate in Booroola Mérino ewes. Proc Natl Acad Sci. 2001;98(9):5104. doi: 10.1073/pnas.091577598. [DOI] [PMC free article] [PubMed] [Google Scholar]
- 33.Goyal S, Aggarwal J, Dubey PK, Mishra BP, Ghalsasi P, Nimbkar C, Joshi BK, Kataria RS. Expression analysis of genes associated with prolificacy in FecB carrier and noncarrier Indian sheep. Anim Biotechnol. 2017;28(3):220–7. doi: 10.1080/10495398.2016.1262869. [DOI] [PubMed] [Google Scholar]
- 34.Erickson GF, Shimasaki S. The spatiotemporal expression pattern of the bone morphogenetic protein family in rat ovary cell types during the estrous cycle. Reprod Biol Endocrinol. 2003;1(1):1–20. doi: 10.1186/1477-7827-1-9. [DOI] [PMC free article] [PubMed] [Google Scholar]
- 35.Zhang H, Klausen C, Zhu H, Chang HM, Leung PC. BMP4 and BMP7 suppress StAR and progesterone production via ALK3 and SMAD1/5/8-SMAD4 in human Granulosa-Lutein cells. Endocrinology. 2015;156(11):en20151494. doi: 10.1210/en.2015-1494. [DOI] [PubMed] [Google Scholar]
- 36.George JW, Dille EA, Heckert LL. Current concepts of follicle-stimulating hormone receptor gene regulation. Biol Reprod. 2011;84(1):7–17. doi: 10.1095/biolreprod.110.085043. [DOI] [PMC free article] [PubMed] [Google Scholar]
- 37.Law NC, Weck J, Kyriss B, Nilson JH. M H-D: Lhcgr expression in granulosa cells: roles for PKA-phosphorylated β-catenin, TCF3, and FOXO1. Mol Endocrinol. 2013;27(8):1295. doi: 10.1210/me.2013-1025. [DOI] [PMC free article] [PubMed] [Google Scholar]
- 38.Zhou Q, Wan M, Wei Q, Song Q, Xiong L, Huo J, Huang J. Expression, regulation, and functional characterization of FST gene in porcine Granulosa cells. Anim Biotechnol. 2016;27(4):295. doi: 10.1080/10495398.2016.1184675. [DOI] [PubMed] [Google Scholar]
- 39.Kimura F, Bonomi LM, Schneyer AL. Follistatin regulates germ cell Nest breakdown and primordial follicle formation. Endocrinology. 2011;152(2):697–706. doi: 10.1210/en.2010-0950. [DOI] [PMC free article] [PubMed] [Google Scholar]
- 40.Huang YZ, Zhan ZY, Sun YJ, Cao XK, Li MX, Wang J, Lan XY, Lei CZ, Zhang CL, Chen H. Intragenic DNA methylation status down-regulates bovine IGF2 gene expression in different developmental stages. Gene. 2014;534(2):356–361. doi: 10.1016/j.gene.2013.09.111. [DOI] [PubMed] [Google Scholar]
- 41.Fan HY, O'Connor A, Shitanaka M, Shimada M, Liu Z, Richards JS. Beta-catenin (CTNNB1) promotes preovulatory follicular development but represses LH-mediated ovulation and luteinization. Mol Endocrinol. 2010;24(8):1529–1542. doi: 10.1210/me.2010-0141. [DOI] [PMC free article] [PubMed] [Google Scholar]
- 42.Chassot AA, Gillot I, Chaboissier MC. R-spondin1, WNT4, and the CTNNB1 signaling pathway: strict control over ovarian differentiation. Reproduction. 2014;148(6):R97–110. doi: 10.1530/REP-14-0177. [DOI] [PubMed] [Google Scholar]
- 43.Fleming A. Membrane β-catenin and adherens junctions in early gonadal patterning. Dev Dyn. 2012;241(11):1782–1798. doi: 10.1002/dvdy.23870. [DOI] [PMC free article] [PubMed] [Google Scholar]
- 44.Estienne A, Lahoz B, Jarrier P, Bodin L, Folch J, Alabart JL, Fabre S, Monniaux D. BMP15 regulates the inhibin/activin system independently of ovulation rate control in sheep. Reproduction. 2017;153(4):395–404. doi: 10.1530/REP-16-0507. [DOI] [PubMed] [Google Scholar]
- 45.Salerno EP, Bedognetti D, Mauldin IS, Deacon DH, Shea SM, Pinczewski J, Obeid JM, Coukos G, Wang E, Gajewski TF, et al. Human melanomas and ovarian cancers overexpressing mechanical barrier molecule genes lack immune signatures and have increased patient mortality risk. Oncoimmunology. 2016;5(12):e1240857. doi: 10.1080/2162402X.2016.1240857. [DOI] [PMC free article] [PubMed] [Google Scholar]
- 46.Faleiro-Rodrigues C, Macedo-Pinto IM, Maia SS, Vieira RH, Lopes CS. Biological relevance of E-cadherin-catenin complex proteins in primary epithelial ovarian tumours. Gynecol Obstet Investig. 2005;60(2):75–83. doi: 10.1159/000084614. [DOI] [PubMed] [Google Scholar]
- 47.Faleiro-Rodrigues C, Macedo-Pinto I, Pereira D, Lopes CS. Loss of beta-catenin is associated with poor survival in ovarian carcinomas. Int J Gynecol Pathol. 2004;23(4):337–346. doi: 10.1097/01.pgp.0000139711.22158.14. [DOI] [PubMed] [Google Scholar]
- 48.Ueda M, Gemmill RM, West J, Winn R, Sugita M, Tanaka N, Ueki M, Drabkin HA. Mutations of the beta- and gamma-catenin genes are uncommon in human lung, breast, kidney, cervical and ovarian carcinomas. Br J Cancer. 2001;85(1):64–68. doi: 10.1054/bjoc.2001.1863. [DOI] [PMC free article] [PubMed] [Google Scholar]
- 49.Davidson B, Berner A, Nesland JM, Risberg B, Berner HS, Trope CG, Kristensen GB, Bryne M, Ann Florenes V. E-cadherin and alpha-, beta-, and gamma-catenin protein expression is up-regulated in ovarian carcinoma cells in serous effusions. J Pathol. 2000;192(4):460–469. doi: 10.1002/1096-9896(2000)9999:9999<::AID-PATH726>3.0.CO;2-M. [DOI] [PubMed] [Google Scholar]
Associated Data
This section collects any data citations, data availability statements, or supplementary materials included in this article.
Supplementary Materials
Primer information for qRT-PCR. (DOCX 22 kb)
Plot of genome chromosome 5-methylcytosine map. A, CG type. B, CHG type. C, CHH type. H = A, C or T. The methylation levels of each window are described using colors (the redder the window is, higher is the methylation level; the greener the window is, the lower is the methylation level). HP (J07, J08, J09), High Prolificacy. LP (J10, J11, J12), Low Prolificacy. (PNG 14 mb)
The rates of methylcytosine in gene functional elements in the HP group and the LP group. (XLSX 10 kb)
DNA methylation levels in gene functional elements in the HP group and the LP group. (DOCX 22 kb)
Information of DMRs in HP and LP. methChr: the chromosome the DMR is located. start: the start site of the DMR island in the chromosome. end: the end site of the DMR in the chromosome. width: the length of the DMR. methDif: the different levels of DMR between the LP and the HP groups. Annotation: the type of DMR in gene functional elements. geneStrand: + is the sense strand, - is the antisense strand. methType: the methylation type of the DMR. geneId: the gene number which the DMR is related. (XLSX 4 mb).
Information about the methylation tendency of the chosen DMGs and the mRNA expression of the corresponding gene for the two groups. CGI_start: the start site of the CpG island in the chromosome. CGI_end: the end site of the CpG island in the chromosome. CGI_width: the length of the CpG island. strand: * the gene strand in which the DMR is located. methDif: the different levels of DMR between the LP and the HP groups. Annotation: the type of DMR in gene functional elements. geneStrand: + is the sense strand, - is the antisense strand. meth_direction: the direction of the methylation difference for DMRs (LP vs HP). exp_direction: the direction of the expression difference for DMGs (LP vs HP). (XLSX 14 kb)
GO and KEGG pathway analysis in CG type DMGs. A, GO analysis. C, KEGG analysis. (PNG 4 mb)
COG, GO and KEGG pathway analysis in CHG-type DMGs. A, COG analysis. B, GO analysis. C, top GO. D, KEGG analysis. (PNG 3 mb)
COG, GO and KEGG pathway analysis in CHH-type DMGs. A, COG analysis. B, GO analysis. C, top GO. D, KEGG analysis. E, top KEGG. (PNG 5 mb)
Information about the COG, GO and KEGG analyses of DMGs. (XLSX 2 mb)
DMGs that were selected under strict conditions. (DOCX 24kb)
Data Availability Statement
Additional data can be found in supplementary files.