Significance
Despite advances in targeted cancer treatments, we still lack methods to predict how a specific cancer will respond to a given therapy. As a consequence, patients go through rounds of trial-and-error approaches based on guidelines to find the best treatment, often subjected to unnecessary toxicity. Using cell lines, we used zebrafish larvae xenografts as sensors for cancer behavior and therapy guideline screening. Our data show not only sufficient resolution to distinguish functional tumor behaviors in just 4 days but also differential sensitivity to colorectal cancer therapy. As proof-of-principle, we provide evidence for similar behavior response to therapies in patients as in zebrafish patient-derived xenografts. Altogether, our results suggest zebrafish larvae xenografts as a promising in vivo screening platform for precision medicine.
Keywords: zebrafish xenograft, chemotherapy functional screening, colorectal cancer, KRAS, patient derived xenografts
Abstract
Cancer is as unique as the person fighting it. With the exception of a few biomarker-driven therapies, patients go through rounds of trial-and-error approaches to find the best treatment. Using patient-derived cell lines, we show that zebrafish larvae xenotransplants constitute a fast and highly sensitive in vivo model for differential therapy response, with resolution to reveal intratumor functional cancer heterogeneity. We screened international colorectal cancer therapeutic guidelines and determined distinct functional tumor behaviors (proliferation, metastasis, and angiogenesis) and differential sensitivities to standard therapy. We observed a general higher sensitivity to FOLFIRI [5-fluorouracil(FU)+irinotecan+folinic acid] than to FOLFOX (5-FU+oxaliplatin+folinic acid), not only between isogenic tumors but also within the same tumor. We directly compared zebrafish xenografts with mouse xenografts and show that relative sensitivities obtained in zebrafish are maintained in the rodent model. Our data also illustrate how KRAS mutations can provide proliferation advantages in relation to KRASWT and how chemotherapy can unbalance this advantage, selecting for a minor clone resistant to chemotherapy. Zebrafish xenografts provide remarkable resolution to measure Cetuximab sensitivity. Finally, we demonstrate the feasibility of using primary patient samples to generate zebrafish patient-derived xenografts (zPDX) and provide proof-of-concept experiments that compare response to chemotherapy and biological therapies between patients and zPDX. Altogether, our results suggest that zebrafish larvae xenografts constitute a promising fast assay for precision medicine, bridging the gap between genotype and phenotype in an in vivo setting.
Chemotherapy regimens are developed and approved according to a demonstration of average efficacy and safety. However, efficacy rates are averages of individual responses. As a result of this “one-size-fits-all” approach, treatments may prove to be successful for some patients but not for others. This is especially relevant in the metastatic scenario where oncology therapy guidelines reach branch points and clinicians face equivalent valid compounds, i.e., with similar average response rates. Consequently, many patients go through inefficient treatments, being subjected to unnecessary toxicity.
The current gold standard in cancer biology for personalized screening is direct primary tumor transplantation into immune-compromised mice, also known as patient-derived xenografts (PDX). PDX can generally maintain both interindividual and genetic heterogeneity of original tumors, mimicking disease responses in patients and thus reflecting the uniqueness of each patient (1). However, mouse PDX present two major drawbacks for routine clinical assays: the amount of patient sample required and the time frame for engraftment and expansion of colonies (months), rendering them unviable for clinical practice.
Zebrafish xenografts offer speed, cellular resolution, and the ability to perform large numbers of transplants (2–4). They also allow evaluation of crucial hallmarks of cancer, such as metastatic (5, 6) and angiogenic potentials (5, 7, 8). Even though drug pharmacodynamics in zebrafish may differ from mammals, many compounds have been shown to block disease in a similar way. This has led to an increasing amount of compounds discovered in zebrafish screens that are entering into human clinical trials (2–4). However, for zebrafish xenografts to be used as clinical assays, it is crucial that they provide sufficient resolution to reveal intertumor and intratumor functional heterogeneity, including differential response to therapy. Reliable methods to visualize and quantify human cells and induced cell death upon treatment and direct validation with mouse xenografts are also still lacking.
With the aim of testing zebrafish xenotransplants as a screening platform for cancer therapy, we used a panel of patient-derived human colorectal cancer (CRC) cell lines to screen the National Comprehensive Cancer Network (NCCN)/European Society for Medical Oncology (ESMO) treatment guidelines for advanced CRC. We selected independent cell lines to investigate intertumor heterogeneity and isogenic clones to examine intratumor heterogeneity. In just 4 days, we could detect in vivo differential behaviors with single-cell resolution, namely differential proliferation rates, metastatic and angiogenic potentials. These differences were present not only in tumors derived from different patients but also between different clones from the same tumor, even when mixed into a polyclonal tumor. We showed that early readouts of response to treatment in zebrafish closely mirror the results obtained in mice. We also found that the zebrafish xenograft model revealed a remarkable sensitivity to detect differential responses to Cetuximab treatment according to the KRAS mutational status.
Finally, as a proof-of-principle, we generated CRC zebrafish PDX (zPDX) derived from surgery-resected human samples and treated them with the same treatment administered to the patient. Altogether, our results suggest that zebrafish xenografts are a fast and highly sensitive assay that can be used to display multiple biological tumor traits and assess tumor response to treatment. We propose that this model can be used, not only in the research setting, but also possibly in the future for precision medicine.
Results
Human CRCs Display Diverse Implantation and Proliferation Potentials in Zebrafish Xenografts.
Our strategy relies on the ability of zebrafish xenotransplants to unravel intertumor and intratumor functional heterogeneity. To address this question, we selected several human CRC cell lines isolated from different patients (intertumor heterogeneity) and isogenic pairs (intratumor heterogeneity) described in Table S1. SW480 was derived from the primary tumor and SW620 from the lymph node metastasis (6 mo later) of the same patient, illustrating a history of clonal selection (9). HCT116 KRASG13D tumor cells were isolated from a patient with colorectal carcinoma. Hke3 cells were generated from HCT116 by a somatic deletion of the KRASG13D allele, reverting the oncogenic KRAS phenotype (10). This pair is considered isogenic and constitutes an ideal setting to study phenotypic heterogeneity derived from one single mutation (intratumor heterogeneity). Finally, HT29 cells were isolated from a well-differentiated metastatic tumor, belonging to the goblet-like subtype (11), serving as an outgroup.
Table S1.
Origin and critical mutations of the selected CRC cell lines, adapted from ref. 45
| SW480 | SW620 | HCT116 | Hke3 | HT29 | |
| Origin | Primary tumor | Lymph node metastasis (same patient as SW480) | Primary tumor | Generated from HCT116 by HR* | Primary tumor |
| Disease | CRC adenocarcinoma | CRC adenocarcinoma | CRC carcinoma | CRC carcinoma | CRC adenocarcinoma |
| KRAS | G12V | G12V | G13D | wt | wt |
| PI3K | wt | wt | H1047R | H1047R | P449T |
| PTEN | wt | wt | wt | wt | wt |
| BRAF | wt | wt | wt | wt | V600E |
| TP53 | R273H | R273H | wt | wt | R273H |
| P309S | P309S |
Homologous recombination.
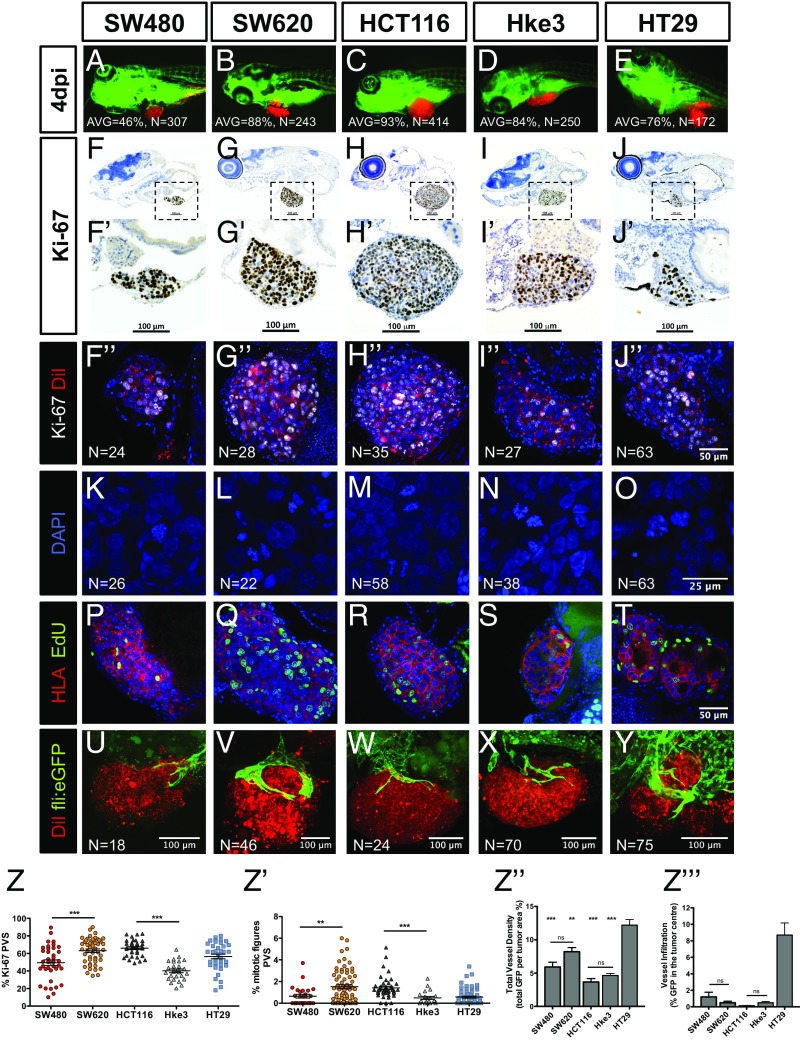
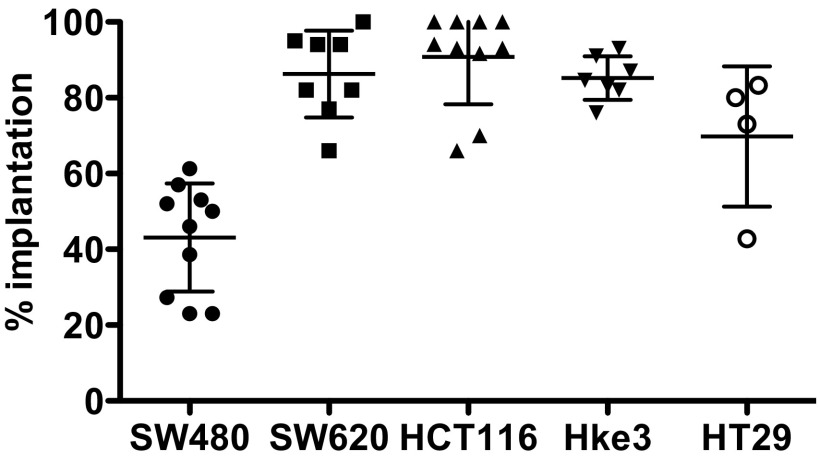
To determine the implantation potential of these five human CRC cell lines, cells were labeled with a lipophilic dye (DiI) and injected into the periviteline space (PVS) of 48-h-postfertilization (hpf) zebrafish embryos (8). At 4 days postinjection (dpi), we scored the efficiency of implantation (Fig. 1 A–E and Fig. S1). With the exception of SW480 cells, we observed high implantation efficiency in all cell lines (>70%) (Fig. S1).
Fig. 1.
Implantation and histological analysis of human CRC zebrafish-xenografts. Human CRC cells (SW480; SW620; HCT116; Hke3 and HT29) were labeled with DiI dye (red) and injected into the PVS of 48-hpf zebrafish. At 4 dpi, the number of xenografts with a tumor implanted was quantified (A–E), and the average (AVG) implantation rate was determined from at least three independent experiments. Immunohistochemistry for Ki-67 in paraffin sections at 4-dpi xenografts (F–J′). Images were obtained using a Zeiss AxioScan Z1, generating tiled images. Note that a fine line of agarose inclusion might be detected around the xenograft due to the agarose embedding step prior to paraffin inclusion. Whole-mount immunofluorescence staining at 4 dpi, for Ki-67 (F′′–J′′). Representative images of mitotic figures in the corresponding xenografts (K–O), nuclei staining with DAPI in blue, anti-human HLA in red and EdU staining in green (P–T). Quantification of percentage of Ki-67 positive cells per xenograft (Z, ***P < 0.0001) and mitotic figures (Z′, ***P < 0.0001) in corresponding tumors (each dot represents one xenograft). Human CRC xenografts were generated in Tg(fli:eGFP) zebrafish to visualize blood vessels. Images representative of 4 dpi xenografts induced neovasculature: SW480 (U); SW620 (V); HCT116 (W); Hke3 (X) and HT29 xenografts (Y). Quantification of total vessel density (Z′′) and vessel infiltration (Z′′′); **/*** refers to comparison with HT29. HT29 tumors displayed significantly higher vessel density and infiltration than any other tumor, SW480 vs. HT29 (P = 0.0264); SW620 vs. HT29 (P = ns); HCT116 vs. HT29 (P < 0.0001); and Hke3 vs. HT29 (P < 0.0001). Infiltration potential SW480 vs. HCT116 (P = 0.0482); SW480 vs. HT29 (P = 0.0025); HCT116 vs. HT29 (P < 0.0001). Results in Z, Z′, Z′′, and Z′′′ are expressed as average (AVG) ± SEM. The number of xenografts analyzed for Ki-67; mitotic index and angiogenesis is indicated in the figures. All images in the same row are at the same magnification. *P < 0.05; **P < 0.005; ns, nonsignificant.
Fig. S1.
Implantation score of human CRC zebrafish xenografts. Human CRC cells (SW480, SW620, HCT116, Hke3, and HT29) were labeled with the DiI dye (red), injected into the PVS, and imaged at 4 dpi. The average implantation was quantified at 4 dpi, i.e., percentage of xenografts that showed the presence of a tumor mass at the injection site, PVS. Results are expressed as AVG ± SD of at least three independent experiments.
One of the most fundamental hallmarks of cancer is the capacity to proliferate with no constrains (12). To measure proliferation in vivo, we quantified mitotic figures and the Ki-67 index (which specifically recognizes human cells, with no cross-reactivity with zebrafish) (Fig. 1 F–J′′). We found that the Ki-67 and mitotic index varied between cells derived from different patients (Fig. 1 Z and Z′). Direct comparison between isogenic pairs (intratumor heterogeneity) revealed that SW620 and HCT116 have higher proliferation rates in relation to their isogenic pairs SW480 (Ki-67 P < 0.0001; mitosis P = 0.0063) and Hke3 (Ki-67 P < 0.0001; mitosis P = 0.0003) (Fig. 1 Z and Z′). To further confirm that human CRC cells are actively proliferating in the zebrafish host, we delivered a 2-h pulse of 5-ethynyl-2′-deoxyuridine (EdU) prior fixation, labeling specifically cells that were undergoing DNA replication (Fig. 1 P–T). EdU incorporation demonstrates that human cells can actively proliferate in the zebrafish xenograft model.
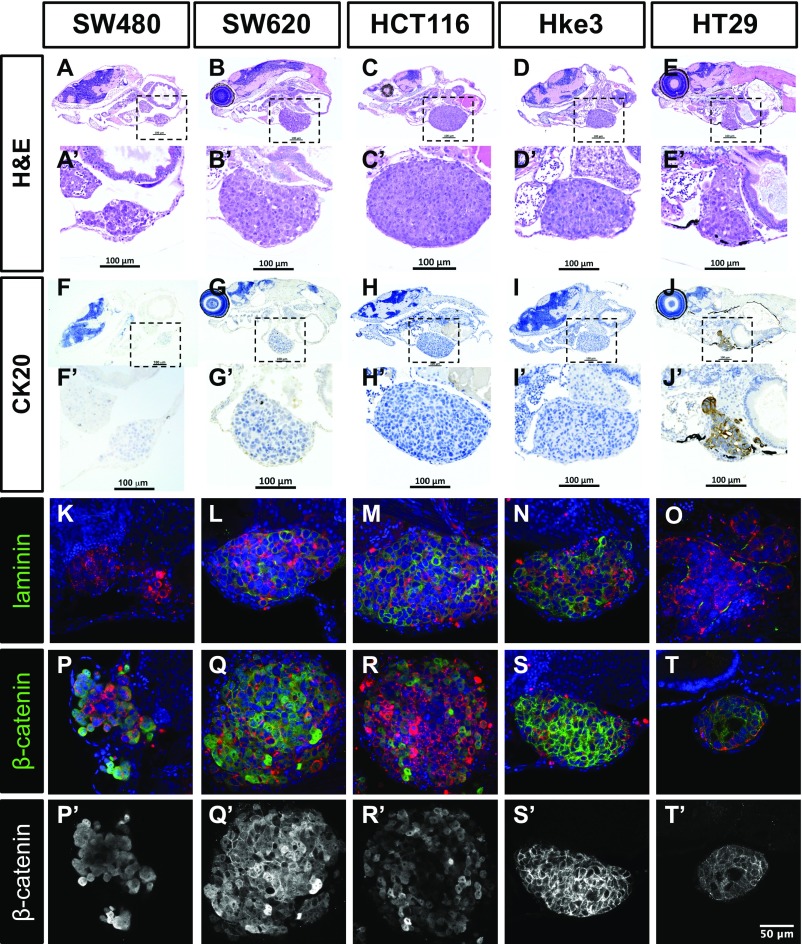
We also investigated whether the immunohistochemical profile and typical morphological features described for these cell lines were maintained in the zebrafish xenografts (Fig. S2). As expected for more-differentiated cells, HT29 formed tubular structures (Fig. S2 E′, O, T, and T′), whereas tumors originating from the other cell lines showed a solid pattern with rare tubule formation, consistent with their “stem cell-like” character (11) (Fig. S2).
Fig. S2.
Histological analysis of human CRC zebrafish xenografts. Hematoxylin eosin staining (A–E′) and immunohistochemistry for CK20 (F–J′) were performed in histological sections, and corresponding images were obtained using a Zeiss AxioScan Z1, generating tiled images. Note that a fine line of agarose inclusion might be detected around the xenograft due to the agarose embedding step prior to paraffin inclusion. Whole-mount imunofluorescence staining for laminin (K–O) and β-catenin (P–T′). All imunofluorescence images are at the same magnification. (Scale bar, 50 μm.) DiI is in red, and nuclei staining with DAPI is in blue. Dashed boxes indicate areas of zoom. All images are anterior to the left, posterior to right, dorsal up, and ventral down.
We next examined angiogenesis, another essential hallmark of cancer (12). The five cancer cell lines were injected into Tg(fli:eGFP) zebrafish line with GFP-labeled vasculature (13). At 4 dpi, xenografts were imaged by confocal microscopy to study vessel 3D architecture (Fig. 1 U–Y). SW480, SW620, HCT116, and Hke3 tumors showed a well-vascularized periphery, composed of large vessels that generally do not infiltrate the tumor (Fig. 1 U–Y, Z′′, and Z′′′ and Movies S1–S4). In contrast, HT29 are highly vascularized tumors, with formation of a dense vessel network that infiltrates into the core of the tumor (Fig. 1 Y, Z′′, and Z′′′ and Movies S5 and S6). This is consistent with HT29 expressing high levels of VEGF and high angiogenic potential in other models (14, 15).
Our data conclusively show that human CRC cells can sustain proliferation in zebrafish and present different proliferation dynamics in CRC tumors derived from different patients and isogenic tumors. In addition, human CRC cells maintain their general cellular characteristics and angiogenic potential in the zebrafish xenografts.
Isogenic Human CRC Cells Present Different Metastatic Potentials.
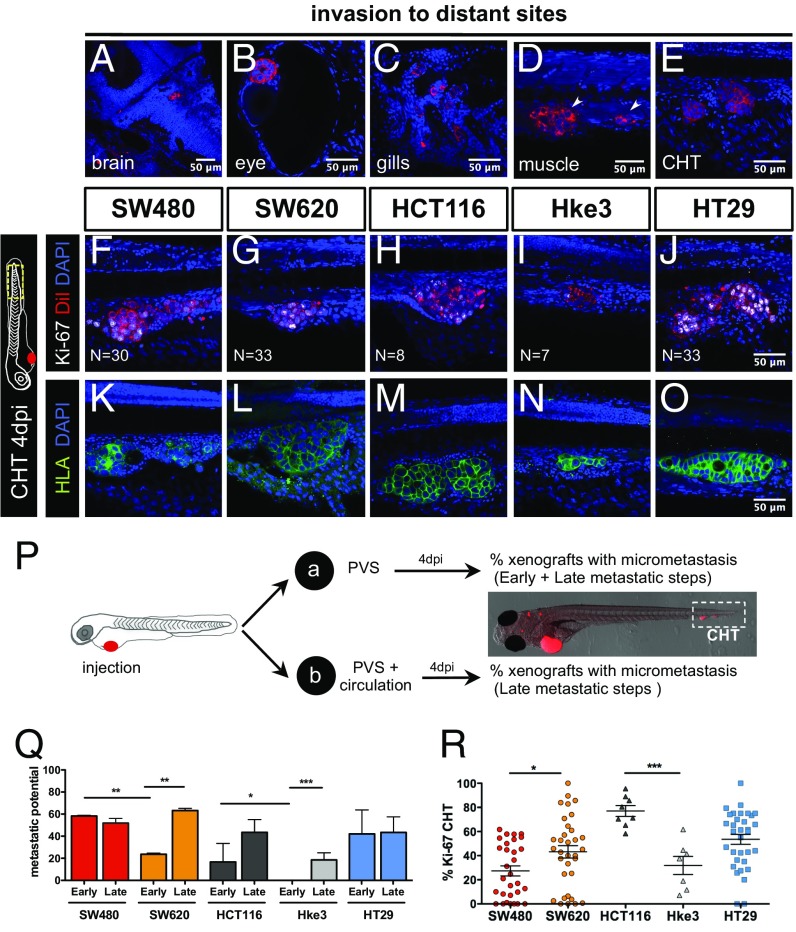
Another essential hallmark of cancer is the ability of cells to form metastasis (12). At 4 dpi, we could detect several small groups of cells in the brain, optic cup, gills, and skeletal muscle and in the caudal hematopoietic tissue (CHT) region (Fig. 2 A–E). Cells in the CHT often extravasate from vessels (Movie S7) and invade adjacent tissues, frequently the muscle (Fig. 2D, arrows). This “hot spot” region for tumor cell colonization provides an ideal location for quantification of metastatic potential (6). Immunofluorescence for HLA (anti-human MHC class I subunit) identifies unequivocally cells of human origin and delineates the cellular architecture of the micrometastasis (Fig. 2 K–O). Ki-67 positive cells and mitotic figures at 4 dpi suggest that colonization has been achieved (Fig. 2 F–J and R).
Fig. 2.
Human CRC cells show different metastatic potential. At 4 dpi, it is possible to detect human tumor cells throughout the zebrafish body, in the brain (A), eye (B), gills (C), muscle (D), and CHT (E). Immunofluorescence for Ki-67 (F–J) and anti-human HLA (K–O) in the CHT region at 4 dpi in the indicated xenografts. To distinguish between early and late metastatic steps, tumor cells were injected into the PVS only (group_a) or in the PVS and directly into circulation (group_b) (P). Quantification of Early (EMP) and Late (LMP) Metastatic Potential (Q) and percentage of Ki-67 positive cells in the CHT micrometastasis (R); each dot represents one xenograft. Results are averages from at least three independent experiments. The number of xenografts analyzed for Ki-67 is indicated in the images. The number of xenografts analyzed for EMP and LMP are as follows: SW480 (EMP, n = 62; LMP, n = 66); SW620 (EMP, n = 50; LMP, n = 69); HCT116 (EMP, n = 73; LMP, n = 57); Hke3 (EMP, n = 74; LMP, n = 250); HT29 (EMP, n = 31; LMP, n = 94) (Q). Results in Q and R are expressed as AVG ± SEM. Nuclei staining with DAPI is in blue. All pictures in the same row (F–O) are at the same magnification. All images are anterior to the left, posterior to right, dorsal up, and ventral down. *P < 0.05; **P < 0.005; ***P < 0.0001.
Metastatic efficiency may vary and depends on whether a tumor cell can detach from the primary tumor, enter and survive in circulation, and go on to seed cells at distant sites. We designed a simple assay to distinguish between early stages (invasion of surrounding tissues and intravasation into blood vessels) and later stages of the metastatic cascade (survival in circulation, extravasation, and colonization) (16, 17) by comparing the micrometastasis efficiency when cells were placed directly into circulation vs. when not. For that, we injected CRC cell lines either into the PVS alone (group_a) or directly into circulation (group_b) (Fig. 2P). At 4 dpi, we analyzed the number of xenografts that presented a tumor cell mass (>20 cells) away from the PVS injection site (CHT).
For tumor cells in group_a to efficiently establish metastasis, they would have to go through all of the metastatic steps (from early to late steps), whereas cells in group_b only have to go through the later-stage ones. Thus, considering that maximum metastatic efficiency is achieved when cells are placed in circulation (group_b), the reduction of colonization in group_a would reflect the effort to undergo the early metastatic steps. Therefore, we converted our frequency of CHT colonization into Early Metastatic Potential (EMP) and Late Metastatic Potential (LMP) (Fig. 2P and SI Materials and Methods).
Overall, our data show that tumors differed both in their EMP (ANOVA P = 0.0044) and LMP (ANOVA P = 0.028) (Fig. 2Q). When comparing isogenic lines, we observed that SW480 cells have a higher EMP than SW620 (P = 0.004) even though they exhibit similar LMP (Fig. 2Q). These results agree with previous observations that SW480 cells are more invasive and migratory than SW620 in vitro and show higher extravasation potential in vivo (9, 18).
The isogenic pair HCT116/Hke3 showed different EMP (Fig. 2 H, I, and Q, ***P < 0.0001); i.e., in Hke3 KRASWT xenografts, we could only find metastasis when cells were directly injected into circulation (Fig. 2 I, N, and Q, P < 0.0001), highlighting the reported roles for activated KRAS in early metastatic events (17–19).
Finally, HT29 cells showed high EMP and LMP, frequently forming organized masses in the eye and CHT (Fig. 2 A, J, O, and Q). This high metastatic potential is consistent with the one observed in mouse xenograft models (20).
Our results show that it is possible to further discriminate the cellular metastatic potential by comparing the efficiency of cells in metastasizing when placed directly into circulation or not. Importantly, we found that the measurement of metastatic potential in our model matches that previously described.
Zebrafish Xenografts Discriminate Different Chemosensitivities in 4 days.
To test whether zebrafish xenografts can measure responses to therapy, we first assessed the main therapeutic options in advanced CRC guidelines: 5-fluorouracil(FU)+oxaliplatin+folinic acid (FOLFOX) and 5-FU+irinotecan+folinic acid (FOLFIRI) (ref. 19 and Table S2). These protocols are considered as balanced alternatives, since both treatments have shown equivalent average response rates (∼35%) in clinical trials performed on naïve patients (21).
Table S2.
Standard chemotherapy compounds used in advanced CRC, mode of action, and corresponding patient plasma concentration
| Chemotherapy compounds | Mode of action | Patient plasma concentration, mM | Ref. |
| 5-FU | Blocks thymidylic acid formation; DNA biosynthesis | 426.2 | 46 |
| Oxaliplatin | DNA crossliking agent; preventing DNA replication and transcription | 8.1 | 47 |
| Folinic acid or leucoverin | Stabilizes binding of 5-FU to thymidylate synthase | 18.5 | 48 |
| Irinotecan | Analog of camptothecin, inhibits topoisomerase activity, blocking DNA replication, and transcription | 8 | 49 |
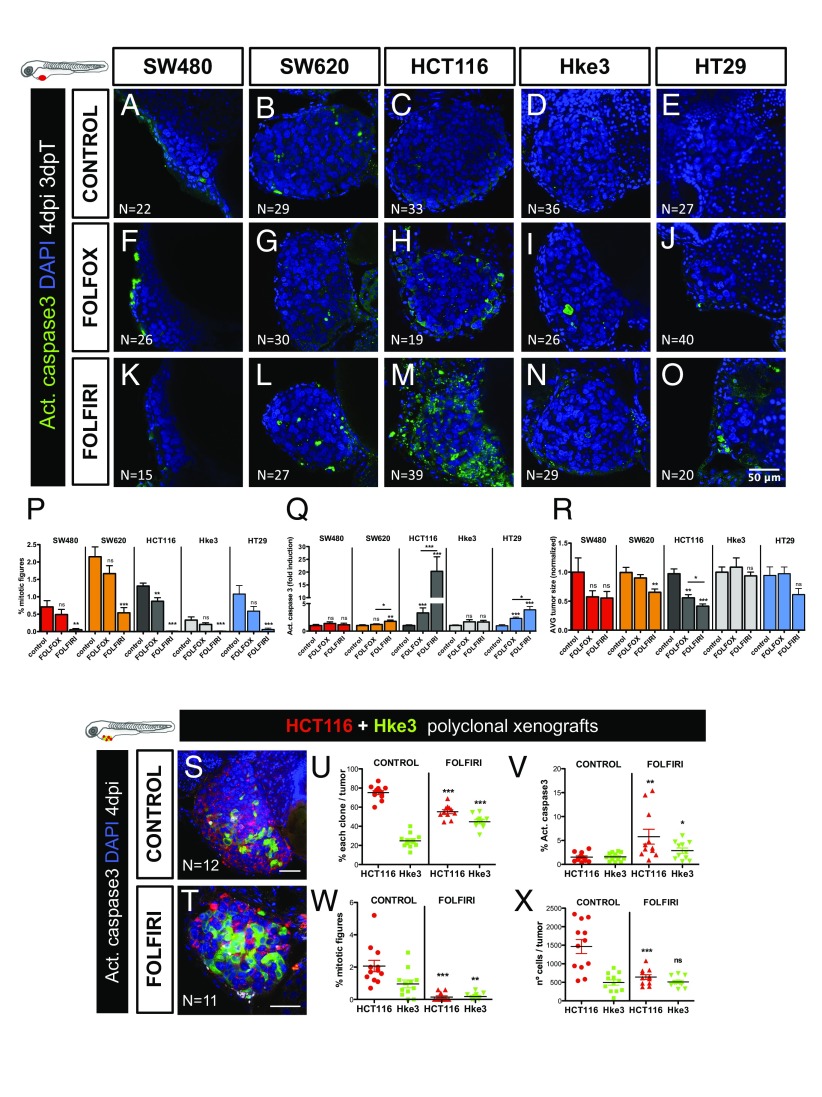
To assess chemotherapeutic responses, all xenografts were randomly distributed between treatment groups (control, FOLFOX, and FOLFIRI) at 24 h postinjection (hpi) and then treated for three consecutive days. After 3 days of treatment (and 4 dpi), xenografts were processed for microscopy and assessed for mitotic index, cell death by apoptosis (activated caspase3), and tumor size (Fig. 3 P–R).
Fig. 3.
CRC xenografts show different sensitivities to standard chemotherapy. Human CRC zebrafish xenografts were treated in vivo with FOLFOX (F–J) and FOLFIRI (K–O) compared with nontreated controls (A–E). Zebrafish were killed and fixed at 4 dpi, 3 days posttreatment (3 dpT). Mitotic index (P) (DAPI in blue) and cell death by apoptosis (Q) (activated caspase3 in green) were analyzed and quantified. Average tumor size (number of DAPI cells), normalized to respective controls, was also quantified to compare between different xenografts in different conditions (R). All pictures are at the same magnification (A–O). Results in P–R are expressed as AVG ± SEM. Results are averages from at least three independent experiments, and the total number of xenografts analyzed is indicated in the images; ns, nonsignificant; P values are indicated in the text, ***P < 0.001. HCT116 and Hke3 polyclonal xenografts (1:1) were generated and randomly treated with FOLFIRI (T) and compared with untreated controls (S). Xenografts were fixed at 4 dpi, 3 dpT. The percentages of each clone (U), cell death by apoptosis (V) (activated caspase3), mitotic index (W), and the size of each clone per xenograft (X), were analyzed and quantified. Each dot represents a xenograft, Hke3_caspase3 **P = 0.041, Hke3_mitosis **P = 0.006, remaining P values are indicated in the text, and *P < 0.05; **P < 0.005; ***P < 0.001. The total number of xenografts analyzed is indicated in the images. HCT116 was labeled with DiI (red) and Hke3 with DeepRed (green, false color).
FOLFIRI treatment induced a significant reduction of mitotic figures in all tumors (Fig. 3P). However, a significant induction of apoptosis followed by a reduction of tumor mass was only observed in HCT116 (apoptosis P < 0.0001; 59% tumor reduction P < 0.0001) and SW620 (apoptosis P = 0.0021; 35% tumor reduction P = 0.0026) (Fig. 3 L, M, Q, and R). Remarkably, SW620 and HCT116 are more sensitive than their respective isogenic pairs. These results suggest differential sensitivities to therapy throughout cancer progression (primary vs. metastasis) and in heterogeneous tumor populations (KRAS subclones).
Only in HCT116, FOLFOX treatment resulted in significant induction of apoptosis accompanied by a reduction of tumor size (apoptosis P < 0.0001; 44% reduction P = 0.0018) (Fig. 3 H, Q, and R). Strikingly, Hke3 (HCT116 isogenic pair) showed no induction of apoptosis or reduction of tumor mass when treated with FOLFOX (Fig. 3 I, Q, and R). These results are consistent with KRAS mutations increasing sensitivity to 5-FU-induced apoptosis (22). As for HT29, as previously reported in mouse xenografts (23), we could observe a significant reduction of mitotic figures (P < 0.0001) and increase in apoptosis upon both FOLFIRI (P < 0.0001) and FOLFOX treatment (P < 0.0001) (Fig. 3 P and Q).
In general, our results are consistent with previous mouse in vivo studies (23, 24), with the exception of SW620, which has been reported to respond to FOLFOX (24). The differences observed in our study are likely to reflect that our assay is designed to detect fast strong responses, given its short time window (3 days). This is particularly evident in the study by Van Schaeybroeck (24) where HCT116 tumors stop growing as soon as FOLFOX treatment is initiated, whereas SW620 shows a delayed response.
In summary, we show that zebrafish larvae xenografts have enough resolution to measure interpatient and intrapatient heterogeneity in chemotherapy responses in just 4 days. These results highlight the heterogeneity of chemotherapeutic response and the possibility of measuring this in a very short period in vivo.
To further confirm the HCT116 (KRASMUT) and Hke3 (KRASWT) opposing chemosensitive profiles, we challenged them in the same xenograft host. For that, we coinjected the two cell lines (1:1), each labeled with a different lipophilic dye. Mixed xenografts (HCT116+Hke3) were randomly distributed into FOLFIRI and control groups. As expected, given their higher proliferative potential, HCT116 KRASMUT cells outcompete Hke3 KRASWT and become dominant in the mix, representing ∼80% of the tumor (Fig. 3 S and U). However, upon FOLFIRI treatment, HCT116 significantly reduced its frequency (P < 0.0001) (Fig. 3 T and U). Consistent with the individual response to FOLFIRI treatment, we observed a significant increase in apoptosis (P = 0.0023) and a decrease in mitotic figures (P < 0.0001), accompanied by a significant decrease in HCT116 tumor size (∼56% reduction P < 0.0001) (Fig. 3 V–X). In contrast, Hke3 clone size did not change upon FOLFIRI treatment, remaining at similar levels to controls (Fig. 3X).
These results demonstrate the differential chemosensitive profiles of both cell lines and how the KRAS mutation sensitizes cells to chemotherapy (22). Our data also illustrate how, in heterogeneous tumors, KRAS mutations can provide a proliferation benefit, and how chemotherapy may disrupt this advantage, selecting the minor clone resistant to treatment, which then may be responsible for relapses.
HCT116 and Hke3 Mouse Xenografts Show Similar Chemosensitive Profile to Zebrafish Xenografts.
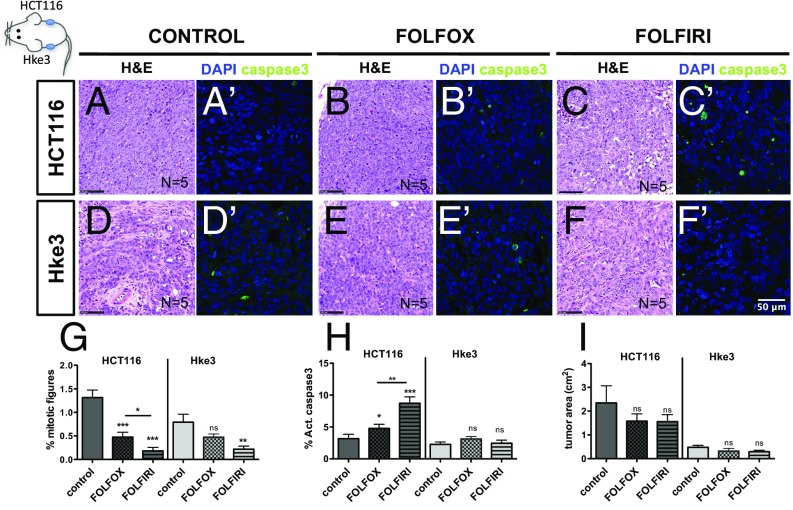
To directly compare the HCT116 and Hke3 chemosensitive profile determined in zebrafish with mouse xenografts, we generated HCT116/Hke3 double mouse xenografts, controlling treatment efficacy and delivery in the same animal (25). After 14 days, mice were randomly distributed among treatment groups and treated with three cycles of chemotherapy (Fig. 4).
Fig. 4.
HCT116 and Hke3 mouse xenografts validate zebrafish chemosensitive profile. HCT116 and Hke3 double mouse xenografts were generated and randomly treated with FOLFOX (n = 5) and FOLFIRI (n = 5) and compared with PBS-treated controls (n = 5). H&E (A–F) staining, as well as immunofluorescence to detect apoptotic cells (activated caspase3) (A′–F′), was performed in paraffin sections. Mitotic index (G) (DAPI in blue) and cell death by apoptosis (H) (activated caspase3 in green) were quantified in fields distant from the necrotic center of the tumor. Quantification of tumor area (cm2) was also determined (I); ns, nonsignificant; P values are indicated in the text, and *P < 0.05; **P < 0.005; ***P < 0.001. Results in G and H are expressed as AVG ± SEM.
Similarly to our zebrafish xenograft results, Hke3 mouse tumors presented a reduced mitotic index upon FOLFIRI treatment but not with FOLFOX (Fig. 4 D–F′ and G), and no significant difference in apoptosis was observed with both treatments (Fig. 4H). Also in agreement with what we observed in zebrafish, both FOLFOX and FOLFIRI induced a significant increase in apoptosis in HCT116 cells (Fig. 4 A′–C′ and H) and reduced proliferation (Fig. 4 G and H) albeit to a lesser extent in FOLFOX than in FOLFIRI (FOLFOX vs. FOLFIRI: apoptosis P = 0.0017, mitotic figures P = 0.029), closely resembling the zebrafish results (Fig. 3 P and Q).
However, we were unable to detect clear differences in tumor size between control and treatment groups in our mouse xenograft study (Fig. 4I). This contrasts not only with our zebrafish xenograft results (Fig. 3R) but also with previous mouse studies, where FOLFOX reduces the size of HCT116 tumors (24). The inability to detect tumor reduction in mouse xenografts is likely to rely on different experimental designs (treatment initiation 3 days vs. 14 days postinoculation) that may lead to different tumor growth kinetics. Thus, with the exception of long-term tumor size decline, our results in mouse xenografts show a higher response to treatment in HCT116 than in Hke3 cells, closely matching zebrafish xenografts.
Differential Sensitivity to Cetuximab and Regorafenib in CRC Tumors in Zebrafish Xenografts.
Our results suggest that Hke3 KRASWT tumors were refractory to FOLFOX and FOLFIRI standard chemotherapy. CRC guidelines further recommend that KRASWT patients should be treated with a combination of chemotherapy and Cetuximab, a monoclonal antibody anti-epidermal growth factor receptor (EGFR) (19, 26). KRASWT status is an established biomarker for Cetuximab treatment (19, 26). Consequently, patients with metastatic CRC who present a mutated KRAS profile (KRASMUT), such as in HCT116, are generally excluded from Cetuximab treatment (19).
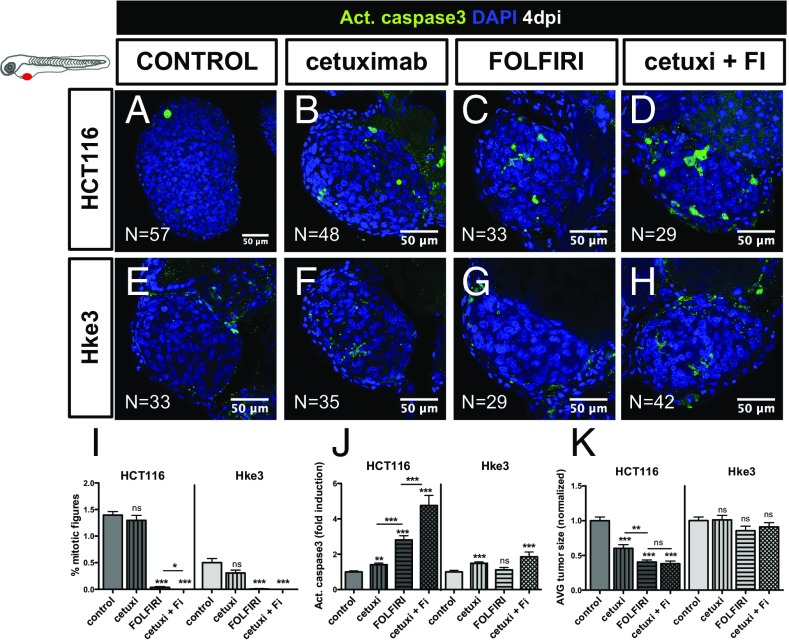
To test whether Cetuximab therapy could induce cell death and reduce tumor mass in Hke3 tumors, we treated Hke3 KRASWT and HCT116 KRASMUT xenografts (as a negative control) with Cetuximab, with FOLFIRI, and with a combination of FOLFIRI and Cetuximab. Surprisingly, Cetuximab alone could significantly induce apoptosis in both Hke3 and HCT116 tumors (Fig. 5 B, F, and J). Combination of Cetuximab and FOLFIRI resulted in increased sensitivity of individual treatments in HCT116 tumors (Fig. 5 D, H, and J). This synergistic effect was also observed in the reduction of mitotic figures, but not in the reduction of tumor size (Fig. 5 I and K).
Fig. 5.
Differential sensitivity to Cetuximab in human CRC in zebrafish-xenografts. HCT116 (A–D) and Hke3 (E–H) xenografts were treated for three consecutive days, with Cetuximab (B and F), FOLFIRI (C and G) and Cetuximab in combination with FOLFIRI (cetuxi + FI) (D and H) and compared with control nontreated xenografts (A and E). Mitotic index (I) (DAPI in blue), cell death by apoptosis (J) (activated caspase3 in green), and AVG tumor size (K) (number of DAPI cells per tumor) were analyzed and quantified at 4 dpi and 3 dpT. Average tumor size and the percentage of activated caspase3 were normalized to respective controls to compare between different xenografts. Results are expressed as AVG ± SEM. *P < 0.05; **P < 0.005; ***P < 0.0001; ns, nonsignificant.
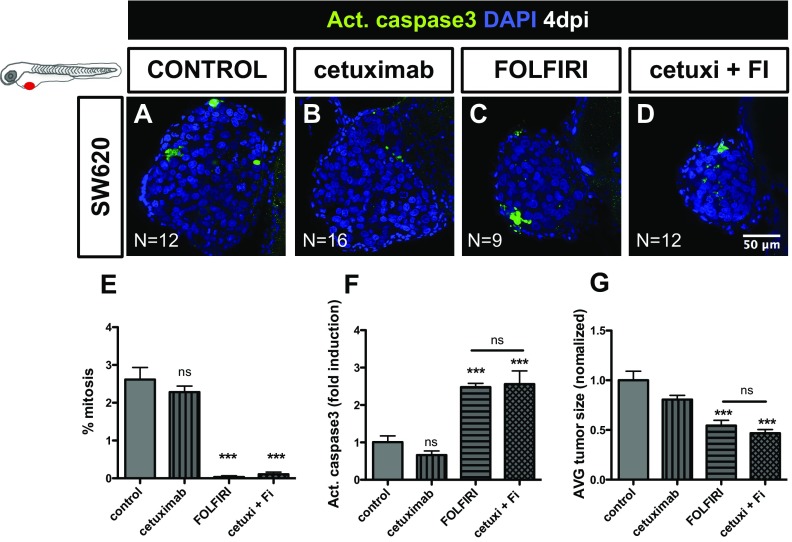
We were surprised to observe the effect of Cetuximab in HCT116 (Fig. 5 I–K), given the status of KRASMUT. However, it was recently reported that a proportion of patients with KRASG13D mutations, but not with KRASG12V mutations, benefit from treatment with Cetuximab (27). Thus, to further test the sensitivity of our in vivo assay, we treated SW620 KRASG12V tumors with Cetuximab (Fig. S3 E–G). In contrast to HCT116 KRASG13D, but as expected for KRASG12V tumors, no significant effect was observed with Cetuximab treatment in SW620 KRASG12V tumors (Fig. S3). These results demonstrate that the zebrafish xenograft assay has a remarkable resolution to detect sensitivity to Cetuximab treatment, even in KRASG13D tumors.
Fig. S3.
Cetuximab treatment has no significant effect in SW620 KRASG12V tumors. SW620 (A–D) xenografts were treated for three consecutive days, with Cetuximab (B), FOLFIRI (C), and Cetuximab in combination with FOLFIRI (cetuxi + FI) (D). Cell death by apoptosis (F) (activated caspase3, in green), mitotic index (E), and AVG tumor size (G) (number of DAPI cells per tumor) were analyzed and quantified at 4 dpi and 3 dpT. Results in E–G are expressed as AVG ± SEM. Total number of xenografts analyzed is indicated in the images; ns, nonsignificant; P values are indicated in the text, ***P < 0.001. Datasets with a Gaussian distribution were analyzed by unpaired t test, otherwise by Mann−Whitney for non-Gaussian distribution. All pictures are at the same magnification.
Although Cetuximab treatment of Hke3 KRASWT tumors induced apoptosis, this was not accompanied by a significant reduction of tumor mass (Fig. 5 J and K), suggesting that Cetuximab is not very effective in Hke3 cells.
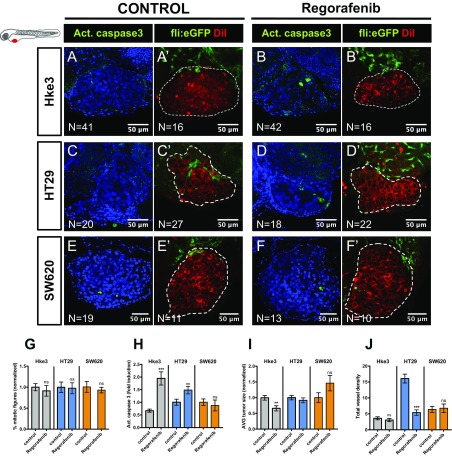
Regorafenib is a small-molecule multikinase inhibitor recommended in refractory metastatic CRC, usually used as a last alternative in the guidelines (19, 28). Regorafenib has been shown not only to induce apoptosis (28) but also to have antiangiogenic activity (29). Thus, to test whether regorafenib could be more effective for Hke3 refractory and less proliferative tumors, xenografts were treated with regorafenib for three consecutive days. Although we could not observe changes in the mitotic index of Hke3 (Fig. S4G), regorafenib was able to induce apoptosis in Hke3 cells (P < 0.0001) accompanied by a significant reduction of tumor size (Fig. S4 A, B, H, and I, P = 0.0041). These results highlight the possibility of detecting response to therapy even in low proliferative and refractory tumors.
Fig. S4.
Regorafenib third line treatment on Hke3, HT29, and SW620 tumors. Hke3 (A–B′), HT29 (C–D′), and SW620 (E–F′) xenografts were generated in Tg(fli:eGFP) zebrafish to visualize blood vessels. At 24 hpi, xenografts were randomly distributed into control and regorafenib, and treated for three consecutive days. Mitotic index (G) (DAPI in blue), cell death by apoptosis (H) (activated caspase3 in green), and AVG tumor size (I) (number of DAPI cells per tumor) were quantified at 4 dpi. Total vessel density (J) was also quantified. Results are expressed as AVG ± SEM. All pictures are at the same magnification. (Scale bar, 50 μm.) **P < 0.005; ***P < 0.0001; ns, nonsignificant.
In addition, since regorafenib is also considered antiangiogenic, we also examined this effect in HT29 xenografts (which we previously showed were highly angiogenic). We detected a reduction on the total vessel density in HT29 tumors (Fig. S4 J, C′, and D′, P < 0.0001) but not in Hke3 or SW620 (Fig. S4 J, A′, B′, E′, and F′). Regorafenib also induces apoptosis in HT29 tumors; however, this induction is not accompanied by a reduction of tumor mass as in Hke3 (Figs. S4H, P = 0.0083, and I). These results suggest that regorafenib is efficient as a third line of treatment for Hke3 refractory tumors and that regorafenib is also able to block tumor-derived neovascularization in highly angiogenic tumors.
Overall, we show that it is possible to perform an in vivo screening of the main current options of the international CRC treatment guidelines from first to third line, by using the zebrafish larvae xenograft model.
Zebrafish PDX Can Be Efficiently Established Using Human CRC Primary Samples.
Next, to test whether zebrafish larvae can be efficiently used to generate zebrafish PDX (zPDX), we injected cell suspensions derived from surgically resected human colon tumors into zebrafish. We developed a protocol based on procedures for human CRC organoids derivation to maintain stemness and cell viability during processing (30, 31) (SI Materials and Methods and Table S4).
Table S4.
Reagents/solutions for patient samples processing
| Reagent | Supplier | Cat. Number | Final concentration | |
| Collection medium | Advanced DMEM/F-12 | Gibco | 12634010 | — |
| Penicillin-Streptomycin | Sigma-Aldrich | P4333 | 100 U/mL | |
| Amphotericin B solution | Sigma-Aldrich | A2942 | 100 μg/mL | |
| Kanamycin solution | Sigma-Aldrich | K0254 | 100 μg/mL | |
| Gentamicin solution | Sigma-Aldrich | G1397 | 500 μg/mL | |
| Nystatin Suspension | Sigma-Aldrich | N1638 | 2400 U/mL | |
| Amoxicillin/Clavulanic acid | Clavepen | 12634010 | 220 μg/mL | |
| Metronidazol | Braun | P4333 | 80 μg/mL | |
| Mix1 | DMEM/F-12 | Gibco | 11320–074 | — |
| FBS | Gibco | 10270106 | 60% | |
| Y-27632 | Cliniscience | A11001 | 10 μM | |
| Primocin | Invivogen | ANT-PM-2 | 100 μg/mL | |
| Putrescin | Sigma-Aldrich | P5780 | 10 μg/mL | |
| Nicotinamide | Sigma-Aldrich | N3376 | 10 mM | |
| Mix2 | DMEM/F-12 | Gibco | 11320–074 | — |
| Y-27632 | Cliniscience | A11001 | 10 μM | |
| Primocin | Invivogen | ANT-PM-2 | 100 μg/mL | |
| Putrescin | Sigma-Aldrich | P5780 | 10 μg/mL | |
| Nicotinamide | Sigma-Aldrich | N3376 | 10 mM | |
| DNase I | Fermentas | EN0525 | 5 U/mL |
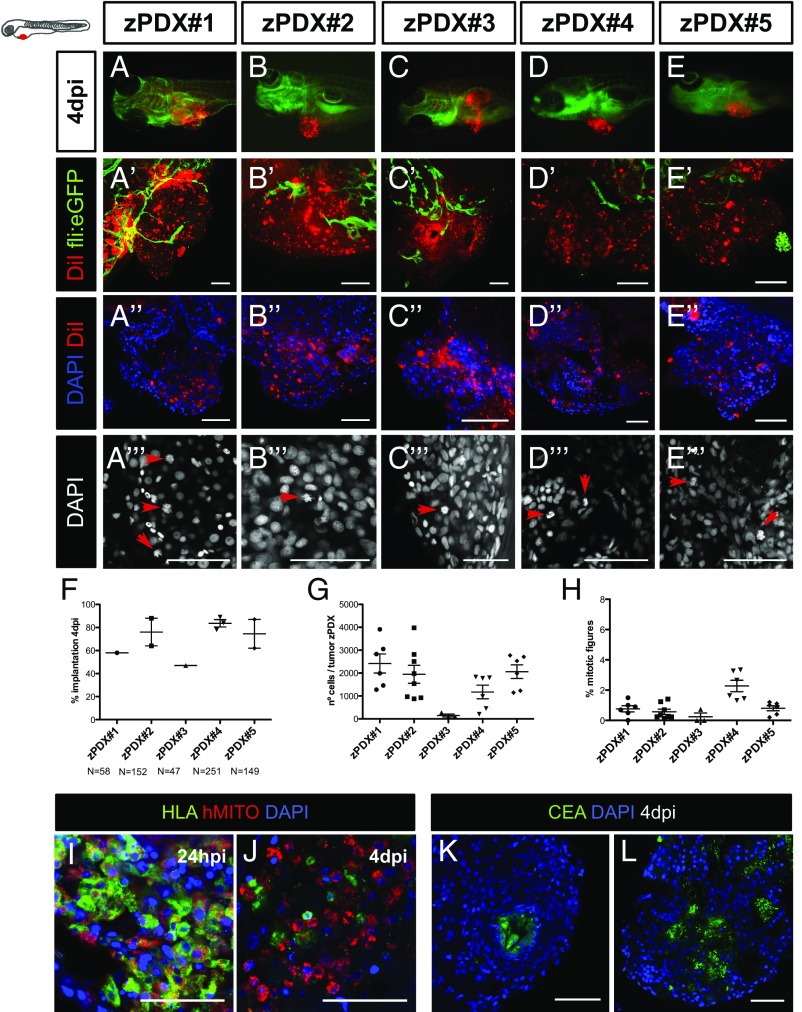
Selected primary tumors corresponded to adenocarcinomas of diverse tumor stages (Table S3). We selected 24-hpi zPDX for the presence of a DiI stained mass in the PVS and left them to develop for three more days. At 4 dpi, percentage of implantation was scored as previously (Fig. 6F). We observed implantation rates ranging from 47% (zPDX#3) to 89% (zPDX#4) (Fig. 6 A–F). For large primary tumor samples (zPDX#2, zPDX#4 and zPDX#5), injections were repeated and gave rise to similar engraftment rates (Fig. 6F), demonstrating the reproducibility of the procedure.
Table S3.
Histopathology primary tumor information
| Patient sample | Primary tumor location | pTNM | Observations | RELAPSE |
| P1 | Right colon | T1N0 | Conventional | — |
| P2 | Left colon | T3N2 | FO adjuvant | Yes |
| P3 | Right colon | T3N2a | Mucinous | — |
| P4 | Right colon | T3N1b | Mucinous | — |
| P5 | Right colon | T3N1a | Conventional | — |
| P7 | Left colon | pT4N0 | FO adjuvant | No |
| P8 | Right colon | pT4N0 | Neoadjuvant FOLFOXIRI + FOLFOX adjuvant | No |
| P9 | Rectum | pT3N1c | FO adjuvant | No |
| P10 | Right colon | pT3N2a | FO adjuvant | Yes |
| P11 | Rectum | pT1N0 | No treatment | — |
List of surgically resected human CRC tumors samples. Tumor node metastasis status: T1, tumor invades submucosa; T3, growth into the outermost layers of the colon. pN0, no malignant lymph nodes; pN1, cancer cells are found in one to three lymph nodes; pN1a, cancer cells in one regional lymph node; pN1b, cancer cells in two to three regional lymph nodes; pN2, cancer cells in four or more regional lymph nodes; pN2a, cancer cells are found in four to six lymph nodes. Relapse after 3 mo to 6 mo postsurgery.
Fig. 6.
The zPDX can be efficiently established using human CRC primary samples. Cell suspensions derived from surgically resected human colon tumors were labeled with the lipophilic DiI dye (red) and injected into the PVS of 48-hpf wt or Tg(fli:EGFP). At 4 dpi, the number of zebrafish with an implanted tumor was quantified (A–F) (each dot represents the implantation percentage of each experiment). Representative confocal images of 4-dpi zPDX showing neovasculature in Tg(fli:EGFP) (A′–E′) and tumor masses with high cytomorphologic and architectural diversity (DAPI) (A′′–E′′). The number of nuclei (tumor size) (G) and mitotic figures (H) in these tumor masses was quantified; each dot represents one xenograft. Representative images of mitotic figures (A′′′–E′′′) (red arrows) and corresponding quantification (H). HLA and human mitochondria-immunostained cells at 24 hpi (I) and 4 dpi (J). Tubular structures with luminal CEA staining (K and L). (Scale bar, 50 μm.) *P < 0.05; **P < 0.005; ***P < 0.0001; ns, nonsignificant.
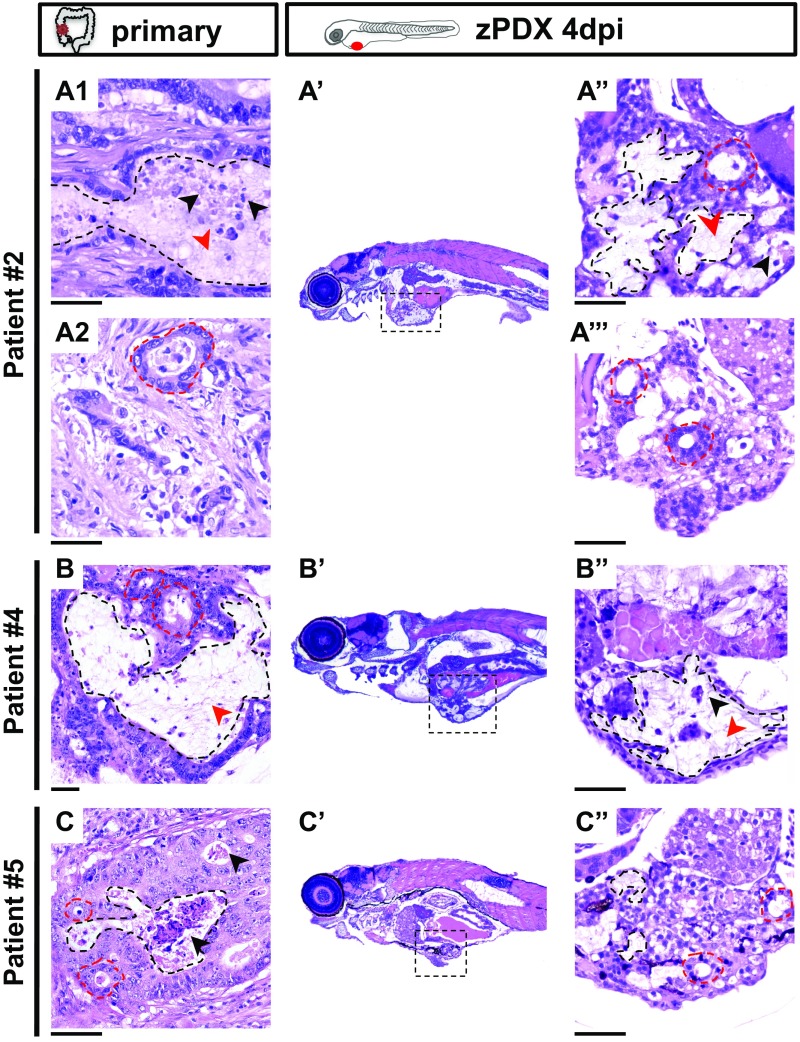
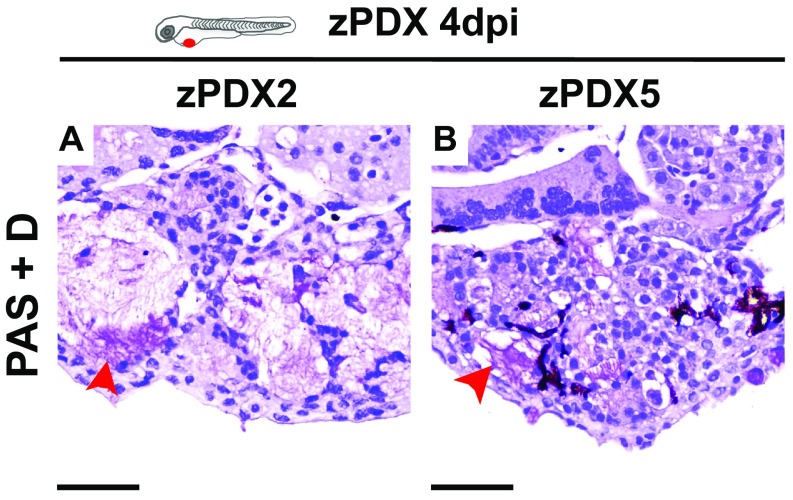
The zPDX were processed for whole-mount immunofluorescence to assess angiogenesis (Fig. 6 A′–E′), tumor size (Fig. 6G), mitotic figures (Fig. 6H), expression of CRC markers (carcinoembryonic antigen, CEA), and human-associated antigens (MHC class I HLA and human mitochondria) (Fig. 6 I–L). Confocal microscopy analysis allowed us to observe differential vessel recruitment (Fig. 6 A′–E′) and tumor masses with high cytomorphologic and architectural diversity (Fig. 6 A′′–E′′). Interestingly, even tumors with low cellularity induced vessel recruitment (Fig. 6 C′ and G). Mitotic figures were present at 4 dpi in all zPDX analyzed, albeit sparse and with low mitotic index (Fig. 6 A′′′–E′′′ and H). We observed tubular structures with luminal CEA staining (Fig. 6 K and L), as well as human HLA (to variable levels) and human mitochondria stained cells (Fig. 6 I and J). We also compared directly the zPDX histology with the parental primary tumors with hematoxilin and eosin (H&E) (Fig. S5). The zPDX derived from these tumors generally conserved their original features. They formed multilocular mucin lakes (Fig. S5 A′′, B′′, and C′′, black dashed lines delineate mucin lakes, and red arrow heads denote mucin), circumscribed by epithelium arranged as acinar structures with strips of cells or single cells (Fig. S5 A′′, A′′′, and C′′, red dashed lines). Periodic acid−Schiff plus diastase (PAS+D) staining was used to identify mucus in the lumen of these structures (Fig. S6). Glandular structures accumulating necrotic debris in the lumen were also frequently seen (Fig. S5 A′′ and B′′, black arrow heads), and were often CEA positive (Fig. 6 K and L).
Fig. S5.
The zPDX conserve basic histological features of the original tumors. Representative microphotographs of parental tumors: patient #2 (A1 and A2), patient#4 (B), patient#5 (C), and their matching zebrafish PDX (A′–A′′′, B′ and B′′, and C′ and C′′). A′, B′, and C′ are a low magnification of a representative zPDX, showing localization of the tumor mass in the abdominal cavity. A′′, A′′′, B′′, and C′′ are higher magnifications of different tumors. Black dashed lines delineate mucin lakes, and red dashed lines denote glandular structures. Mucin and necrotic debris are pointed with red and black arrows, respectively. (Scale bar, 50 μm.) Note that a fine line of agarose inclusion might be detected around the xenograft due to the agarose embedding step prior to paraffin inclusion.
Fig. S6.
PAS+D staining of zPDX sections. Representative microphotographs zPDX tumors derived from patient#2 (A) and patient#5 (B) at 4 dpi; red arrows depict mucin content within glandular structures by PAS+D staining. (Scale bar, 50 μm.) Note that a fine line of agarose inclusion might be detected around the xenograft due to the agarose embedding step prior to paraffin inclusion.
Comparison of zPDX Drug Treatment with Short-Term Patient Treatment Responses.
To test our model as a platform to study response to treatment, we used available surgically resected CRC samples derived from patients who were subjected to FOLFOX adjuvant chemotherapy to reduce risk of disease relapse. At the time of initial diagnosis, almost two thirds of patients with CRC undergo resection with curative intent. However, 30 to 50% of these patients relapse and die of their disease. The majority of these recurrences occur during the first 2 y after surgery, and most follow-up programs end 5 y after the primary treatment (32). FOLFOX postoperative adjuvant treatment has been shown to reduce chances of relapse, improving disease-free survival (33).
Although not the ideal setting to study predictability, we sought to test whether response to FOLFOX treatment in zPDX would anticipate a delay in relapse in the matching patients, or whether resistance to drug treatment in our model would associate with tumor relapse.
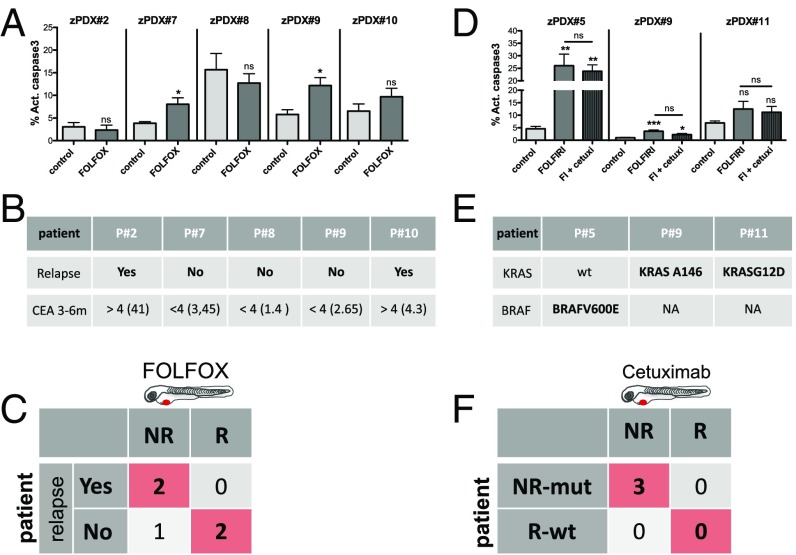
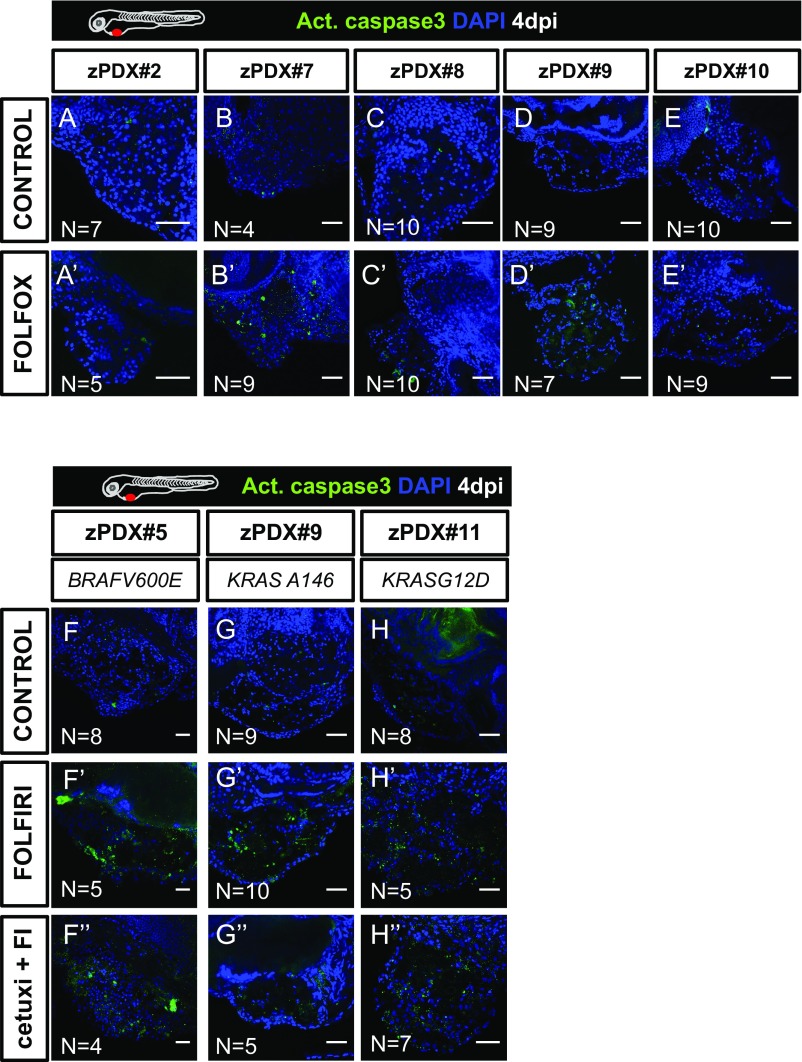
We generated zPDX from five different tumors and treated them with FOLFOX over 3 days. Of the five zPDX, we could only observe response to FOLFOX treatment (induction of activated caspase3) in two zPDX (Fig. 7A and Fig. S7). These zPDX correspond to patients in whom, 6 mo after surgery, the levels of CEA remain stable, with no indication of relapse. In contrast, of the three zPDX in which we could not detect response to FOLFOX treatment, two are already in relapse after 3 mo, with increasing levels of CEA and clinical evidence of recurrence (Fig. 7 A and B and Fig. S7). Thus, we could anticipate relapse/no relapse within 3 mo to 6 m after surgery in four out of five patients.
Fig. 7.
The zPDX treatment response may predict relapse and correlate with known genomic biomarkers of Cetuximab resistance. Five zPDX, corresponding to patients subjected to curative surgery and postoperative FOLFOX adjuvant treatment, were treated with FOLFOX for 3 days and processed for immunofluorescence. Cell death by apoptosis (A) (activated caspase3) was analyzed and quantified. The zPDX#7 control vs. FOLFOX P = 0.037; zPDX#9 control vs. FOLFOX P = 0.016. (B) Relapse and CEA levels information for the five patients analyzed. (C) Confusion matrix displays the number of patients with actual and predicted responses in zPDX, i.e., responders are patients that did not relapse (R), and patients that relapse are the nonresponders (NR). (D) Three zPDX were treated with FOLFIRI and with FOLFIRI in combination with Cetuximab, and cell death by apoptosis (activated caspase3) was analyzed. The zPDX#5 control vs. FOLFIRI P = 0.0043, and control vs. FOLFIRI+Cetuximab P = 0.0084; zPDX#9 control vs. FOLFIRI P = 0.001, and control vs. FOLFIRI+Cetuximab P = 0.012. (E) Genomic information of the analyzed patients. (F) Confusion matrix displays the number of patients with mutations predicted of resistance with predicted responses in zPDX. *P < 0.05; **P < 0.005; ***P < 0.0001; ns, nonsignificant.
Fig. S7.
zPDX treatments. Five zPDX were treated with FOLFOX for 3 days and processed for activated caspase3 immunofluorescence (A–E′). Three zPDX were treated with FOLFIRI and FOLFIRI plus Cetuximab, activated caspase3 was detected by immunofluorescence (F–H′′). Number of zPDX analyzed for each condition is indicated in the figure. (Scale bar, 50 μm.)
Our previous results on the sensitivity to Cetuximab treatment in detecting responses in tumors with KRASG13D mutations prompted us to test whether response to Cetuximab in zPDX would correlate with genomic prediction of response to the EGFR blocking therapy. As a proof of concept, to test this assumption, we treated three zPDX with a combination of FOLFIRI with Cetuximab and with FOLFIRI alone. In the three zPDX generated, we could observe no added effect of Cetuximab in combination with FOLFIRI, suggesting that the three tumors tested showed resistance to Cetuximab (Fig. 7D and Fig. S7 F–H′′). We later sequenced the corresponding tumors and observed that all of them harbored mutations on either KRAS or BRAF (Fig. 7E). All these mutations highly correlated to resistance to Cetuximab (34). Thus, our results corroborated the genomic prediction (Fig. 7F).
Even though we have not yet gathered sufficient patient numbers to reach statistical significance, we performed proof-of-concept experiments to set the groundwork for a future clinical study to test the predictiveness of zPDX in the more suitable neoadjuvant setting.
Discussion
Recent genome cancer profile studies exposed unanticipated tumor heterogeneity. This heterogeneity has been observed not only between cancers (intertumor) but also within each cancer (intratumor) (35, 36). Even identical CRC clones that share the same genome exhibit multiple functional profiles (including distinct responses to therapies) (37), implying that the basis for heterogeneity is not only genetic. Most approved drugs lack known biomarkers, and, even in biomarker-driven therapies, response rates are not foolproof (36, 38). Thus, in the current scenario, we are currently unable to securely forecast which patient is likely to respond to a given therapy program.
Chemosensitivity tests are not a novel idea. However, the accuracy of in vitro tests has not been robust enough to support its use in oncology practice (39). Recently, Letai and colleagues (40) showed a promising in vitro assay that bypasses serial passages and directly challenges tumor cells with therapeutic drugs, using BH3 profiling as a proxy of cell death. In this assay, there is a direct measurement of mitochondrial stress upon the applied drug (40, 41). In addition, in vitro organoids constitute a major technological breakthrough for the study of tumor biology, drug discovery, and, possibly, personalized medicine (42).
Although promising, in vitro tests will always lack the complexity of interactions of tumor cells with their microenvironment in the in vivo setting. The current gold standard for in vivo assessment of tumor heterogeneity and response to therapy is mouse PDX (1). However, mouse PDX are not practical for clinical advice due to the time it takes to implant tumors and expand colonies, and the costs they entail. Here, we have taken an intermediate approach—a fast in vivo assay with unprecedented cellular resolution—the zebrafish larvae xenograft model.
We set out to test whether the zebrafish larvae xenografts have enough resolution to uncover functional cancer heterogeneity to screen in vivo international treatment guidelines. Our study shows that zebrafish xenografts are capable of discriminating, with single-cell resolution, distinct proliferation dynamics and differential metastatic potentials, not only between tumors derived from different patients but also between isogenic pairs.
Our ultimate goal was to screen the major therapeutic options present in the international guidelines for advanced CRC (19) using the zebrafish xenograft assay. We analyzed the response of five zebrafish xenografts (cell line-derived) to the two most common and equivalent chemotherapy options FOLFOX and FOLFIRI (21) and observed an overall higher sensitivity to FOLFIRI than to FOLFOX. This is in agreement with the study by Sadanandam et al. (11) that found that 70% of stem-like subtype tumors were associated with a clinical benefit with FOLFIRI treatment. Remarkably, we could also observe a clear differential response to therapy between isogenic tumors, illustrating differential therapy responses between primary and metastatic tumors (SW480/SW620) and subclonal tumor populations (HCT116/Hke3). We also reproduced polyclonal tumor scenarios and show differential responses to chemotherapy in the same xenograft and how therapy can select for minor resistant clones.
Following the next recommended therapy in the guidelines, we tested for Cetuximab sensitivity. Cetuximab treatment is a biomarker-driven therapy, recommended specifically for KRASWT tumors. Although not effective in all patients with KRASWT tumors (only ∼12.8%), the probability of response to Cetuximab treatment is still significantly higher (26). To our surprise, Cetuximab was effective on HCT116 KRASG13D. Consistent with our results, recent clinical reports revealed that a significant portion of patients with KRASG13D mutations, but not KRASG12V, benefit from Cetuximab treatment (27). Thus, our results suggest that zebrafish xenografts can measure responsiveness to therapy of tumors with different KRAS point mutations. Our study also illustrates the relevance of functional assays even in biomarker-driven therapies to further select the patients that may benefit from specific therapies, specifically in ones that do not have 100% efficacy and are expensive or toxic.
Although Hke3 KRASWT tumors responded to Cetuximab treatment, this was not accompanied by a reduction of tumor size. Thus, we tested the third-line option for refractory metastatic CRC—regorafenib. In contrast to previous treatments, Hke3 tumors now responded to therapy with an induction of apoptosis accompanied by reduction of tumor size. Our results illustrate the possibility of screening treatment guidelines from first to third line.
We also validated our results obtained in zebrafish in mouse xenografts. This study directly compares zebrafish and mouse xenograft chemosensitivity. As in zebrafish, HCT116 responded to both treatments, but FOLFIRI produced a significantly higher induction of apoptosis than FOLFOX, and Hke3 seemed refractory to both treatments. Our results suggest that using apoptosis and reduction of mitotic index as a surrogate as a response to treatment in zebrafish xenografts (4 days from injection to analysis) can be used as a proxy of the response to treatment in mouse xenografts (minimal 1 mo since injection to analysis). The disparity in time between models is likely to reflect the difference in scale of the models (>10,000 fold). On one hand, zebrafish larvae allow for visualization of single cells and their response to treatment in multiple xenografts, improving statistical power. In contrast, mouse PDX generally rely on large palpable tumors, long treatments to visualize responses, and multiple rounds of expansion to provide statistical power. On the other hand, this longer assay permits the study of tumor evolution, emergence of resistance clones, and overall progression of disease (1, 37). Thus, we envisage that zebrafish and mouse xenograft models may complement each other: zebrafish as a fast screening platform, and mouse xenografts to accompany tumor evolution and relapse.
Lastly, we also demonstrate the feasibility of using primary patient samples to generate zPDX with similar implantation rates as tumor cell lines. We show that zPDX can form tumor masses, induce vascularization, and present multilocular mucin lakes, glandular structures, and CEA expression. As observed with cell lines (SW480), patient samples (e.g., zPDX#3) also vary in their engraftment efficiency (being as low as <50%). To overcome possible low implantation rates, we may increase the number of injected fish and use immune-compromised strains (43, 44) to dampen the possibility of rejection. As a proof of concept experiments, we also treated zPDX with FOLFOX and were able to anticipate relapse/no relapse within 3 m to 6 m after surgery in four out of five patients. In addition, we sequenced tumors whose matching zPDX did not respond to Cetuximab, and found that all harbored mutations highly linked to Cetuximab resistance, corroborating our zPDX results with genomic data.
In summary, we performed proof-of-concept experiments that show that it is possible to screen the available therapeutic options present in the international CRC guidelines by using zebrafish xenografts. We show that zebrafish larvae xenografts constitute a rapid model with high sensitivity to unravel human tumor functional heterogeneity. We also performed proof-of-concept experiments using patient samples to set the groundwork for a clinical study to test the predictiveness of zPDX as a rapid in vivo screening platform for personalized cancer treatments.
SI Materials and Methods
Zebrafish Xenograft Injection Details.
Dil-labeled cells were injected into the PVS of anesthetized 48-hpf larvae (8). After injection, xenografts were transferred to 34 °C until the end of experiments. To reduce variability, at 24 pi, successful injected xenografts were sorted into classes according to the tumor size (class 1, ∼1,000 cells; class 2, ∼500 cells). Sorted classes were randomly distributed into control and experimental groups and maintained separately until the end of experiment. Larvae with cells in the yolk or cellular debris were discarded.
Zebrafish Xenograft Drug Administration Details.
The 24-hpi zebrafish xenografts with the same tumor size were randomly distributed in the treatment groups: control E3 medium, FOLFIRI in E3, and FOLFOX in E3 (4.2 mM 5-FU, 0.18 mM folinic acid, 0.08 mM irinotecan, 0.08 mM oxaliplatin) for three consecutive days, replaced daily. An average of 30 xenografts were treated per condition.
Using, as a reference, the maximum patient’s plasma concentration of each compound (Table S2), we determined the zebrafish maximum tolerated concentration. This concentration (10× the patient plasma concentration) showed an average mortality of 21% in FOLFIRI and 19% in FOLFOX (n = 200 each condition, control 5% mortality).
Cetuximab monoclonal antibody was added to the cell suspension (20 μg⋅mL−1) at the time of injection and then, at 24 hpi, was added to the fish E3 medium at 10× the plasma concentration (100 μg⋅mL−1). We found that Cetuximab needs to be added directly into the cell suspension and in the fish water to have an effect on tumor viability. Higher concentrations of Cetuximab were toxic for the zebrafish host. Regorafenib was at 40 mM in the fish E3 medium.
Mouse Xenografts and Treatment.
Animal procedures were conducted in accordance with the EU guidelines and approved by the Portuguese Veterinary General Board.
Four-month-old nonobese diabetic (NOD)-SCID female mice were injected with 1 × 10⁶ HCT116 cells (right flank) and 1 × 10⁷ Hke3 cells (left flank) mixed 1:1 with PBS (Gibco) and Matrigel (BD Bioscience), s.c., in both flanks, as previously described in ref. 28. The 14-dpi tumor growth was assessed by palpation and calipers. Mice were randomly distributed into three groups (five per group): FOLFIRI, FOLFOX, and vehicle, administered by i.p. injection. FOLFIRI: 5FU (30 mg⋅kg−1) and calcium levofolinate (45 mg⋅kg−1) on days 1, 6, and 11 and irinotecan (20 mg⋅kg−1) on days 2, 7, and 12. FOLFOX: 5FU (30 mg⋅kg−1) and calcium levofolinate (45 mg⋅kg−1) on days 1, 6, and 11 and oxaliplatin (12.5 mg⋅kg−1) on days 2, 7, and 12. Control mice were injected with vehicle (PBS) on the same days. Mice were screened and weighed frequently to identify possible treatment-induced toxicity. Tumor size was evaluated twice a week by caliper measurements, and tumor volumes were calculated according to (longest tumor diameter) × (shortest tumor diameter)2 × 0.5. When the tumors reached 1 cm3, mice were euthanized, necropsy was performed, and tumors were excised and processed for routine histopathological analysis.
Zebrafish Xenograft Implantation.
The tumor implantation percentage was calculated as follows:
Cell Staining.
Cells were grown to 70% confluence, washed with Dulbecco's phosphate-buffered saline (DPBS) 1× (Gibco; Life Technologies), and stained in flask with Dil (Vybrant; Molecular Probes, Life Technologies, 4 µL/mL in DPBS 1×) for 10 min at 37 °C followed by 15 min on ice in darkness. Cells were washed with DPBS, detached with 2 mM EDTA by scraping, centrifuged 4 min at 135 × g, and resuspended in DMEM. Cell viability was assessed by the trypan blue exclusion method, and cell number was determined by hemocytometer counting. Cells were resuspended in DPBS to a final concentration of 0.25 × 10⁶ cells/μl.
Human Tissue Processing.
All samples used for zPDX establishment were obtained from Champalimaud Hospital or Prof. Doutor Fernando Fonseca Hospital with written informed consent. The study was approved by the Ethics Committees of both Hospitals. Neoplastic colonic tissues were obtained from surgically resected specimens.
The samples were kept in collection media containing a mixture of antibiotics and antifungals until processing (Table S4) at 4 °C. Fresh tumors were washed seven times in ice-cold PBS and chopped into small pieces and cryopreserved in 90% FBS 10% DMSO and stored in liquid nitrogen. Cryopreserved human primary tumor tissue was defrosted, and tumor tissue was further minced in mix1 (Table S4). Subsequently, tissue was digested with Liberase (Roche) for 10 min at 37 °C with vigorous pipetting. Tumor cell suspension was passed through a 70-μm cell strainer and centrifuged at 1,200 rpm for 4 min. For cell labeling, tumor cells were incubated with the fluorescent cell tracker DiI (10 µL⋅mL−1) in mix2 (Table S4), for 15 min at 37 °C and then for 5 min on ice. Tumor cells were checked for viability with trypan blue dye exclusion. Cells were resuspended in mix1 supplemented with human EGF (50 ng⋅mL−1, Peprotech) (Table S4) to a final concentration of 0.25 × 10⁶ cells per milliliter for injection. Samples with high bacterial load or poor quality with extensive necrosis which resulted in few viable cells and/or failed to show tumor masses at 24 hpi were discarded.
Histological Evaluation of Primary, Xenografts, and PDX Tumors.
Mouse tumor xenografts, zPDX, and primary human tumors were formalin-fixed, paraffin-embedded, sectioned at 3 μm, and stained with Hematoxylin and Eosin for routine histopathological analysis. Microphotographs were captured in a Leica DM2000 microscope coupled to a Leica MC170 camera.
Immunofluorescence.
Zebrafish xenografts were fixed in 4% formaldehyde and stored in methanol at −20 °C. Primary antibodies used: anti-Ki-67 (mouse Novocastra clone MM1), anti-caspase3 (rabbit CST), anti-human HLA (rabbit former MHC-class I ABCAM, ab52922), anti–β-catenin (mouse Novocastra clone 17C2), anti-CK20 (mouse Novocastra clone PW31), anti-laminin (rabbit polyclonal Sigma), anti-human mitochondria (mouse Milipore clone113-1), in general 1:100. Secondary antibodies Alexa goat anti-mouse 488 (1:400) and Alexa goat anti-rabbit 647 (1:400), nuclei were counterstained with DAPI. Xenografts were mounted with Dako media and stored at 4 °C. For mouse immunofluorescence in paraffin sections, slides were incubated with anti-caspase3 (rabbit CST 1:100) after antigen retrieval in Tris-EDTA 10 mM pH9 (20 min at 70 °C).
Immunohistochemistry.
Xenografts were embedded in 2% agarose to facilitate paraffin embedding. Then 3-μm sections were performed and stained with H&E every five slides. Heat-induced epitope retrieval was performed at ∼100 °C using Citrate Buffer (∼pH 6, anti-CK20 mouse Novocastra) or EDTA Buffer (∼pH 9, anti-Ki-67 mouse, Novocastra) for 20 min before incubation with primary antibodies.
EdU Staining.
Two hours prior to fixation, 4-dpi xenografts were placed in 500 mM EdU in E3 medium. Xenografts were fixed in 4% FA and stored in 100% methanol. EdU detection was performed according to manufacture recommendations (EdU Click-iT- Alexa 488 Invitrogen).
Imaging and Quantification.
All images were obtained in a Zeiss LSM 710 confocal microscope, generally with a 5-μm interval. The number of cells was quantified with ImageJ software Cell counter plugin.
The number of total DAPI or Ki-67 cells = AVG (3 slices Zfirst, Zmidle, Zlast) × total number slices/1.5.
Metastatic Potential Quantification.
To distinguish between early and late metastatic events, human CRC cell lines were injected into the PVS only (group_a) or PVS plus circulation (group_b). At 1 hpi, we further confirmed and sorted xenografts into these two groups. At 4 dpi, we analyzed and quantified the number of xenografts that had tumor masses away from the injection site—in the CHT.
For tumor cells in group_a to efficiently establish metastasis, they would have to go through all of the metastatic steps, whereas cells in group_b only must go through the later-stage ones. Thus, considering that maximum metastatic efficiency is achieved when cells are placed in circulation (group_b), the reduction of colonization in group_a would reflect the effort to undergo the early metastatic steps. The raw percentage of CHT colonization was converted into EMP and LMP, calculated as follows:
Imaging and Angiogenesis Quantification.
All images were obtained in a Zeiss LSM 710 Zeiss confocal microscope at 40× objective, with a 3-μm interval.
TVD and VI were quantified in maximum z projections of corresponding images, using Image J. This method revealed a 1% relative error in relation to quantification of each slice (n = 35 xenografts compared). Movies were created using ImageJ.
Statistical Analysis.
Prism software was used for statistical analysis. All datasets were challenged by a normality test. Datasets with a Gaussian distribution were analyzed by unpaired t test. Datasets that did not pass the normality test were analyzed by the Mann−Whitney test. Differences were considered significant at P < 0.05.
Materials and Methods
Animal Care and Handling.
Zebrafish (Danio rerio) casper, nacre, and Tg(fli1:eGFP) fish were handled according to European animal welfare regulations and standard protocols.
Human Tissue.
All samples used for zPDX establishment were obtained from Champalimaud Hospital or Prof. Doutor Fernando Fonseca Hospital with written informed consent. The study was approved by the Ethics Committees of both hospitals.
Cell Lines and Culture.
Colon cancer cell lines, SW480, SW620, and HT29, originally from American Type Culture Collection, were authenticated through short tandem repeat profiling karyotyping isoenzyme analysis. HCT116 and Hke3 isogenic cell lines were donated by Angela Relógio and analyzed. All cell lines were tested for mycoplasma. All cells were cultured in DMEM (Biowest) supplemented with 10% FBS (Biochrom) and 1% Penicillin−Streptomycin (HyClone) in a humidified atmosphere containing 5% CO2 at 37 °C.
Zebrafish Xenografts Injection.
Dil-labeled cells were injected into the PVS of anesthetized 48-hpf larvae (8). After injection, xenografts were transferred to 34 °C until the end of experiments.
Zebrafish Xenograft Drug Administration.
The 24-hpi zebrafish xenografts with the same tumor size were randomly distributed in the treatment groups: control E3 medium, FOLFIRI in E3, and FOLFOX in E3 (4.2 mM 5-FU, 0.18 mM folinic acid, 0.08 mM irinotecan, 0.08 mM oxaliplatin) for three consecutive days. Using, as a reference, the maximum patient’s plasma concentration of each compound (Table S2), we determined the zebrafish maximum tolerated concentration. Cetuximab monoclonal antibody was added to the cell suspension (20 μg/ml) at the time of injection and then to E3 medium at 100 μg/ml. Regorafenib was added to E3 to a final concentration of 40 mM.
Supplementary Material
Acknowledgments
We thank the Surgery and Histopathology Units of Champalimaud Clinical Center (A. Beltran, L. G. Madruga, M. Castillo, and Dr. J. F. Cunha) and Hospital Prof. Doutor Fernando Fonseca for patient samples and pathology support; Champalimaud Fish and Rodents Facility (C. Certal and S. Mello) and Instituto Gulbenkian de Ciência (IGC) Fish Facility for excellent animal care; and The IGC and Instituto de Medicina Molecular (IMM) histology units. We also thank A. Relógio for the HCT116 and Hke3 cell lines. We are grateful to B. Costa-Silva, C. Carvalho, L. Saúde, and L. Patton for critically reading of the manuscript and J. Escandell and I. P. Castro for helpful discussions. We thank the Champalimaud Foundation and Howard Hughes Medical Institute (HHMI) for financial support. M.G.F. is an HHMI International Early Career scientist.
Footnotes
The authors declare no conflict of interest.
This article is a PNAS Direct Submission.
See Commentary on page 10306.
This article contains supporting information online at www.pnas.org/lookup/suppl/doi:10.1073/pnas.1618389114/-/DCSupplemental.
References
- 1.Hidalgo M, et al. Patient-derived xenograft models: An emerging platform for translational cancer research. Cancer Discov. 2014;4:998–1013. doi: 10.1158/2159-8290.CD-14-0001. [DOI] [PMC free article] [PubMed] [Google Scholar]
- 2.Zon L, Peterson R. The new age of chemical screening in zebrafish. Zebrafish. 2010;7:1. doi: 10.1089/zeb.2010.9996. [DOI] [PubMed] [Google Scholar]
- 3.White R, Rose K, Zon L. Zebrafish cancer: The state of the art and the path forward. Nat Rev Cancer. 2013;13:624–636. doi: 10.1038/nrc3589. [DOI] [PMC free article] [PubMed] [Google Scholar]
- 4.Veinotte CJ, Dellaire G, Berman JN. Hooking the big one: The potential of zebrafish xenotransplantation to reform cancer drug screening in the genomic era. Dis Model Mech. 2014;7:745–754. doi: 10.1242/dmm.015784. [DOI] [PMC free article] [PubMed] [Google Scholar]
- 5.Haldi M, Ton C, Seng WL, McGrath P. Human melanoma cells transplanted into zebrafish proliferate, migrate, produce melanin, form masses and stimulate angiogenesis in zebrafish. Angiogenesis. 2006;9:139–151. doi: 10.1007/s10456-006-9040-2. [DOI] [PubMed] [Google Scholar]
- 6.Marques IJ, et al. Metastatic behaviour of primary human tumours in a zebrafish xenotransplantation model. BMC Cancer. 2009;9:128. doi: 10.1186/1471-2407-9-128. [DOI] [PMC free article] [PubMed] [Google Scholar]
- 7.Nicoli S, Ribatti D, Cotelli F, Presta M. Mammalian tumor xenografts induce neovascularization in zebrafish embryos. Cancer Res. 2007;67:2927–2931. doi: 10.1158/0008-5472.CAN-06-4268. [DOI] [PubMed] [Google Scholar]
- 8.Zhao C, et al. A novel xenograft model in zebrafish for high-resolution investigating dynamics of neovascularization in tumors. PLoS One. 2011;6:e21768. doi: 10.1371/journal.pone.0021768. [DOI] [PMC free article] [PubMed] [Google Scholar]
- 9.Hewitt RE, et al. Validation of a model of colon cancer progression. J Pathol. 2000;192:446–454, and correction (2001) 194:507. doi: 10.1002/1096-9896(2000)9999:9999<::AID-PATH775>3.0.CO;2-K. [DOI] [PubMed] [Google Scholar]
- 10.Shirasawa S, Furuse M, Yokoyama N, Sasazuki T. Altered growth of human colon cancer cell lines disrupted at activated Ki-ras. Science. 1993;260:85–88. doi: 10.1126/science.8465203. [DOI] [PubMed] [Google Scholar]
- 11.Sadanandam A, et al. A colorectal cancer classification system that associates cellular phenotype and responses to therapy. Nat Med. 2013;19:619–625. doi: 10.1038/nm.3175. [DOI] [PMC free article] [PubMed] [Google Scholar]
- 12.Hanahan D, Weinberg RA. Hallmarks of cancer: The next generation. Cell. 2011;144:646–674. doi: 10.1016/j.cell.2011.02.013. [DOI] [PubMed] [Google Scholar]
- 13.Lawson ND, Weinstein BM. In vivo imaging of embryonic vascular development using transgenic zebrafish. Dev Biol. 2002;248:307–318. doi: 10.1006/dbio.2002.0711. [DOI] [PubMed] [Google Scholar]
- 14.Xiao F, et al. MicroRNA-885-3p inhibits the growth of HT-29 colon cancer cell xenografts by disrupting angiogenesis via targeting BMPR1A and blocking BMP/Smad/Id1 signaling. Oncogene. 2015;34:1968–1978. doi: 10.1038/onc.2014.134. [DOI] [PubMed] [Google Scholar]
- 15.Lai KC, et al. Diallyl trisulfide inhibits migration, invasion and angiogenesis of human colon cancer HT-29 cells and umbilical vein endothelial cells, and suppresses murine xenograft tumour growth. J Cell Mol Med. 2015;19:474–484. doi: 10.1111/jcmm.12486. [DOI] [PMC free article] [PubMed] [Google Scholar]
- 16.Nguyen DX, Bos PD, Massague J. Metastasis: From dissemination to organ-specific colonization. Nat Rev Cancer. 2009;9:274–284. doi: 10.1038/nrc2622. [DOI] [PubMed] [Google Scholar]
- 17.Valastyan S, Weinberg RA. Tumor metastasis: Molecular insights and evolving paradigms. Cell. 2011;147:275–292. doi: 10.1016/j.cell.2011.09.024. [DOI] [PMC free article] [PubMed] [Google Scholar]
- 18.Stoletov K, et al. Visualizing extravasation dynamics of metastatic tumor cells. J Cell Sci. 2010;123:2332–2341. doi: 10.1242/jcs.069443. [DOI] [PMC free article] [PubMed] [Google Scholar]
- 19.Van Cutsem E, Cervantes A, Nordlinger B, Arnold D. The ESMO Guidelines Working Group Metastatic colorectal cancer: ESMO clinical practice guidelines for diagnosis, treatment and follow-up. Ann Oncol. 2014;25(Suppl 3):iii1–iii9. doi: 10.1093/annonc/mdu260. [DOI] [PubMed] [Google Scholar]
- 20.Ninomiya I, et al. Anti-metastatic effect of capecitabine on human colon cancer xenografts in nude mouse rectum. Int J Cancer. 2004;112:135–142. doi: 10.1002/ijc.20360. [DOI] [PubMed] [Google Scholar]
- 21.Colucci G, et al. Phase III randomized trial of FOLFIRI versus FOLFOX4 in the treatment of advanced colorectal cancer: A multicenter study of the Gruppo Oncologico Dell’Italia Meridionale. J Clin Oncol. 2005;23:4866–4875. doi: 10.1200/JCO.2005.07.113. [DOI] [PubMed] [Google Scholar]
- 22.Klampfer L, et al. Oncogenic Ras increases sensitivity of colon cancer cells to 5-FU-induced apoptosis. Oncogene. 2005;24:3932–3941. doi: 10.1038/sj.onc.1208552. [DOI] [PubMed] [Google Scholar]
- 23.Priego S, et al. Natural polyphenols facilitate elimination of HT-29 colorectal cancer xenografts by chemoradiotherapy: A Bcl-2- and superoxide dismutase 2-dependent mechanism. Mol Cancer Ther. 2008;7:3330–3342. doi: 10.1158/1535-7163.MCT-08-0363. [DOI] [PubMed] [Google Scholar]
- 24.Van Schaeybroeck S, et al. ADAM17-dependent c-MET-STAT3 signaling mediates resistance to MEK inhibitors in KRAS mutant colorectal cancer. Cell Rep. 2014;7:1940–1955. doi: 10.1016/j.celrep.2014.05.032. [DOI] [PubMed] [Google Scholar]
- 25.Iwamoto M, et al. Regulation of 18F-FDG accumulation in colorectal cancer cells with mutated KRAS. J Nucl Med. 2014;55:2038–2044. doi: 10.2967/jnumed.114.142927. [DOI] [PubMed] [Google Scholar]
- 26.Karapetis CS, et al. K-ras mutations and benefit from cetuximab in advanced colorectal cancer. N Engl J Med. 2008;359:1757–1765. doi: 10.1056/NEJMoa0804385. [DOI] [PubMed] [Google Scholar]
- 27.De Roock W, et al. Association of KRAS p.G13D mutation with outcome in patients with chemotherapy-refractory metastatic colorectal cancer treated with cetuximab. JAMA. 2010;304:1812–1820. doi: 10.1001/jama.2010.1535. [DOI] [PubMed] [Google Scholar]
- 28.Chen D, Wei L, Yu J, Zhang L. Regorafenib inhibits colorectal tumor growth through PUMA-mediated apoptosis. Clin Cancer Res. 2014;20:3472–3484. doi: 10.1158/1078-0432.CCR-13-2944. [DOI] [PMC free article] [PubMed] [Google Scholar]
- 29.Grothey A, et al. Regorafenib monotherapy for previously treated metastatic colorectal cancer (CORRECT): An international, multicentre, randomised, placebo-controlled, phase 3 trial. Lancet. 2016;381:303–312. doi: 10.1016/S0140-6736(12)61900-X. [DOI] [PubMed] [Google Scholar]
- 30.Sato T, et al. Long-term expansion of epithelial organoids from human colon, adenoma, adenocarcinoma, and Barrett’s epithelium. Gastroenterology. 2011;141:1762–1772. doi: 10.1053/j.gastro.2011.07.050. [DOI] [PubMed] [Google Scholar]
- 31.Fujii M, et al. A colorectal tumor organoid library demonstrates progressive loss of niche factor requirements during tumorigenesis. Cell Stem Cell. 2016;18:827–838. doi: 10.1016/j.stem.2016.04.003. [DOI] [PubMed] [Google Scholar]
- 32.Guyot F, et al. Time trends in the treatment and survival of recurrences from colorectal cancer. Ann Oncol. 2005;16:756–761. doi: 10.1093/annonc/mdi151. [DOI] [PubMed] [Google Scholar]
- 33.André T, et al. Multicenter International Study of Oxaliplatin/5-Fluorouracil/Leucovorin in the Adjuvant Treatment of Colon Cancer (MOSAIC) Investigators Oxaliplatin, fluorouracil, and leucovorin as adjuvant treatment for colon cancer. N Engl J Med. 2004;350:2343–2351. doi: 10.1056/NEJMoa032709. [DOI] [PubMed] [Google Scholar]
- 34.Hsu H, et al. Mutations of KRAS/NRAS/BRAF predict cetuximab resistance in metastatic colorectal cancer patients. Oncotarget. 2016;7:22257–22270. doi: 10.18632/oncotarget.8076. [DOI] [PMC free article] [PubMed] [Google Scholar]
- 35.Vogelstein B, et al. Cancer genome landscapes. Science. 2013;339:1546–1558. doi: 10.1126/science.1235122. [DOI] [PMC free article] [PubMed] [Google Scholar]
- 36.Almendro V, Marusyk A, Polyak K. Cellular heterogeneity and molecular evolution in cancer. Annu Rev Pathol. 2013;8:277–302. doi: 10.1146/annurev-pathol-020712-163923. [DOI] [PubMed] [Google Scholar]
- 37.Kreso A, et al. Variable clonal repopulation dynamics influence chemotherapy response in colorectal cancer. Science. 2013;339:543–548. doi: 10.1126/science.1227670. [DOI] [PMC free article] [PubMed] [Google Scholar]
- 38.Bailey AM, et al. Implementation of biomarker-driven cancer therapy: Existing tools and remaining gaps. Discov Med. 2014;17:101–114. [PMC free article] [PubMed] [Google Scholar]
- 39.Burstein HJ, et al. American society of clinical oncology clinical practice guideline update on the use of chemotherapy sensitivity and resistance assays. J Clin Oncol. 2011;29:3328–3330. doi: 10.1200/JCO.2011.36.0354. [DOI] [PubMed] [Google Scholar]
- 40.Montero J, Letai A. Dynamic BH3 profiling-poking cancer cells with a stick. Mol Cell Oncol. 2016;3:e1040144. doi: 10.1080/23723556.2015.1040144. [DOI] [PMC free article] [PubMed] [Google Scholar]
- 41.Montero J, et al. Drug-Induced death signaling strategy rapidly predicts cancer response to chemotherapy. Cell. 2015;160:977–989. doi: 10.1016/j.cell.2015.01.042. [DOI] [PMC free article] [PubMed] [Google Scholar]
- 42.Young M, Reed KR. Organoids as a model for colorectal cancer. Curr Colorectal Cancer Rep. 2016;12:281–287. doi: 10.1007/s11888-016-0335-4. [DOI] [PMC free article] [PubMed] [Google Scholar]
- 43.Tang Q, et al. Optimized cell transplantation using adult rag2 mutant zebrafish. Nat Methods. 2014;11:821–824. doi: 10.1038/nmeth.3031. [DOI] [PMC free article] [PubMed] [Google Scholar]
- 44.Moore JC, et al. Single-cell imaging of normal and malignant cell engraftment into optically clear prkdc-null SCID zebrafish. J Exp Med. 2016;213:2575–2589. doi: 10.1084/jem.20160378. [DOI] [PMC free article] [PubMed] [Google Scholar]
- 45.Ahmed D, et al. Epigenetic and genetic features of 24 colon cancer cell lines. Oncogenesis. 2013;2:e71. doi: 10.1038/oncsis.2013.35. [DOI] [PMC free article] [PubMed] [Google Scholar]
- 46.Casale F, et al. Plasma concentrations of 5-fluorouracil and its metabolites in colon cancer patients. Pharmacol Res. 2004;50:173–179. doi: 10.1016/j.phrs.2004.01.006. [DOI] [PubMed] [Google Scholar]
- 47.Graham M, et al. Clinical pharmacokinetics of oxaliplatin: A critical review. Proc Am Assoc Cancer Res. 2000;6:1205–1218. [PubMed] [Google Scholar]
- 48.Limacher J, et al. Phase I study of high dose 5-fluorouracil and folinic acid in weekly continuous infusions. Cancer Ther. 2003;1:203–208. [Google Scholar]
- 49.Chabot G. Clinical pharmacokinetics of irinotecan. Clin Pharmacokinet. 1997;33:245–259. doi: 10.2165/00003088-199733040-00001. [DOI] [PubMed] [Google Scholar]
Associated Data
This section collects any data citations, data availability statements, or supplementary materials included in this article.


