Significance
Basic research and medical diagnostics rely on the ability to detect and quantify specific proteins in biological fluids. While numerous current detection techniques exist, these are often limited by trade-offs between ease of use, sensitivity, and cost. Here, we present the nanoswitch-linked immunosorbent assay (NLISA), an accessible, sensitive, and low-cost detection platform that is based upon nanoscale devices that change confirmation upon binding a target protein. NLISA is surface-free and includes a kinetic-proofreading purification step, enabling both enhanced sensitivity and the ability to accurately distinguish between similar proteins from different strains of the same virus or that differ by only a single mutation. Our method is also readily transferable to point-of-care devices due to an easy readout and few hands-on steps.
Keywords: biodetection, point of care, DNA nanotechnology, molecular self-assembly
Abstract
Protein detection and quantification play critical roles in both basic research and clinical practice. Current detection platforms range from the widely used ELISA to more sophisticated, and more expensive, approaches such as digital ELISA. Despite advances, there remains a need for a method that combines the simplicity and cost-effectiveness of ELISA with the sensitivity and speed of modern approaches in a format suitable for both laboratory and rapid, point-of-care applications. Building on recent developments in DNA structural nanotechnology, we introduce the nanoswitch-linked immunosorbent assay (NLISA), a detection platform based on easily constructed DNA nanodevices that change conformation upon binding to a target protein with the results read out by gel electrophoresis. NLISA is surface-free and includes a kinetic-proofreading step for purification, enabling both enhanced sensitivity and reduced cross-reactivity. We demonstrate femtomolar-level detection of prostate-specific antigen in biological fluids, as well as reduced cross-reactivity between different serotypes of dengue and also between a single-mutation and wild-type protein. NLISA is less expensive, uses less sample volume, is more rapid, and, with no washes, includes fewer hands-on steps than ELISA, while also achieving superior sensitivity. Our approach also has the potential to enable rapid point-of-care assays, as we demonstrate by performing NLISA with an iPad/iPhone camera for imaging.
Protein quantification plays a significant role in a wide range of clinical and research applications, from detecting Zika virus infection (1), to ascertaining the presence of a heart attack (2), to finding trace amounts of allergens in food products (3). Over the years, a variety of detection platforms have emerged, from the traditional sandwich ELISA (4), to more sophisticated and costly approaches such as digital ELISA (5). However, the need remains for an approach that combines the simplicity and cost-effectiveness of ELISA, which remains widespread due to these advantages, with the improvements in sensitivity and speed of modern approaches—ideally in a format suitable for both laboratory and rapid, point-of-care applications. One promising strategy, based on recent developments in DNA structural nanotechnology, has been the development of programmable reagents capable of sensing, responding, and reporting changes in their local environments. These include tension gauge tethers to measure the forces required to activate signaling through a ligand–receptor bond (6), toehold switches for paper-based synthetic gene networks (7), nanocalipers to probe nucleosome stability (8), and nanoactuators that can propagate distance changes (9). Proof-of-principle experiments of protein detection using self-assembled DNA nanodevices that undergo changes in shape to report the binding of molecular targets have recently been demonstrated (10, 11), although widespread use of these approaches has been limited due to practical issues including reduced sensitivity, and complexity of readout.
We solve these challenges with a nanoswitch-linked immunosorbent assay (NLISA), an accessible protein detection platform based on DNA nanodevices that not only surpasses ELISA in terms of cost-effectiveness and ease of use but also demonstrates superior sensitivity. NLISA is easy for any laboratory to implement since it is as simple as running a gel, does not require any specialized instrumentation, and costs less than 10 cents to run per sample (Table S1). Furthermore, NLISA results are highly quantitative, enabling the tracking of biomarker concentration over a range of more than four orders of magnitude.
Table S1.
Breakdown of the cost per sample
| Reagent | Source | Cost per sample |
| SYBR gold | Thermo Fisher Scientific | $0.02 |
| UltraPure Agarose | Thermo Fisher Scientific | $0.01 |
| 10× TBE | Bio-Rad | $0.01 |
| Antibodies | Biospacific | $0.02 |
| Protein lobind plate | Sigma | $0.02 |
| Total | $0.08 |
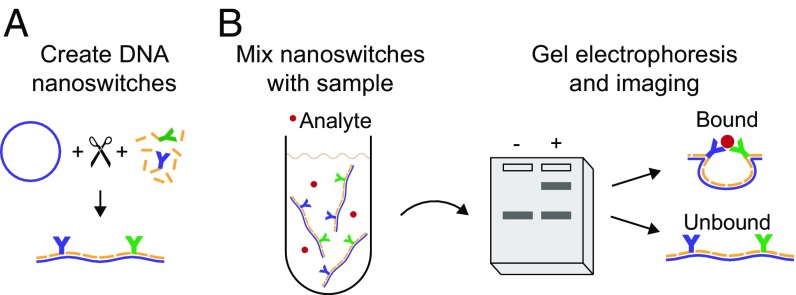
Our approach uses self-assembled DNA nanoswitches which we have shown can be used to characterize the kinetics of molecular interactions (12–14). While we initially designed nanoswitches to enable high-reliability, high-throughput single-molecule force measurements, we later demonstrated that they can be used for ensemble solution measurements, with readout performed using gel electrophoresis. Here, we extend the use of DNA nanoswitches to enable the detection and quantification of proteins in biological fluids by building on sandwich ELISA with an assay that is surface-free, is rapid, and uses kinetic proofreading to reduce background. We implement this with DNA nanoswitch molecular probes formed by linking two antibodies to specific locations along a 7.2-kb DNA scaffold (Fig. 1A). When these DNA nanoswitches are mixed with a sample containing the target molecule, the antibodies sandwich the analyte to form looped structures (Fig. 1B). In the absence of analyte, the nanoswitches remain linear. Looped nanoswitches are separated out from linear nanoswitches through gel electrophoresis, with the amount of analyte in the sample corresponding to the intensity of the looped band.
Fig. 1.
Schematic of the DNA nanoswitch detection technique. (A) DNA nanoswitches are created by hybridizing antibody–oligonucleotide conjugates and tiling oligonucleotides onto a linearized M13 scaffold. (B) DNA nanoswitches can be stored at 4 °C, and then an aliquot can be added to the sample. The resulting mixture is run on an agarose gel and imaged, with positive signal given by the intensity of the slower migrating band that corresponds to looped nanoswitches that have analyte bound.
We demonstrate the utility and sensitivity of our approach not only using spiked buffer samples but also in complex biological matrices such as serum and urine. Analyte capture is performed in solution, eliminating false-positives due to nonspecific binding to surfaces. Specificity is increased through the use of kinetic proofreading (15), with weak, off-target interactions broken during electrophoresis to reduce cross-reactivity. Also, no expensive equipment is required as we demonstrate comparable sensitivities with a mobile imaging platform based on an iPad camera. Since NLISA is very simple, with no washing or enzymatic amplification steps, it can be used as a more sensitive and easier-to-use alternative to ELISA in a laboratory setting or as a point-of-care device.
Results
Creation of Nanoswitch Reagents.
To generate nanoswitches, the key reagent of our assay, we first couple the two sandwiching antibodies to different short oligonucleotides that are complementary to sequences at specific locations along the nanoswitch scaffold. Next, we hybridize on the oligonucleotide-coupled antibodies, along with unmodified tiling oligonucleotides, to a single-stranded DNA scaffold. The antibody-coupling procedure only takes 3 h and nanoswitch creation only takes 3.5 h, so detection can be performed in less than a day from starting reagents. Additionally, if faster creation of nanoswitches is desired, the nanoswitch hybridization time can be reduced to less than 20 min by modifying the annealing procedure to only decrease the temperature over the range of oligonucleotide binding (16); the resulting nanoswitches do not exhibit any loss in looping efficiency (Fig. S1). Once nanoswitches capable of detecting a protein of interest have been created, they can be stored at 4 °C for at least 6 mo. Conveniently, these reagents can then be used to perform rapid detection assays, as described below.
Fig. S1.
(A) Bound intensity for long (90-min) and short (<20-min) nanoswitch construction times for 200 pM PSA. Hybridization conditions are described in Methods, and error bars are the SEM over four replicates. (B) Distribution of melting temperatures in the hybridization buffer (50 mM NaCl, 10 mM MgCl2) for all 121 tiling oligonucleotides computed by the OligoAnalyzer Tool (IDT). (C) Measurement of annealing using SYBR Green I during a normal 90-min hybridization time course stepping down 1° per minute for only the M13 scaffold, only the tiling oligonucleotides, and both the M13 and tiling oligonucleotides.
Intrinsic Sensitivity of NLISA.
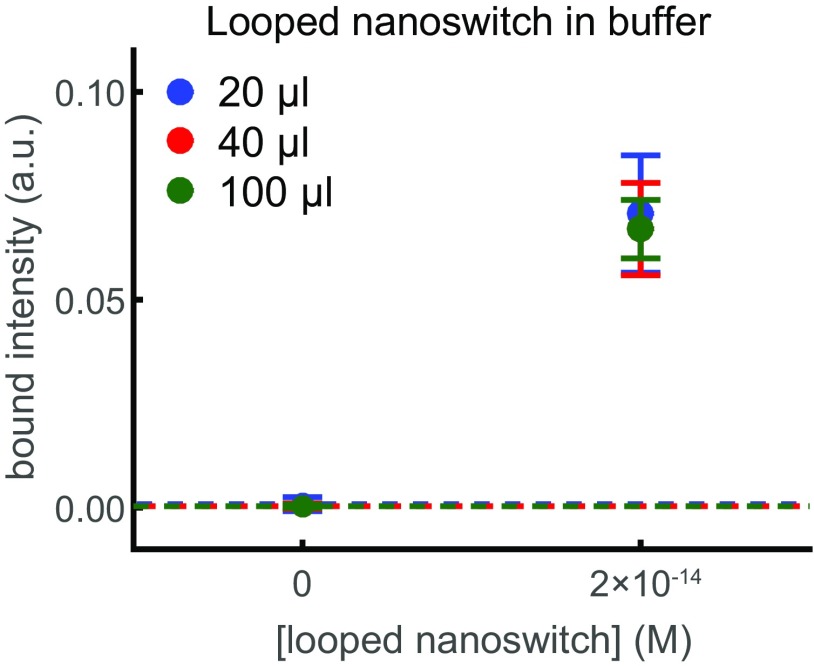
To assess the intrinsic sensitivity of NLISA, we determined the minimum amount of looped nanoswitches we can detect. To create a defined amount of looped nanoswitches, we used an oligonucleotide with complementary sequences to two bridging sites along the nanoswitch. By performing gel electrophoresis of a 20-μL sample of looped nanoswitch on an agarose gel prestained with SYBR Gold, we achieved a limit of detection (LOD) of 1.5 fM, corresponding to 130 fg of DNA (Fig. S2). Here, the LOD is the concentration of biomarker that yields a signal that exceeds the mean background by 3 SDs of the background. When we assayed a 100-μL sample over multiple gel lanes and analyzed the averaged intensity traces as described below, we achieved an LOD of 390 aM (Fig. S2).
Fig. S2.
Detection of looped DNA nanoswitch in buffer. Average bound intensity per lane as a function of concentration in buffer. Results are for 20 μL of sample run in one gel lane (blue), 40 μL of sample run across two gel lanes (red), or 100 μL of sample run across multiple gel lanes (green). Error bars are the SD over eight replicates, with the background given by the dashed line.
Detection of Streptavidin in Buffer.
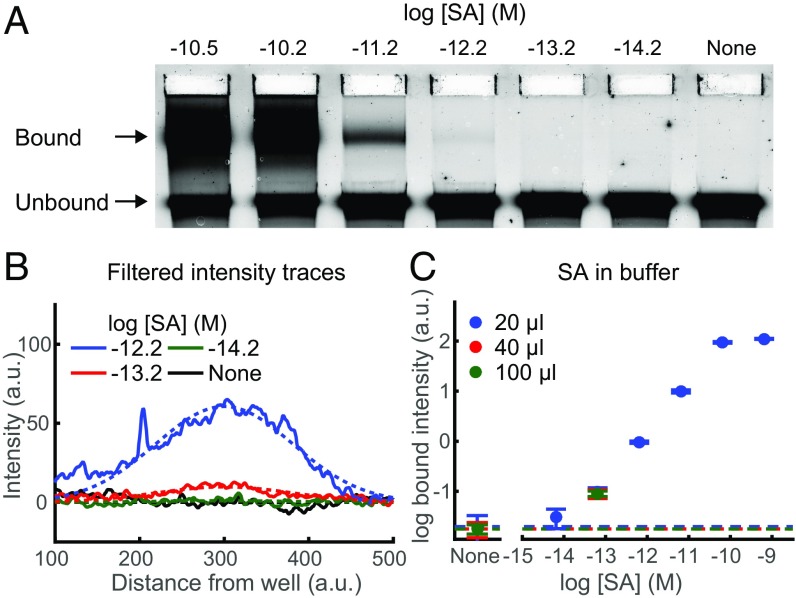
To demonstrate the ability of NLISA to detect a protein in solution, we created nanoswitches with two biotinylated oligonucleotides to measure the concentration of streptavidin (SA) in buffer. Loops sandwiching SA are separated out from unbound, linear nanoswitches using gel electrophoresis (Fig. 2A). The amount of analyte in the sample can be determined by measuring the intensity of the band corresponding to the looped nanoswitches. To accurately quantify the intensity of the bound band, we filter the data to eliminate background from autofluorescent aberrations in the gel. Next, we fit the filtered intensity traces to a skewed Gaussian with a background function (Fig. 2B). NLISA permitted detection of SA from a 20-μL sample with concentrations ranging over four orders of magnitude with an LOD of 22 fM (Fig. 2C). We reached an LOD of 9 fM when we used 100 μL of sample volume spread across multiple lanes and averaged adjacent pairs of the signal traces together before applying our intensity-measuring algorithm (Fig. 2C).
Fig. 2.
DNA nanoswitch detection of streptavidin (SA) in buffer. (A) Representative gel image of SA spiked into buffer, with concentrations ranging from 6.1 × 10⁻¹⁵ to 3.2 × 10⁻¹⁰ M labeled in a log base 10 scale, and a control lane lacking any SA. (B) Representative filtered intensity traces (solid lines) with fitted skew normal and background (dashed lines) for concentrations ranging from 6.1 × 10⁻¹⁵ to 6.1 × 10⁻¹³ M and also a control lane lacking any SA. (C) Log-log plot of average bound intensity per lane as a function of concentration for SA in buffer. Results are for 20 μL of sample run in one gel lane, 40 μL of sample run across two gel lanes, or 100 μL run across five gel lanes. Error bars are the SD, with the background given by the dashed lines, with four replicates per data point.
Detection of Proteins in Biological Fluids.
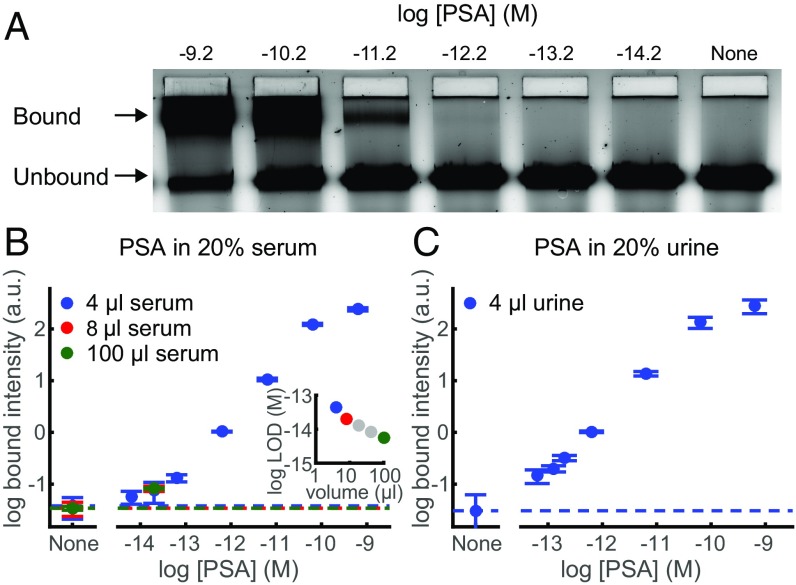
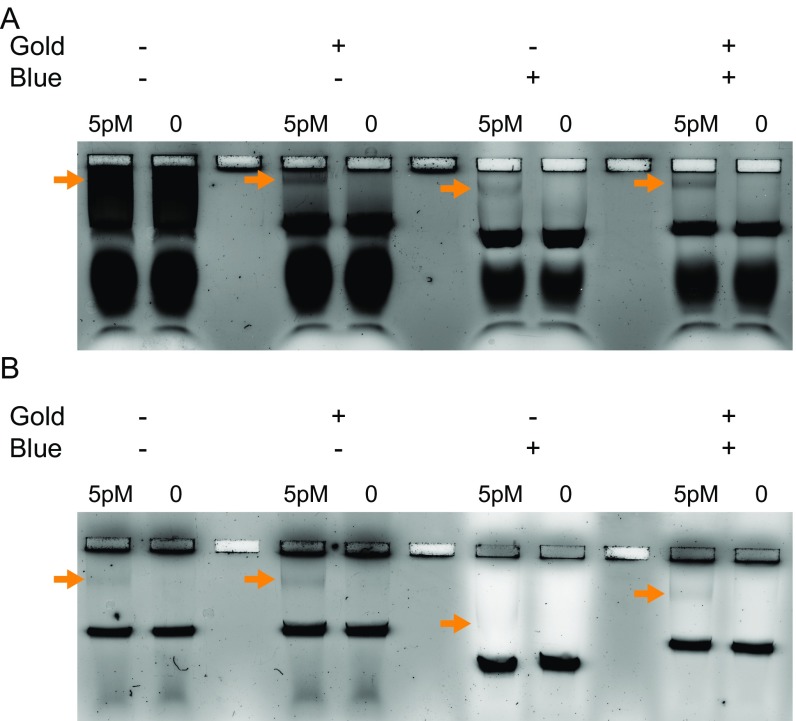
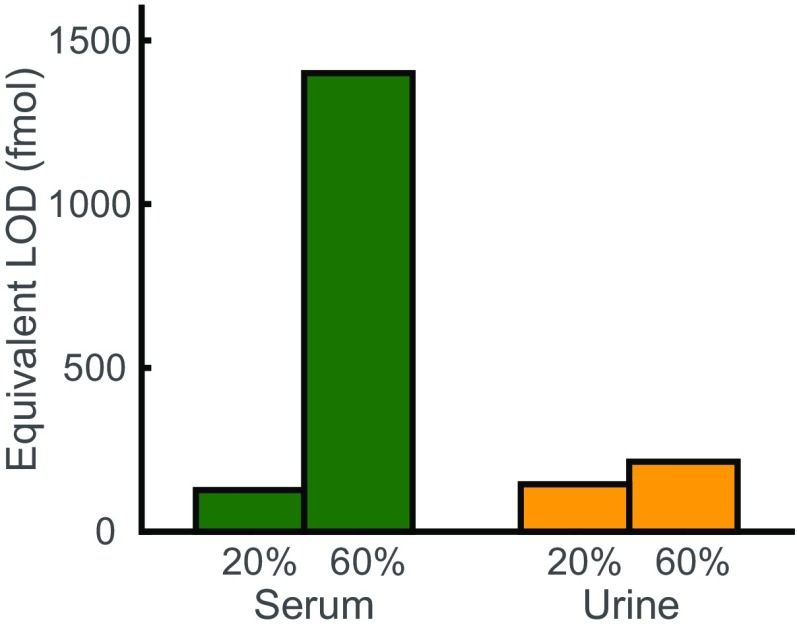
To demonstrate and characterize DNA nanoswitch detection of proteins in biological fluids, we used a pair of sandwiching antibodies that target human prostate-specific antigen (PSA). We chose PSA because it is often used in proof-of-concept validation for detection methods (5). We measured the bound intensity for a concentration series of human PSA spiked into 4 μL of FBS (Fig. 3A). The NLISA is designed to capture almost all PSA molecules using a nanoswitch concentration (0.7 nM) higher than the dissociation constant of the more strongly binding antibody (10 pM) and a local concentration between the two binding sites (∼30 nM) higher than the dissociation constant of the more weakly binding antibody (100 pM) (details in SI Text). Notably, nanoswitches can capture a higher proportion of analyte than a comparable concentration of single antibodies, as an analyte has to unbind from both antibodies to unbind from the nanoswitch and the local concentration between a single bound analyte and the sandwiching antibody on the same nanoswitch is high (details in SI Text). To protect the DNA nanoswitches and PSA from degradation during incubation, we added EDTA to a concentration of 100 mM. To enable proper separation of DNA nanoswitches during electrophoresis in the presence of serum and to increase the signal-to-noise ratio, we added both SYBR Gold and Coomassie Blue G-250 in the loading buffer (Fig. S3). This enables detection in 20% serum from concentrations ranging over four orders of magnitude, from ∼60 fM to ∼60 pM (Fig. 3B), with an LOD of 44 fM. We can reach an LOD of 5.6 fM when we use 100 μL of serum sample spread across multiple lanes and average pairs of the signal traces together before applying our intensity-finding algorithm, equivalent to an LOD of 28 fM in undiluted serum (Fig. 3B). The most comparable commercially available rapid, ultrasensitive ELISA-based PSA test, a SimpleStep kit (Abcam), can obtain an LOD of 220 fM from a 100-μL sample. Our assay only requires 4 μL of serum to reach a comparable LOD, or 100 μL of serum to reach an LOD lower by a factor of 8. We also quantified PSA spiked into 20% bovine urine and obtained an LOD of 50 fM (Fig. 3C). PSA spiked into a higher, 60% dilution of serum drastically increased the background in the gel and lowered the LOD, while PSA spiked into 60% bovine urine yielded a slightly higher, but comparable LOD (Fig. S4).
Fig. 3.
DNA nanoswitch detection of human prostate-specific antigen (PSA) in complex fluids. (A) Representative gel image of human PSA spiked into 20% FBS, with concentrations ranging from 6 × 10⁻¹⁵ to 6 × 10⁻¹⁰ M and a control lane lacking any PSA. (B and C) Log-log plots of average bound intensity per lane as a function of concentration for PSA in (B) 20% serum or (C) 20% urine. Results are for 4 μL of serum or urine (i.e., 20 μL of diluted sample) run in one gel lane (blue), 8 μL of serum run across two gel lanes, or 100 μL of serum run across multiple gel lanes. (B, Inset) Limit of detection (LOD) as a function of sample volume. LOD was determined by extrapolating the concentration from the signal equal to background signal plus 3 SD of the background signal. Error bars are the SD, with the background given by the dashed line, with four replicates per data point, except for None, which has 20 replicates.
Fig. S3.
Use of dyes to enable entry of nanoswitches into the agarose gel for separation. Gel electrophoresis results of 5 or 0 pM of PSA in (A) 20% FBS or (B) 20% bovine urine in the absence of any dyes, only SYBR Gold, only Coomassie Brilliant Blue G-250, or both SYBR Gold and Coomassie Brilliant Blue G-250. The location of the looped bands are specified by the orange arrows.
Fig. S4.
Equivalent limit of detection (LOD) as a function of the percentage of biological material in the sample. The equivalent LOD is the LOD in 12 μL of undiluted sample. For a sample diluted to 20%, this means that the signal is averaged over three different lanes, while for 60% this is only one lane. The LOD was determined by extrapolating the concentration from the signal equal to background signal plus 3 SD of the background signal.
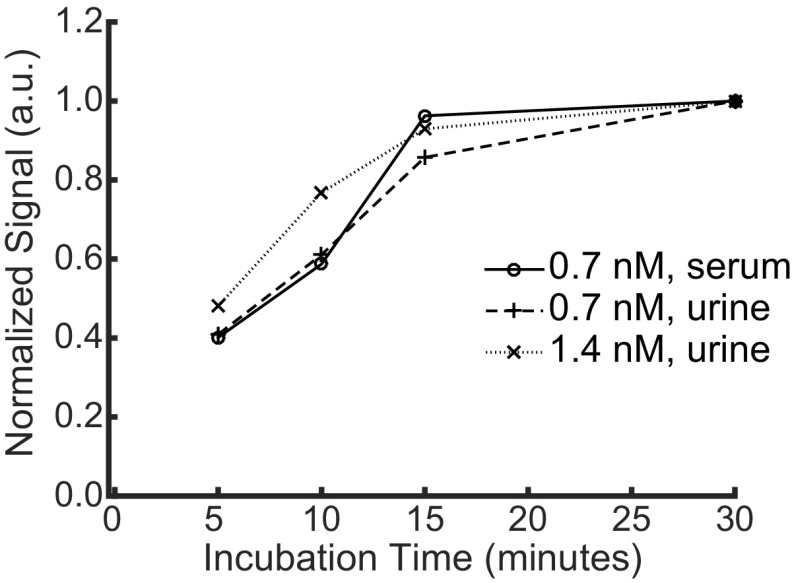
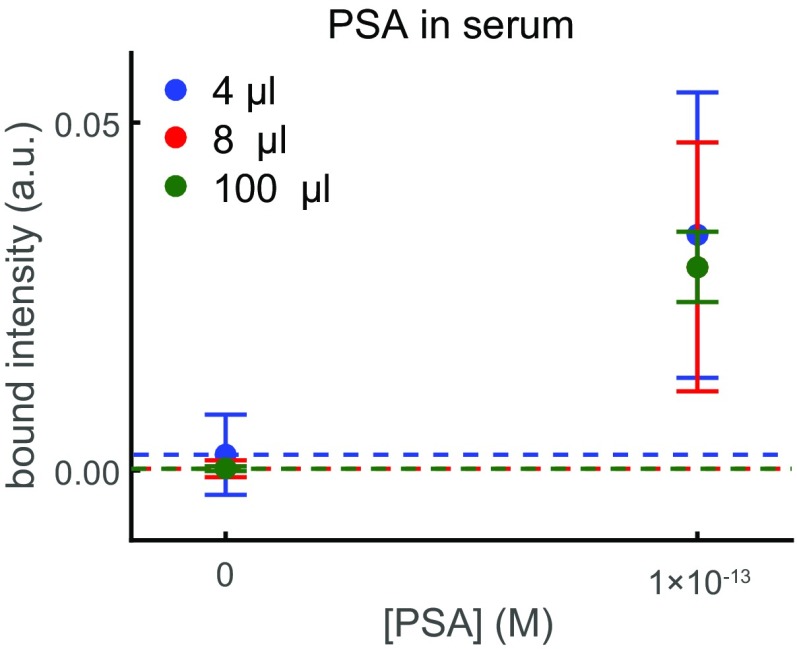
For these experiments, detection was performed using a 30-min incubation, but nanoswitch binding approaches equilibrium after ≈15 min (Fig. S5). The short incubation time is due to the high nanoswitch concentration in solution and the presence of two antibodies on each nanoswitch that can bind the analyte first. The procedure takes less than 45 min from start to finish, which is less than one-half of the time it takes to perform a SimpleStep ELISA test. Additionally, the concentration of nanoswitches can be increased to decrease the required incubation time (Fig. S5). While rapid incubation times may be important for point-of-care applications, if increased sensitivity is required, we can perform NLISA with a lower nanoswitch concentration and a longer incubation time. For example, using 200 pM nanoswitch with a 2-h incubation time results in a LOD of 3.8 fM from a 100-μL serum sample diluted to 20%, equivalent to an LOD of 19 fM from an undiluted sample and lower than the ELISA test by a factor of 12 (Fig. S6).
Fig. S5.
Normalized signal resulting from different incubation times for 5 pM human PSA in 20% serum or 20% urine for the nanoswitches diluted to an incubation concentration of 0.7 or 1.4 nM.
Fig. S6.
Detection of PSA in 20% serum using a lower nanoswitch concentration of 400 pM. Average bound intensity per lane as a function of concentration for PSA in 20% serum. Results are for 4 μL of serum (i.e., 20 μL of diluated sample) run in one gel lane (blue), 8 μL of serum run across two gel lanes (red), or 100 μL of serum run across multiple gel lanes. Error bars are the SD, with the background given by the dashed line for four replicates at 100 fM and 20 replicates at 0 fM.
Low Cross-Reactivity of NLISA.
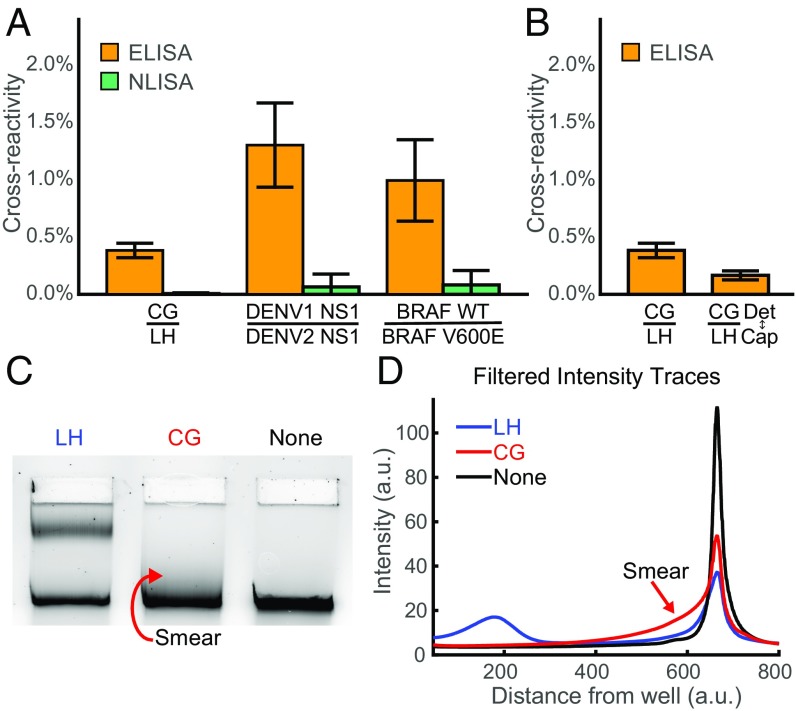
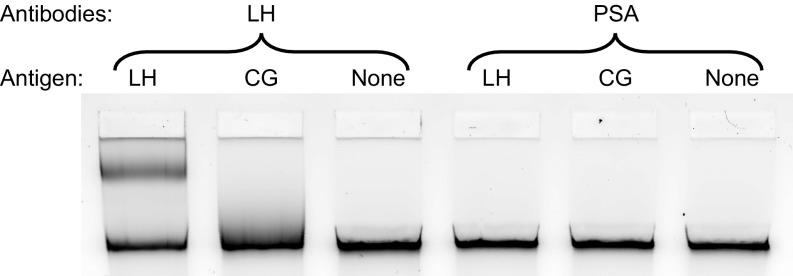
In addition to its superior sensitivity, NLISA also exhibits lower cross-reactivity than ELISA even when using the same antibodies. Here, cross-reactivity refers to extraneous signal caused by binding of an off-target protein that is similar to the intended target. We measured cross-reactivity to chorionic gonadotropin (CG) for an antibody pair against luteinizing hormone (LH) for both ELISA and NLISA, with cross-reactivity given by the ratio of the signal, after background subtraction, from 1 nM of nontarget protein to 1 nM of target protein (Fig. 4A). For the ELISA comparison, we included 30 min of washes and incubation steps after the addition of the detection antibody, with an extra incubation step in gel running buffer. ELISA exhibits a higher cross-reactivity to CG compared with NLISA in an assay against LH (Fig. 4A). This is in comparison with our negative control, which shows the absence of cross-reactivity to follicle-stimulating hormone (FSH) in the same ELISA (mean, 0.004%; SEM, 0.006%), since the antibody pair chosen does not significantly bind to FSH. Additionally, cross-reactivity in ELISA still persists even when the capture and detection antibodies are switched (Fig. 4B). During NLISA, loops that are formed from antibodies weakly binding to off-target CG proteins dissociate during electrophoresis, as shown by a small smear that extends from the trailing edge of the linear band that does not exist in the absence of CG (Fig. 4 C and D). We further demonstrate that, in the absence of significant off-target binding, we do not observe this smear, by testing nanoswitches constructed with anti-PSA antibodies in the presence of CG (Fig. S7). Compared with the washing step used in ELISA, we also observe that unbinding occurs more quickly during the NLISA electrophoresis step, with the estimated rate of signal decay for the LH–CG off-target interaction increased by a factor of 6.5 (SEM, 0.5). As two additional examples, we also demonstrated reduced cross-reactivity in NLISA against dengue virus serotype 1 nonstructural protein 1 (NS1) when assaying for dengue virus serotype 2 NS1, and reduced cross-reactivity against wild-type B-Raf when assaying for mutant B-Raf V600E (Fig. 4A).
Fig. 4.
Low cross-reactivity for NLISA. (A) Cross-reactivity of NLISA compared with ELISA given by the ratio of the signal from 1 nM nontarget protein to 1 nM target protein. Results are shown for cross-reactivity to chorionic gonadotropin (CG) in an assay for luteinizing hormone (LH) (P = 1.6 × 10⁻⁴), to dengue virus serotype 1 nonstructural protein 1 (NS1) in an assay for dengue virus serotype 2 NS1 (P = 1.6 × 10⁻⁴), and to wild-type B-Raf in an assay for mutant B-Raf V600E (P = 0.017). Error bars are the SEM for eight replicates, and the P values are given by a Wilcoxon rank-sum test. (B) Cross-reactivity of ELISA for CG to LH for both cases of each antibody used in either capture or detection. Error bars are the SEM for eight replicates. (C) Representative gel image of NLISA using antibodies against LH to assay 1 nM of LH, 1 nM of CG, and a control lane lacking any target in 20% FBS. Looping is observed when the antibody pair on the nanoswitch strongly bind the target protein LH, while a smear is observed when the antibody pair only weakly binds the off-target protein CG target. (D) Representative filtered intensity traces in the presence of LH or CG, and also a control lane with neither.
Fig. S7.
Representative gel image of NLISA using antibodies against LH or PSA to assay 1 nM LH, 1 nM CG, and a control lane lacking any target in 20% FBS. Looping or smearing is not observed when using antibodies against PSA since the nanoswitch does not bind either ligand.
NLISA Using a Mobile-Imaging Platform.
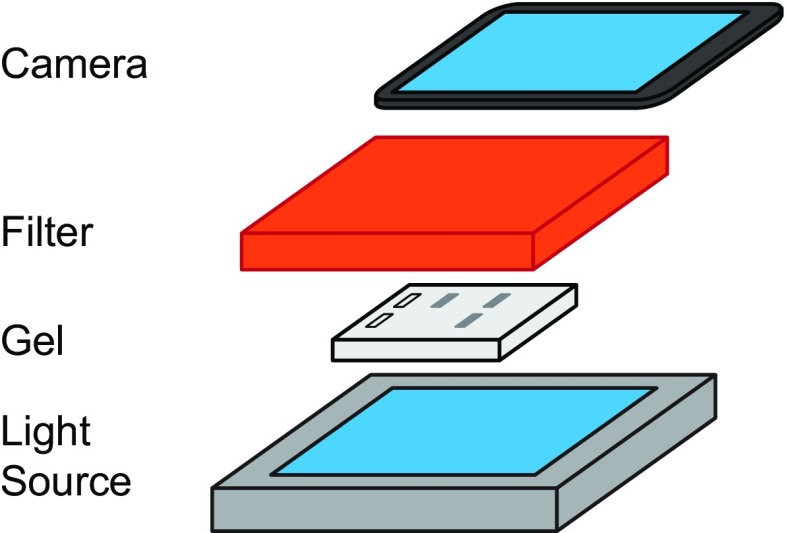
To demonstrate the versatility of DNA nanoswitch detection and its potential for use as a low-cost, point-of-care detection platform, we also analyzed gels using a cheap, mobile imaging platform with an iPad/iPhone camera instead of a gel scanner (Fig. S8). In addition to the camera, the only parts used were a Safe Imager 2.0 Blue Light Transilluminator as a light source, a Safe Imager filter to only allow fluorescently transmitted light to reach the camera, and a Styrofoam box to block ambient light. Using this imaging platform, we quantified PSA spiked into 20 μL of 20% serum and obtained an LOD that is only 80% higher than the LOD using a laser scanner (Fig. S9).
Fig. S8.
Schematic representation of the mobile imaging platform, with Safe Imager 2.0 Blue Light Transilluminator light source, agarose gel, Safe Imager filter, and iPad camera. A Styrofoam box was used to block ambient light.
Fig. S9.
Quantification of PSA in 20% FBS at concentrations from 6 × 10⁻¹⁴ to 6 × 10⁻¹⁰ M for gel images taken with the mobile imaging platform. Here, the LOD is 79 pM. Error bars are the SD, with the background given by the dashed line.
SI Text
Consider the capture efficiency of ligand molecules by the nanoswitches.
Here, we describe how almost all ligand molecules will be bound to the nanoswitch at low ligand concentrations when the dissociation constant of the more strongly binding antibody KD1 is lower than the concentration of nanoswitch [N] and the dissociation constant of the more weakly binding antibody KD2 is much lower than the local concentration between the two binding sites on the nanoswitch [C]. When the ligand is at a much lower concentration than the nanoswitch, we can assume that the change in free nanoswitch concentration and the proportion of nanoswitches that bind to two ligands are both insignificant. With [L] as the ligand concentration and [N] as the nanoswitch concentration, the proportion of looped nanoswitch [Nloop] is given by the following:
Here, KD1 is the dissociation constant of the more strongly binding sandwiching antibody. If we add the assumptions that the concentration of the nanoswitch [N] is much greater than the dissociation constant of the more strongly binding antibody and the local concentration [C] is much greater than the dissociation constant of the more weakly binding antibody, then this expression reduces to . For our system, we have the parameters KD1 = 10 pM and KD2 = 100 pM. Additionally, the local concentration is ≈30 nM (11) and the nanoswitch concentration [N] is 0.7 nM, resulting in almost all ligand captured by looped nanoswitch with .
Here, we demonstrate how a nanoswitch can capture more ligand than just using a capture antibody. When capturing ligand with an antibody instead of a nanoswitch, the proportion of antibody–ligand complex is given by the following:
Therefore, if we assume that for the nanoswitch both antibodies have similar affinities, the ratio between capture from a nanoswitch to capture from single antibodies is given by the following:
This quantity is greater than 1 when , which generally holds true since the local concentration [C] is ≈30 nM (11). As an example, if we used antibodies that had KD = 1 nM, then nanoswitches would capture 2.2 times than just using capture antibodies.
Discussion
NLISA is a high-sensitivity, low-cost, and simple method to quantify protein analytes that works in complex matrices, such as serum or urine. Analyte binding occurs completely in solution, with detection antibodies attached to soluble nanoswitches instead of a solid phase. This eliminates false-positives resulting from nonspecific binding to a surface and eliminates the need for wash steps and blocking reagents during detection. Additionally, gel electrophoresis acts as a purification step in which looped nanoswitches with bound analyte are separated out from unlooped nanoswitches and other sample components, such as free proteins. This purification step also provides a kinetic-proofreading mechanism (15) for increased specificity. Furthermore, during NLISA, a large number of dye molecules can bind to each nanoswitch molecule, resulting in an enzyme-free linear amplification of signal. This large linear amplification, combined with the reduction of false-positive signals that can arise from nonspecific and off-target interactions, enable highly sensitive and quantitative results.
NLISA is able to provide higher-specificity target recognition than equilibrium binding assays due to the use of kinetic proofreading (15), as during the electrophoresis step antibody–antigen interactions are tested by their lifetimes. The force of the electric field, balanced by the resistance arising from the gel, drives the system out of equilibrium, irreversibly separating nanoswitches that open during electrophoresis from nanoswitches that remain looped. This results in an enrichment of on-target vs. off-target interactions that, on sufficiently long timescales, increases exponentially in time. The forces during electrophoresis could also serve to accelerate the unbinding and decelerate the rebinding of antibody–target pairs. In combination with the reduction of surface effects, this could help account for the faster decay of off-target signal that we observed during NLISA purification vs. ELISA washing, even when using the same antibodies.
We note that the kinetic-proofreading step used in NLISA requires the use of antibody pairs that can bind their antigens with sufficiently long lifetimes under gel running conditions. While this could potentially prevent the use of antibodies that only bind weakly to their target molecule, we did not find this to be a major limitation and were able to detect a wide variety of proteins with commercially available antibodies. Additionally, while some detection methods only require a single binding antibody, such as direct ELISA and plasmon resonance (17), rather than two antibodies that can bind simultaneously, NLISA is similar in this regard to widespread assays such as sandwiching ELISA and lateral flow. Since the use of two antibodies for detection is already standard, this does not significantly restrict the number of relevant protein targets for NLISA. In addition, as a benefit, the use of two antibodies, rather than one, reduces background signal arising from off-target binding.
NLISA is rapid and does not require any washing steps, making our method suitable for use in high-throughput diagnostics, or point-of-care devices for medical applications. Detection requires low sample volumes, allowing detection in pinprick volumes of fluid or multiple assays from a single sample. Additionally, no enzymes are required, with the nanoswitch reagents composed solely of DNA and antibodies that can be lyophilized to enable a long shelf life under ambient conditions. Although we note that, for point-of-care systems, additional engineering would be required to integrate NLISA into a small device that could run, read out, and analyze a gel.
While some point-of-care devices are currently in use, these systems are typically limited in sensitivity. For example, the i-Stat or Philips Minicare I-20 can achieve a subpicomolar LOD (18, 19). While these devices can be used for some applications, such as detection of elevated troponin in the case of a heart attack, low sensitivity limits the use of such devices for the screening of individuals for infectious disease through the detection of viral proteins. Recently, the rapid spread of infectious agents such as Zika virus and Ebola have led to public health incidents throughout the world. High-sensitivity detection is critical for early diagnosis of infectious diseases, with presymptomatic identification helpful for monitoring, forecasting, and ideally limiting epidemics in the early stages of an outbreak (20). Preferably, testing would be done rapidly, inexpensively, and at the point of care. Our NLISA platform, with high sensitivity and low cost, could form the basis for such a system designed for on-the-spot testing at clinics or even airports.
While viral infections could also be detected via disease-specific nucleic acids, rather than proteins, through RT-PCR, current implementations of this technique are not ideally suited for point-of-care detection. RT-PCR needs specialized instrumentation for temperature control, relies on a high-cost enzyme, and has a slow turnaround time. In addition, while amplification of nucleic acids can dramatically increase detection sensitivity compared with protein detection, this can be somewhat offset by the many copies of viral-capsid proteins (typically thousands) present in each sample for every nucleic acid (21). We note that there have been recent improvements in point-of-care nucleic acid detection, such as cell-free, paper-based sensors for the detection of the Zika virus RNA genome, with high reagent stability, good sensitivity, and easy readout. However, even this approach generally requires an enzyme-based amplification step, resulting in a 3-h diagnostic test (22).
The extremely low cross-reactivity in NLISA also makes it an ideal system to screen for infectious diseases. As we have demonstrated, low cross-reactivity can be used to accurately distinguish between different viral strains, which can have implications for treatment options. Additionally, low cross-reactivity is important in identifying between a novel virus and other closely related viruses before optimal antibodies are developed, as was initially the case in distinguishing Zika virus from other Flaviviridae such as dengue fever, leading to public health challenges during the early stages of the recent Zika outbreak (23).
NLISA is a powerful and practical method for protein detection in the laboratory and potentially in the field. It is more sensitive, more specific, and easier-to-perform than ELISA and does not require any specialized equipment. Additionally, NLISA is rapid and low cost, and does not require an enzymatic amplification step, as the signal from each binding event is linearly amplified by hundreds of dye molecules binding to each nanoswitch. With all of these advantages, NLISA has the potential to serve as a standard for protein detection, replacing traditional ELISA techniques in both basic research and clinical practice.
Methods
Antibody Coupling.
Sandwiching antibodies against PSA (Biospacific 8301 and 8311) were buffer exchanged to 10 mM sodium bicarbonate using two Zeba columns (Thermo Fisher Scientific) and were coupled to azide-modified oligonucleotides (Integrated DNA technologies). Specifically, we mixed together 70 μL of antibody at a final concentration of ∼3.6 μM, an equimolar amount of linker DBCO-PEG4-NHS ester linkers (Sigma), and 5× excess of oligonucleotide in a 10 mM sodium bicarbonate buffer and incubated at room temperature for 2 h. Antibody pairs were coupled to the oligonucleotides CTCAAATATCAAACCCTCAATCAATATCT\3AzideN\ and \5AzideN\TTTTGAAGCCTTAAATCAAGATTAGTTGCT. Antibodies and antibody–oligo conjugates were then purified from excess oligonucleotides and linkers using the Thunder-Link Conjugate Clean Up Reagent (Innova Biosciences) and resuspended in 50 mM Tris, pH 7.5, 50 mM NaCl, and 10 mM MgCl2. Antibody coupling and purification were confirmed using 4–20% TBE polyacrylamide gels (Bio-Rad) stained with Krypton Fluorescent Protein Stain (Thermo Fisher Scientific).
Nanoswitch Formation.
DNA nanoswitches were created as previously described (13). Briefly, circular ssDNA from the 7,249-nt bacteriophage M13 (New England BioLabs) was linearized by enzymatic cleavage of a single site using BtscI (New England BioLabs) and a site-specific oligonucleotide. This ssDNA scaffold was mixed with a molar excess of tiling 60-mer oligonucleotides (10:1), excluding the complementary regions for antibody hybridization, and subjected to a temperature ramp from 90 to 20 °C at 1 °C⋅min−1. The antibody–oligonucleotide conjugates were added at 37 or 40 °C during the hybridization protocol. For the rapid, 20-min protocol, the mixture was subjected to 90 °C for 30 s, a temperature ramp from 80 to 61 °C at 1.7 °C⋅min−1, and then 37 °C for 5 min with the antibody–oligonucleotide conjugates. After hybridization, nanoswitches were purified from excess antibodies and oligonucleotides by using the BluePippin with a 0.75% Dye-Free agarose gel cassette, the S1 marker, and the 6–10 k high-pass v3 protocol with a 4,500-bp cutoff. Alternatively, PEG precipitation can be used for purification (13). After purification, nanoswitches were diluted in 1× TBST in a protein lobind tube (Eppendorf). The purified nanoswitch solution is stored at 4 °C.
Incubation and Gel Electrophoresis of Nanoswitch and Sample Mixture.
The sample was mixed with nanoswitches to a final concentration of 0.7 nM and volume of 10 μL. When assaying serum or urine, EDTA was added to a final concentration of 100 mM. We mixed the samples in an Eppendorf Protein lobind tube, but the samples can also be mixed in Eppendorf lobind plates for a lower cost per sample. Then the mixture was incubated for 30 min at room temperature, unless otherwise specified. The mixture was then diluted by adding 1× volume of 0.5× TBE, a Ficoll-based loading solution (Promega) was added, and if specified, 0.5 μL of 200× SYBR Gold and 0.5 μL of 1% Coomassie Brilliant Blue G-250 were added. The samples were then run on a 1.0% agarose gel for serum or a 0.8% agarose gel for urine. The gels were prestained with 0.6× SYBR gold and run on an Owl B1A Mini Gel Electrophoresis System (Thermo Fisher Scientific) at 300 V for 11 min at room temperature in 0.5× TBE. We used a 10-well comb with a thickness of 1.5 mm.
Gel Imaging.
Gels were imaged using a laser gel-scanner (GE Typhoon). We also tested a mobile imaging platform using a Safe Imager 2.0 Blue Light Transilluminator light source, Safe Imager filter, and iPad Mini 4 camera. Since the maximum shutter time for the iPad camera is 0.5 s, we took a series of 20, 0.5-s images and averaged the result to reduce noise. To prevent stray light from reaching the camera, we used a Styrofoam box with a hole in the top for the camera to cover the setup.
Quantification of Bound Intensity.
Gel images were analyzed using a custom Matlab program, which is available upon request. The program uses a control lane without any PSA and a reference lane with a known concentration of PSA spiked in. The reference lane is used to determine the width and the distance of the looped band from the well for accurate fitting at low concentrations. All lanes are filtered to create a profile trace that is the mean of the middle 50% of intensities, to remove the effect of any autofluorescent defects in the gel. For the reference lane, the edge of the well is determined, and then the trace is fitted to a skew normal distribution with a background given by a decaying exponential intensity from the well, a decaying Gaussian tail from the linear band, and a constant offset. The reference signal is given by the area under the skew normal distribution. For the sample lanes, the filtered intensity profiles are fitted as described for the reference lane, but for the skew normal distribution of the looped band, the peak position, skew parameter, and SD are fixed to match the reference lane. The signal corresponding to the bound intensity is given as the area under the skew normal distribution normalized by the known reference lane concentration. When fitting the looped band to determine the intrinsic sensitivity of NLISA, we only used a linear function for the background.
To analyze data from a sample spread over multiple lanes, we first filtered the data from each lane to create intensity profile traces. Next, intensity profile traces from adjacent lanes were averaged together and then fit, as described above, to determine the bound intensity value for each pair of lanes. Finally, we averaged the bound intensity values of all of the lane pairs in the sample to get the total bound intensity. This procedure reduces the noise compared with analyzing each lane independently. To estimate the SD of the total bound intensity for a sample spread across multiple lanes, we determined the SD of the lane pair signal, and then divided this by the square root of the number of lane pairs in the total sample. For example, to determine the SD of the background for a 100-μL sample of looped nanoswitches spread across five lanes, we calculated the SD of the bound intensity over eight pairs of background lanes, then divided this by , since there are 5/2 pairs of lanes in a 100-μL sample.
Measurement of Cross-Reactivity.
We defined cross-reactivity as the percentage of signal an off-target protein yields compared with the targeted protein at the same concentration. We compared cross-reactivity in NLISA and ELISA using the same antibody pairs. As examples we measured cross-reactivity to CG in an assay for LH (Biospacific 5301 and 5303), to dengue virus serotype 1 nonstructural protein 1 (NS1) in an assay for dengue virus serotype 2 NS1 (Biospacific A46582 and A46592), and to wild-type B-Raf in an assay for mutant B-Raf V600E (Genetex RM8 and Sigma M2), with the detection antibody RM8 being mutation specific. Antibody coupling and the NLISA were performed as described above. For ELISA, we incubated 96-well EIA (enzyme immunoassay) plates (Bio-Rad) with 0.01 mg/mL of the capture antibody in coating buffer (Bio-Rad) overnight at 4 °C. We then washed three times with wash buffer (Bio-Rad) and incubated the plate in BSA Block (Bio-Rad) for 1 h at 37 °C. We then washed four times and incubated with the sample for 90 min at 37 °C. We then washed three times and incubated with 0.003 mg/mL of the detection antibody that was modified with EZ-Link NHS-Biotin (Thermo Fisher) for 15 min at 37 °C. We then washed three times and incubated with 0.0002 mg/mL HRP-conjugated SA (Bio-Rad) for 15 min at 37 °C. We then washed twice with wash buffer and incubated with 0.5× TBE for 11 min at room temperature. We then washed twice with 20 mM Tris, pH 7.5, and 100 mM NaCl and measured using the QuantaRed Enhanced Chemifluorescent HRP Substrate Kit (Thermo Fisher). For both ELISA and NLISA, we measured the signal above the background in the absence of either target or off-target proteins in serum.
Measurement of Signal Decay Enhancement.
We compared the rate of signal decay of an LH-binding antibody pair to off-target CG protein for an ELISA wash step and the NLISA gel electrophoresis step. Both steps were done in a 0.5× TBE buffer for 11 min. The signal decay from the ELISA wash step was determined by comparing the signal when the wash step was included to when the wash step was omitted. The signal decay during gel electrophoresis was determined by fitting the smear from the trailing edge of the linear band to an exponential decay function, and then dividing the decay length by the difference in velocity between the linear and looped bands to estimate the mean dissociation time.
Acknowledgments
We acknowledge members of the W.P.W. Laboratory, K. Halvorsen, and W. M. Shih for critical discussions. Funding for this project was provided by the Boston Children’s Hospital Technology Development Fund, the Harvard Blavatnik Biomedical Accelerator, the Wyss Institute, the Arnold and Mabel Beckman Foundation Young Investigator Award, and the National Institutes of Health–National Institute of General Medical Sciences Grant R35 GM119537 and National Cancer Institute Grant R21 CA212827.
Footnotes
Conflict of interest statement: Patent applications have been filed for various aspects of this work by all authors. M.A.K. and W.P.W. are founders of and have equity interest in Confer Health, Inc., a company that is developing point-of-care diagnostics.
This article is a PNAS Direct Submission.
This article contains supporting information online at www.pnas.org/lookup/suppl/doi:10.1073/pnas.1708148114/-/DCSupplemental.
References
- 1.Huzly D, Hanselmann I, Schmidt-Chanasit J, Panning M. High specificity of a novel Zika virus ELISA in European patients after exposure to different flaviviruses. Euro Surveill. 2016;21:30203. doi: 10.2807/1560-7917.ES.2016.21.16.30203. [DOI] [PubMed] [Google Scholar]
- 2.Hamm CW, et al. Emergency room triage of patients with acute chest pain by means of rapid testing for cardiac troponin T or troponin I. N Engl J Med. 1997;337:1648–1653. doi: 10.1056/NEJM199712043372302. [DOI] [PubMed] [Google Scholar]
- 3.Cucu T, et al. ELISA detection of hazelnut proteins: Effect of protein glycation in the presence or absence of wheat proteins. Food Addit Contam Part A Chem Anal Control Expo Risk Assess. 2011;28:1–10. doi: 10.1080/19440049.2010.535026. [DOI] [PubMed] [Google Scholar]
- 4.Lequin RM. Enzyme immunoassay (EIA)/enzyme-linked immunosorbent assay (ELISA) Clin Chem. 2005;51:2415–2418. doi: 10.1373/clinchem.2005.051532. [DOI] [PubMed] [Google Scholar]
- 5.Rissin DM, et al. Single-molecule enzyme-linked immunosorbent assay detects serum proteins at subfemtomolar concentrations. Nat Biotechnol. 2010;28:595–599. doi: 10.1038/nbt.1641. [DOI] [PMC free article] [PubMed] [Google Scholar]
- 6.Wang X, Ha T. Defining single molecular forces required to activate integrin and notch signaling. Science. 2013;340:991–994. doi: 10.1126/science.1231041. [DOI] [PMC free article] [PubMed] [Google Scholar]
- 7.Pardee K, et al. Paper-based synthetic gene networks. Cell. 2014;159:940–954. doi: 10.1016/j.cell.2014.10.004. [DOI] [PMC free article] [PubMed] [Google Scholar]
- 8.Le JV, et al. Probing nucleosome stability with a DNA origami nanocaliper. ACS Nano. 2016;10:7073–7084. doi: 10.1021/acsnano.6b03218. [DOI] [PMC free article] [PubMed] [Google Scholar]
- 9.Ke Y, Meyer T, Shih WM, Bellot G. Regulation at a distance of biomolecular interactions using a DNA origami nanoactuator. Nat Commun. 2016;7:10935. doi: 10.1038/ncomms10935. [DOI] [PMC free article] [PubMed] [Google Scholar]
- 10.Kuzuya A, Sakai Y, Yamazaki T, Xu Y, Komiyama M. Nanomechanical DNA origami “single-molecule beacons” directly imaged by atomic force microscopy. Nat Commun. 2011;2:449. doi: 10.1038/ncomms1452. [DOI] [PMC free article] [PubMed] [Google Scholar]
- 11.Koirala D, et al. Single-molecule mechanochemical sensing using DNA origami nanostructures. Angew Chem Int Ed Engl. 2014;53:8137–8141. doi: 10.1002/anie.201404043. [DOI] [PubMed] [Google Scholar]
- 12.Halvorsen K, Schaak D, Wong WP. Nanoengineering a single-molecule mechanical switch using DNA self-assembly. Nanotechnology. 2011;22:494005. doi: 10.1088/0957-4484/22/49/494005. [DOI] [PubMed] [Google Scholar]
- 13.Koussa MA, Halvorsen K, Ward A, Wong WP. DNA nanoswitches: A quantitative platform for gel-based biomolecular interaction analysis. Nat Methods. 2015;12:123–126. doi: 10.1038/nmeth.3209. [DOI] [PMC free article] [PubMed] [Google Scholar]
- 14.Chandrasekaran AR, Zavala J, Halvorsen K. Programmable DNA nanoswitches for detection of nucleic acid sequences. ACS Sens. 2016;1:120–123. [Google Scholar]
- 15.Hopfield JJ. Kinetic proofreading: A new mechanism for reducing errors in biosynthetic processes requiring high specificity. Proc Natl Acad Sci USA. 1974;71:4135–4139. doi: 10.1073/pnas.71.10.4135. [DOI] [PMC free article] [PubMed] [Google Scholar]
- 16.Sobczak JP, Martin TG, Gerling T, Dietz H. Rapid folding of DNA into nanoscale shapes at constant temperature. Science. 2012;338:1458–1461. doi: 10.1126/science.1229919. [DOI] [PubMed] [Google Scholar]
- 17.Inci F, et al. Multitarget, quantitative nanoplasmonic electrical field-enhanced resonating device (NE2RD) for diagnostics. Proc Natl Acad Sci USA. 2015;112:E4354–E4363. doi: 10.1073/pnas.1510824112. [DOI] [PMC free article] [PubMed] [Google Scholar]
- 18.Apple FS, et al. Analytical performance of the i-STAT cardiac troponin I assay. Clin Chim Acta. 2004;345:123–127. doi: 10.1016/j.cccn.2004.03.010. [DOI] [PubMed] [Google Scholar]
- 19.Kemper DW, et al. Analytical evaluation of a new point of care system for measuring cardiac Troponin I. Clin Biochem. 2017;50:174–180. doi: 10.1016/j.clinbiochem.2016.11.011. [DOI] [PubMed] [Google Scholar]
- 20.Thompson RN, Gilligan CA, Cunniffe NJ. Detecting presymptomatic infection is necessary to forecast major epidemics in the earliest stages of infectious disease outbreaks. PLoS Comput Biol. 2016;12:e1004836. doi: 10.1371/journal.pcbi.1004836. [DOI] [PMC free article] [PubMed] [Google Scholar]
- 21.Cabrera C, Chang L, Stone M, Busch M, Wilson DH. Rapid, fully automated digital immunoassay for p24 protein with the sensitivity of nucleic acid amplification for detecting acute HIV infection. Clin Chem. 2015;61:1372–1380. doi: 10.1373/clinchem.2015.243287. [DOI] [PubMed] [Google Scholar]
- 22.Pardee K, et al. Rapid, low-cost detection of Zika virus using programmable biomolecular components. Cell. 2016;165:1255–1266. doi: 10.1016/j.cell.2016.04.059. [DOI] [PubMed] [Google Scholar]
- 23.Gyurech D, et al. False positive dengue NS1 antigen test in a traveller with an acute Zika virus infection imported into Switzerland. Swiss Med Wkly. 2016;146:w14296. doi: 10.4414/smw.2016.14296. [DOI] [PubMed] [Google Scholar]


