Significance
Parkinson’s disease is the most common neurodegenerative movement disorder, but its faithful modeling in animals has been challenging. Animal models based on overexpression of the disease-causing protein, α-synuclein (α-syn), are useful for studies of disease pathogenesis but rely on unphysiologically high levels of α-syn. Here, we present a model that combines preformed human α-syn fibrils and adenoassociated virus (AAV)-mediated overexpression of human α-syn, given in doses that, by themselves, do not cause any acute neurodegeneration. This combined approach reproduces several cardinal features of the human disease, including Lewy-like synucleinopathy, neuroinflammation, and progressive dopaminergic cell loss. The short time span and distinct sequence of pathological and degenerative changes make it attractive as an experimental model for studies aimed at neuroprotection and disease modification.
Keywords: synuclein protofibrils, adenoassociated virus, AAV, phospho-synuclein, microglia
Abstract
Although a causative role of α-synuclein (α-syn) is well established in Parkinson’s disease pathogenesis, available animal models of synucleinopathy do not replicate the full range of cellular and behavioral changes characteristic of the human disease. This study was designed to generate a more faithful model of Parkinson’s disease by injecting human α-syn fibril seeds into the rat substantia nigra (SN), in combination with adenoassociated virus (AAV)-mediated overexpression of human α-syn, at levels that, by themselves, are unable to induce acute dopamine (DA) neurodegeneration. We show that the ability of human α-syn fibrils to trigger Lewy-like α-synuclein pathology in the affected DA neurons is dramatically enhanced in the presence of elevated levels of human α-syn. This synucleinopathy was fully developed already 10 days after fibril injection, accompanied by progressive degeneration of dopaminergic neurons in SN, neuritic swelling, reduced striatal DA release, and impaired motor behavior. Moreover, a prominent inflammatory response involving both activation of resident microglia and infiltration of CD4+ and CD8+ T lymphocytes was observed. Hypertrophic microglia were found to enclose or engulf cells and processes containing Lewy-like α-syn aggregates. α-Syn aggregates were also observed inside these cells, suggesting transfer of phosphorylated α-syn from the affected nigral neurons. The nigral pathology triggered by fibrils in combination with AAV-mediated overexpression of α-syn reproduced many of the cardinal features of the human disease. The short time span and the distinct sequence of pathological and degenerative changes make this combined approach attractive as an experimental model for the assessment of neuroprotective and disease-modifying strategies.
Aggregation and misfolding of α-synuclein (α-syn) play a central role in the pathogenesis of Parkinson’s disease. Fibrillar inclusions of α-syn in so-called Lewy bodies and Lewy neurites are defining features of Parkinson’s disease, as well as other forms of synucleinopathy (1). In familial Parkinson’s disease, α-syn gene mutations (2–4) or increased levels of the α-syn protein due to gene duplication or triplication (5, 6) have been shown to play a direct causative role. In rodents, Parkinson’s disease-like synucleinopathy can be induced by overexpression of wild-type or mutated forms of α-syn by use of genetically modified animals or through injection of viral vectors, or, alternatively, through intracerebral administration of preformed α-syn fibril(s) (PFF) (7, 8).
Adenoassociated viral (AAV) vectors are now commonly used as a tool to induce progressive neurodegenerative changes in midbrain dopamine (DA) neurons, accompanied by the development of α-syn+ inclusions and aggregates in the affected neurons and their processes. The AAV–α-syn model, however, has several limitations. The changes develop slowly, and substantial neurodegeneration and DA neuron cell loss are obtained only with very high expression levels of the protein, about four- to fivefold above normal (9) (i.e., at levels of α-syn that far exceed those seen in the human disease). Moreover, the inflammatory response, which is a characteristic feature of human Parkinson’s disease, is transient and usually of modest magnitude (10–12).
The PFF model is based on the discovery that α-syn protofibrils, injected into the brain, can act as seeds for the formation of α-syn aggregates that are toxic to the affected neurons (13, 14). A particularly interesting feature of this model is the generation of Lewy-like α-syn fibrillar inclusions with characteristics that closely resemble those seen in human Parkinson’s disease. This process is quite fast in cultured neurons [developing within 1–2 wk (15, 16)], but it develops very slowly when the PFF are injected into the brain. Thus, it may take up to 6 mo for significant neurodegenerative changes to appear in midbrain DA neurons following injection of PFF into the striatum or substantia nigra (SN) (13, 17, 18). The restricted diffusion of the injected PFF from the site of injection is a limitation of this approach, particularly when the PFF are injected into the striatum, which makes it difficult to induce pathology in a substantial fraction of the nigral DA neurons.
In this study, we have explored the possibility of combining the two approaches (AAV-mediated overexpression of human α-syn and addition of exogenous PFF) to speed up the pathogenetic process and mimic more closely the pathology seen in the human disease, including a more prominent and long-lasting inflammatory response. It is known that the aggregates generated by α-syn PFF seeds are formed by recruitment of endogenous α-syn. This process is dependent on the level of α-syn present in the cell and also dependent on species matching, such that aggregate formation is more efficient if the PFF and the endogenous α-syn to be recruited into the aggregates are from the same species (15, 18, 19).
In the series of experiments reported here, we have used human α-syn PFF to trigger aggregate formation from human α-syn, expressed from an AAV6 vector in midbrain DA neurons. Importantly, we have used the AAV–α-syn vector at a low titer to obtain a level of α-syn expression in the midbrain DA neurons that is closer to that seen in patients with Parkinson’s disease, combined with α-syn PFF at a dose that, by itself, is unable to induce acute DA neuron cell loss. The results show that a single intranigral injection of PFF, given 4 wk after the AAV–α-syn vector, is efficient in triggering the development of prominent synucleinopathy characterized by the formation of Lewy-like aggregates and fibrillar inclusions in cell bodies and processes of nigral DA neurons, seen already 10 d after PFF injection. These changes were accompanied by progressive neurodegeneration, a pronounced and long-lasting inflammatory response, and DA neuron cell death, thus replicating the cardinal features of the progressive pathological changes seen in human Parkinson’s disease.
Results
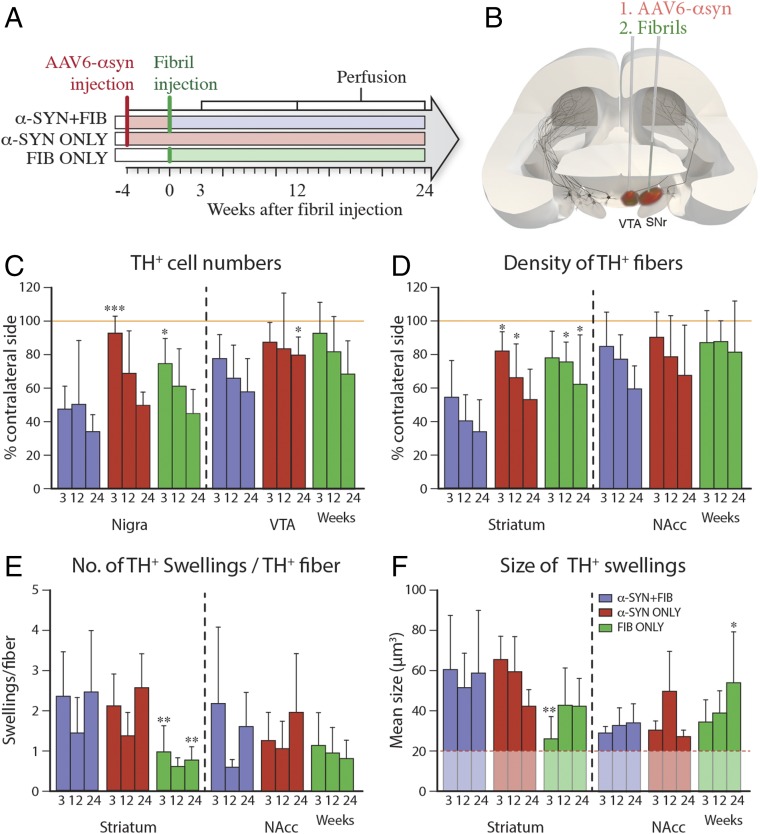
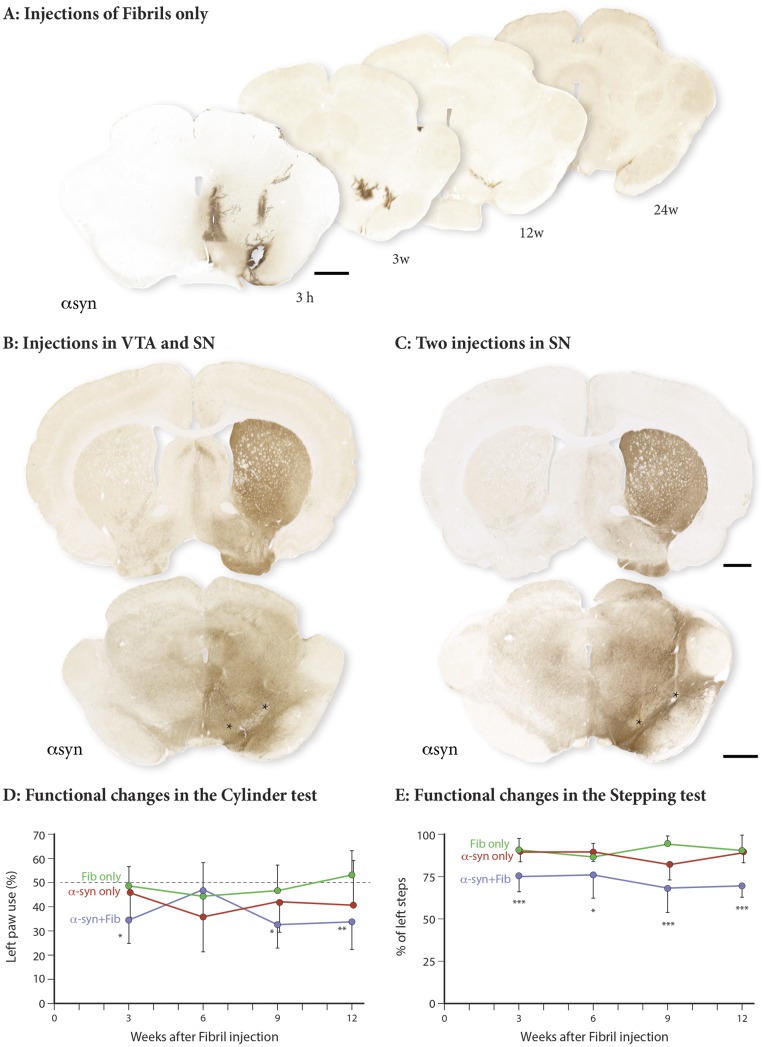
The AAV6–human-α-syn vector was injected into SN and ventral tegmental area (VTA) at a low dose, followed 4 wk later by PFF injection at the same two sites (Fig. 1 A and B). Immunostaining using the human α-syn antibody (α-syn 211) performed at 3, 12 and 24 wk after α-syn PFF injection showed that the α-syn derived from the AAV vector was widely expressed in neurons of VTA and SN, including their projections innervating the striatum and the ventral forebrain (Fig. S1B). In the α-syn PFF–injected animals, deposits of fibrils, stained with the α-syn 211 antibody, were detectable at the injection sites and along the needle track at 3 h postinjection. They remained visible still by 3 wk, but had disappeared almost completely at 12 and 24 wk (Fig. S1A).
Fig. 1.
Impact on DA neuron survival. (A and B) Animals received injections of AAV6–α-syn and/or sonicated PFF in SN and VTA. Quantification of TH+ cells in SN and VTA (C) and density of TH+ fibers in striatum and NAcc (D) are expressed as a percentage of the contralateral side. (E and F) Density and size of TH+ swellings. All data are presented as mean ± SD. *P < 0.05; **P < 0.01; ***P < 0.001, compared with the α-SYN + FIB group at the same time point. (C) Statistical analysis: SN time, F(2, 55) = 10.86, P = 0.0001; SN group, F(2, 55) = 10.32, P < 0.0002; VTA time, F(2, 58) = 4.29, P = 0.018; VTA group, F(2, 58) = 4.89, P = 0.011. (D) Time and group effect were significant in SN but not in VTA: SN time, F(2, 59) = 7.53, P = 0.0012; SN group, F(2, 59) = 14.62, P < 0.0001; VTA time, F(2, 59) = 4.46, P = 0.016; VTA group, F(2, 59) = 1.71, P = 0.189. (E) Time and group effect were significant in SN but not in VTA: SN time, F(2, 59) = 5.49, P = 0.0065; SN group, F(2, 59) = 16.18, P < 0.0001; VTA time, F(2, 59) = 2.97, P = 0.059; VTA group, F(2, 59) = 1.64, P = 0.20. (F) Significant group effect was observed in striatum, F(2, 58) = 7.25, P = 0.0016, and a significant interaction between group and time was observed in NAcc, F(4, 46) = 3.02, P = 0.0271.
Fig. S1.
α-Syn spread and impact on motor behavior. (A) Human α-syn staining shows PFF injected in SN and VTA 3 h or 3, 12, and 24 wk (w) after injection. Distribution of human α-syn derived from the AAV vector injected in SN and VTA (B) or SN (C) is shown, as indicated by the asterisks, 5–7 wk after vector injection. [Scale bars: A, B (striatum), B (SN), 1 mm.] (D and E) Changes in performance in the cylinder and stepping tests. Cylinder and stepping data both showed a significant group effect: F(2, 21) = 5.719, P = 0.0104, and F(2, 27) = 25.74, P < 0.0001, respectively.
Impact on DA Neuron Survival.
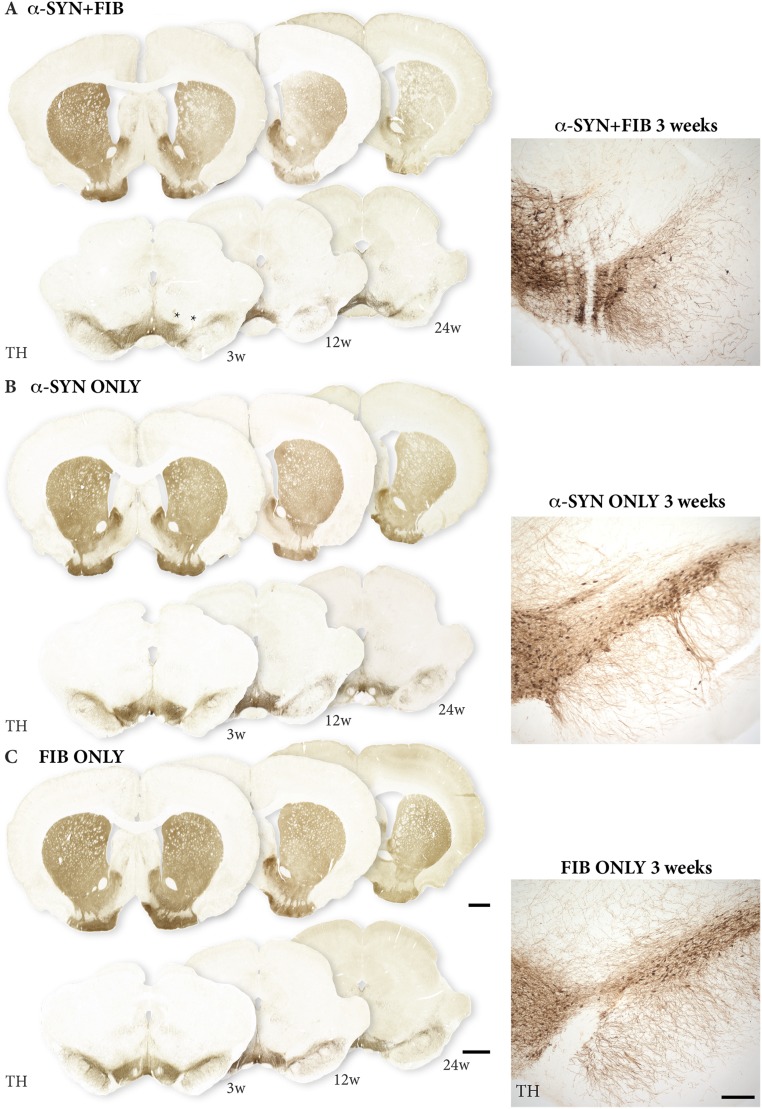
At the 3-wk time point (i.e., 7 wk after vector injection and 3 wk after PFF injection), we detected only minor tyrosine hydroxylase (TH)-positive cell loss in the SN, around 10%, in the α-SYN ONLY group (red bars in Fig. 1C and Fig. S2B). In the rats injected with PFF alone [fibril (FIB) ONLY; green bars in Fig. 1C and Fig. S2C], cell loss (around 25%) was restricted to the area between the two injection sites. By contrast, more extensive and significantly greater loss of TH+ neurons in SN pars compacta (SNc), averaging about 50%, was observed in the combined α-SYN + FIB group (violet bars in Fig. 1C and Fig. S2A).
Fig. S2.
Impact on DA neuron survival. TH immunostaining shows the extent of DA neuron cell loss in animals that received a combination of AAV vector and PFF (A), AAV vector alone (B), or PFF alone (C). Asterisks in A show the injection sites. (Scale bar: 1 mm.) w, week(s).
At the two longer time points, 12 and 24 wk (16 and 28 wk after vector injection; Fig. 1C and Fig. S2 A–C), there was a slowly developing, progressive loss of TH+ nigral neurons in the α-SYN ONLY and FIB ONLY groups, reaching about 50% at 24 wk. In the combination group, a further 10–15% of the nigral TH+ neurons were lost over time, amounting to 65–70% at 24 wk. At these time points, the extent of cell loss in the α-SYN ONLY and FIB ONLY groups was not significantly different from the combined group.
Measurement of TH+ fiber density in the striatum showed a similar pattern of changes as seen in the SN in the three groups (Fig. 1D). Thus, the extent of striatal denervation was overall more pronounced in the combined α-SYN + FIB group, with a 40% loss already at 3 wk after PFF injection, increasing to 60–65% at 12–24 wk (Fig. 1D and Fig. S2A). Striatal denervation was slower to develop in the α-SYN ONLY and FIB ONLY groups: a marginal 20–25% reduction at 3 wk, increasing to 40–50% at 24 wk (Fig. 1D and Fig. S2 B and C). Some of the axons and terminals that stained for both α-syn and TH had a distorted and swollen appearance similar to classic Lewy neurites. They were similar in number and size in the α-SYN + FIB and α-SYN ONLY groups, but fewer and smaller in the FIB ONLY group (Fig. 1 E and F).
The changes seen in VTA and its primary target area, nucleus accumbens (NAcc), were overall less pronounced. At 3 wk after PFF injection, the extent of TH+ cell loss in the VTA (Fig. 1C) and loss of TH+ innervation in the NAcc (Fig. 1D) were similar, 10–20%, in all three groups, increasing to about 40% at 24 wk. The number and size of TH+ axonal swellings in NAcc did not differ between the groups (Fig. 1 E and F).
Motor behavior was assessed in the cylinder and stepping tests at 3, 6, 9, and 12 wk after PFF injection. Significant impairment in left forelimb use (i.e., the limb contralateral to the injections) was observed in the combined α-SYN + FIB group already at 3 wk after PFF injection and remained at the same level of impairment at 9 and 12 wk (Fig. S1 D and E). The performance of the animals in the α-SYN + FIB group was significantly different from that of the α-SYN ONLY and FIB ONLY groups at all time points.
Induction of α-Syn Pathology.
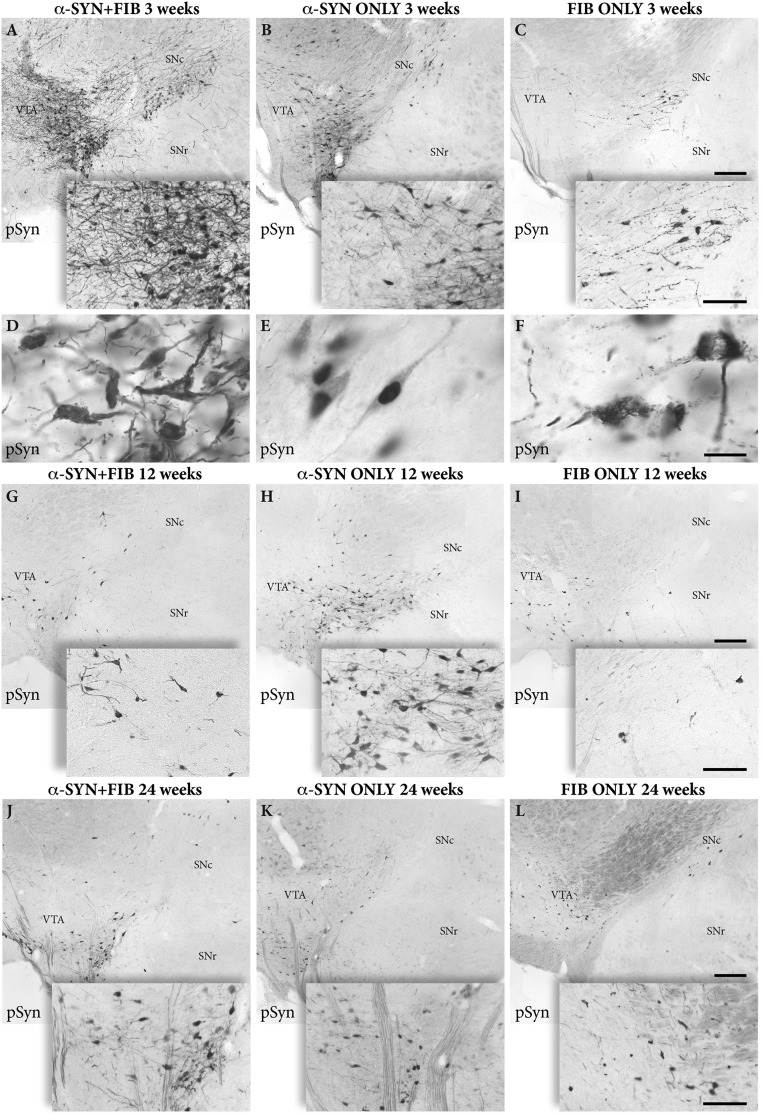
In agreement with previous studies (Introduction) overexpression of α-syn, or injection of PFF, was accompanied by accumulation of phosphorylated α-syn in the affected DA neurons, as detected using either of the two anti–phosphorylated α-syn (pSyn) antibodies used (p-syn81A and p-syn 5038). As illustrated in Fig. 2, the pSyn pathology was much more pronounced in the combined α-SYN + FIB group than in the rats receiving either the vector or the PFF alone. In the FIB ONLY group, these changes were discrete and restricted to a few scattered neurons and neurites located close to the injection sites, and were similar in number at all time points (Fig. 2 C, F, I, and L). In the α-SYN ONLY group, pSyn expression was more widespread than in the FIB ONLY animals (Fig. 2 B, E, H, and K), and in the vast majority of the cells, pSyn was diffusely spread in the cytoplasm, often in combination with a prominent localization in the nucleus (Fig. 2E). In the combined α-SYN + FIB group, the development of pSyn pathology was greatly enhanced (Fig. 2 B, E, H, and K), and it was particularly striking at the early time point, 3 wk after PFF injection (Fig. 2 A and D). In these animals, pSyn staining was mainly confined to inclusions and aggregates (Fig. 2D). This Lewy-like pSyn pathology appeared in large numbers of neurons in both SN and VTA, as well as in swollen and distorted axons and dendrites, similar in appearance to Lewy neurites (Fig. 2D). At the longer time points, 12 and 24 wk after PFF injection, the number of pSyn+ neurons was markedly reduced (Fig. 2 G and J), suggesting that most of the severely affected neurons observed at 3 wk in the α-SYN + FIB group had been eliminated during the subsequent months.
Fig. 2.
Aggregation of pSyn. Representative immunostained sections show the development of intracellular pSyn+ inclusions and aggregates in SN and VTA at 3 wk (A–F), 12 wk (G–I), and 24 wk (J–L) after PFF injection for the three groups: combined AAV plus PFF (α-SYN + FIB, Left), AAV alone (α-SYN ONLY, Center), and PFF alone (FIB ONLY, Right). (Scale bars: A–C, Top, 200 μm; A–C, Bottom, 100 μm; D–F, 20 μm; G–L, Top, 200 μm; G–L, Bottom, 100 μm.). The low-power photographs were generated by stitching of images captured at 40× magnification in the microscope.
The changes were remarkably specific. Despite the fact that AAV-derived expression of human α-syn was induced not only in the nigral DA neurons but also in large numbers of neurons located outside the SN (Fig. S1B), the pSyn pathology was confined almost exclusively to the neurons of the SNc and the VTA, suggesting that the seeding process induced by the PFF was particularly effective in these neurons.
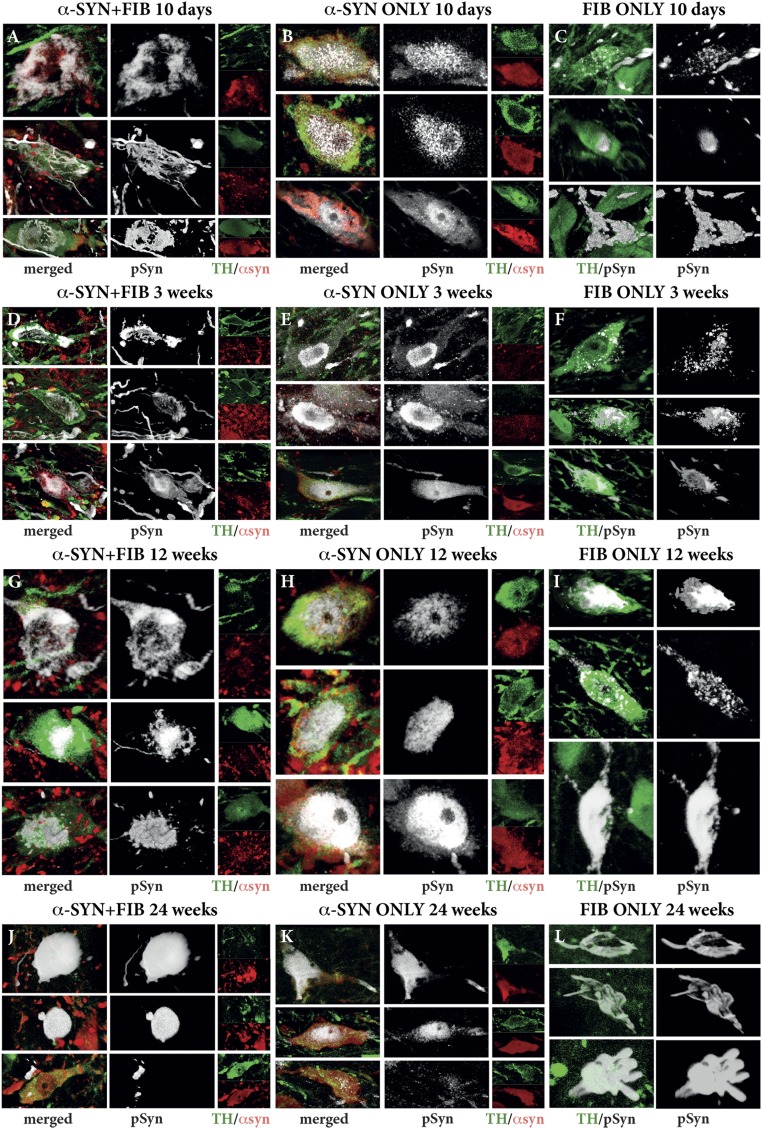
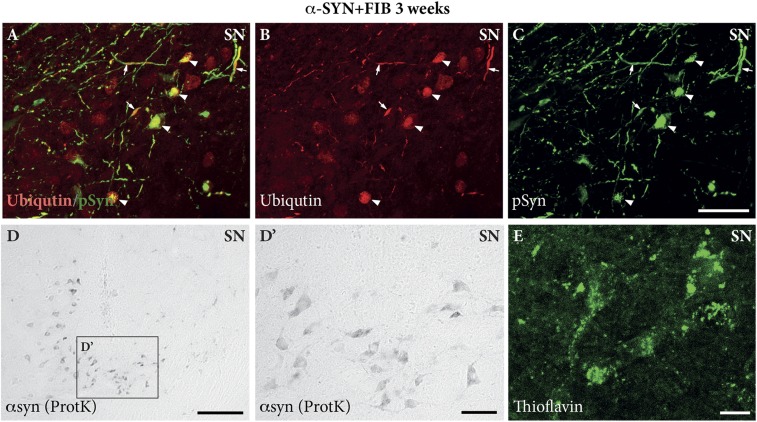
In Fig. S3, we show the morphological appearance of the pSyn aggregates in images acquired as collated, 3D rendered images from triple-immunostained sections in the confocal microscope. In the combined α-SYN + FIB group, the pSyn deposits appeared either as diffuse pSyn+ aggregates (e.g., Fig. S3G at the 12-wk time point) or as a meshwork of pSyn+ filaments (e.g., Fig. S3D at the 3-wk time point), accompanied by a markedly reduced expression of TH (green channel in Fig. S3). The vast majority of these inclusions, and also some of the pSyn+ axonal deposits, stained positively for ubiquitin (Fig. S4 A–C) and thioflavin (Fig. S4E), and were also resistant to digestion with proteinase-K (Fig. S4D), suggesting that they shared the key features of Lewy bodies and Lewy neurites.
Fig. S3.
Development of Lewy-like synucleinopathy in nigral DA neurons over time. Triple-immunofluorescent staining shows the expression of the AAV-derived human α-syn protein (red) and the morphological appearance of the PFF-induced pSyn+ aggregates (white) in the TH+ neurons (green) in the SN. Representative photographs of individual neurons were selected from the α-SYN + FIB (Left), α-SYN ONLY (Center), and FIB ONLY (Right) groups at four different time points after PFF injection: 10 d (A–C), 3 wk (D–F), 12 wk (G–I), and 24 wk (J–L). Images were acquired as collated, 3D rendered images in the confocal microscope.
Fig. S4.
Characterization of the aggregates. The pSyn-immunostained aggregates (green) observed in the SN express features characteristic of Lewy bodies (arrowheads) and Lewy neurites (arrows), staining positively for ubiquitin (red) (A–C) and thioflavin (green in E), and being resistant to proteinase K (ProtK) digestion (D and D′). Images were captured from an α-SYN + FIB–treated animal at 3 wk post-PFF injection. (Scale bars: A–C, 50 μm; D, 100 μm; D′, 50 μm; E, 10 μm.)
These changes were prominent already at 3 wk after PFF injection, and at this time point, most of the affected neurons had assumed a shrunken and distorted shape (Fig. S3D). This prompted us to investigate the changes at an even earlier time point (i.e., at 10 d after PFF injection). In these animals, the injections were made at two sites in the SN (Fig. 3A and Fig. S2C). In the α-SYN + FIB group, striking pSyn pathology was induced already at this early time point, expressed as diffuse aggregates or fibrillar meshwork in a large number of neuron in the SNc (Fig. S3A). At the longer time points, 12 and 24 wk, few p-Syn+ neurons remained, most of them with a distorted appearance and weak or undetectable TH expression (Fig. S3 G and J). These cells contained large pSyn+ deposits, sometimes in the shape of large, spherical inclusions (Fig. S3J).
Fig. 3.
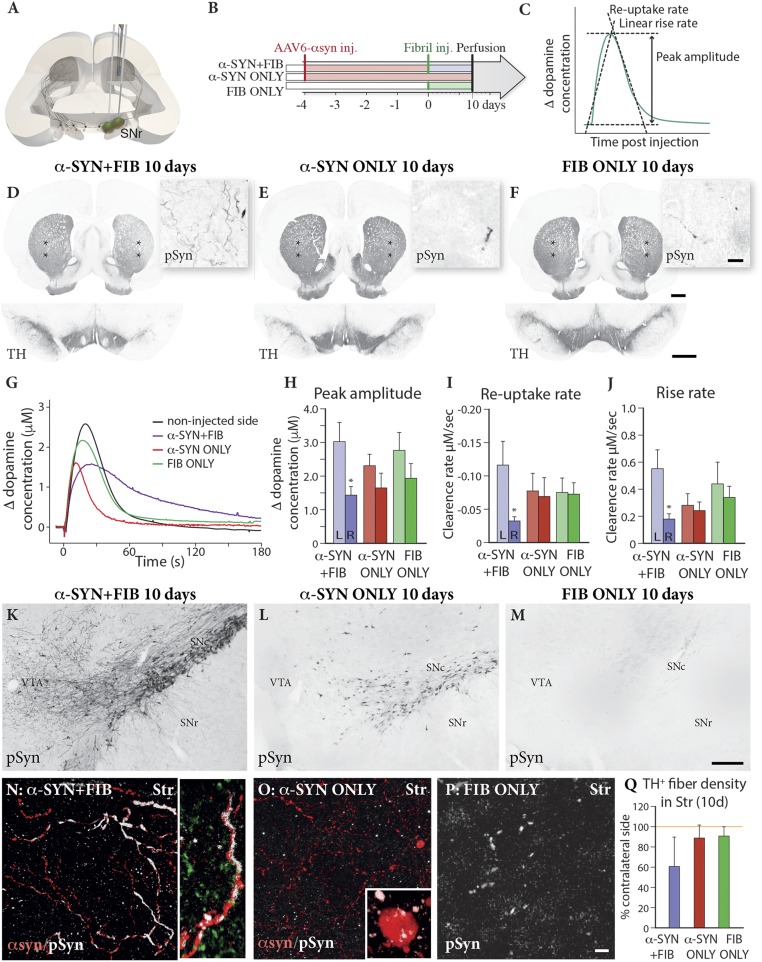
Impact on DA release assessed by in vivo amperometry. Animals received injections in the medial and lateral parts of the SN (A) of AAV–α-syn followed 4 wk later by injections of PFF (α-SYN + FIB), vehicle (α-SYN ONLY), or PFF alone (FIB ONLY) (B). (C) Chronoamperometry recordings of K+-evoked DA release were performed bilaterally from nafion-coated electrodes placed in the centrolateral part of the striatum at 10 d after PFF injection (position marked with stars on the TH-immunostained sections in D–F). (Scale bars: D–F, 1 mm for striatum and SN; D–F, Insets, 20 μm.) In the combined α-SYN + FIB group, the impact of the treatment was seen as a release curve with a lower peak and a broader kinetic profile (purple curve in G). Peak amplitude (H), reuptake rate (I), and release rate (J) were significantly reduced in the α-SYN + FIB animals (*P < 0.05, compared with control side, paired t test: peak amplitude, t(10) = 2.815, P = 0.0183; rise rate, t(9) = 2.647, P = 0.0266; and reuptake rate, t(10) = 3.097, P = 0.0113. Multivariate ANOVA showed a significant difference in peak amplitude and reuptake rate between sides, F(1, 27) = 13.50, P = 0.001, and F(1, 26) = 6.54; P = 0.017, but not in rise rate, F(1, 26) = 2.68, P = 0.114. The accumulation of p-Syn in SN and α-syn–expressing axonal processes in the striatum was much more pronounced in the combined α-SYN + FIB animals (K and N) than in the α-SYN ONLY (L and O) and the FIB ONLY (M and P) groups, accompanied by a trend toward a decrease in TH+ fiber density in the striatum in the α-SYN + FIB group (Q) F(2, 11) = 3,31, P = 0.074. (Scale bars: K–M, 200 μm; N–P, 10 μm.) The photographs in K–M were generated by stitching of images captured at 40× magnification in the microscope.
In the α-SYN ONLY group, pSyn was in most neurons located in the nucleus as well as in small granular aggregates with a diffuse distribution in the surrounding cytoplasm at all time points observed (Fig. S3 B, E, H, and K). The large, cytoplasmic pSyn+ deposits seen in the α-SYN + FIB group were largely absent in the α-SYN ONLY animals. As in the combined group, TH expression was markedly reduced in many of the pSyn-expressing neurons (green channel in Fig. S3) (discussed further below).
In the FIB ONLY group, pSyn pathology was overall more discrete and developed very slowly over time. At 10 d postinjection, single affected cells were detected close to the two injection sites containing varying numbers of small pSyn+ aggregates (Fig. S3C). The number of affected cells increased over time, and the amount and size of the deposits increased progressively (Fig. S3 F, I, and L). At 24 mo, the changes seen in the PFF-exposed cells, although few in number (Fig. 2L), were characterized by a meshwork of pSyn+ material and reduced TH expression, resembling the changes seen at 10 d in the rats in the combined α-SYN + FIB group (compare Fig. S3 A and L).
Impact on the Expression of TH and VMAT-2.
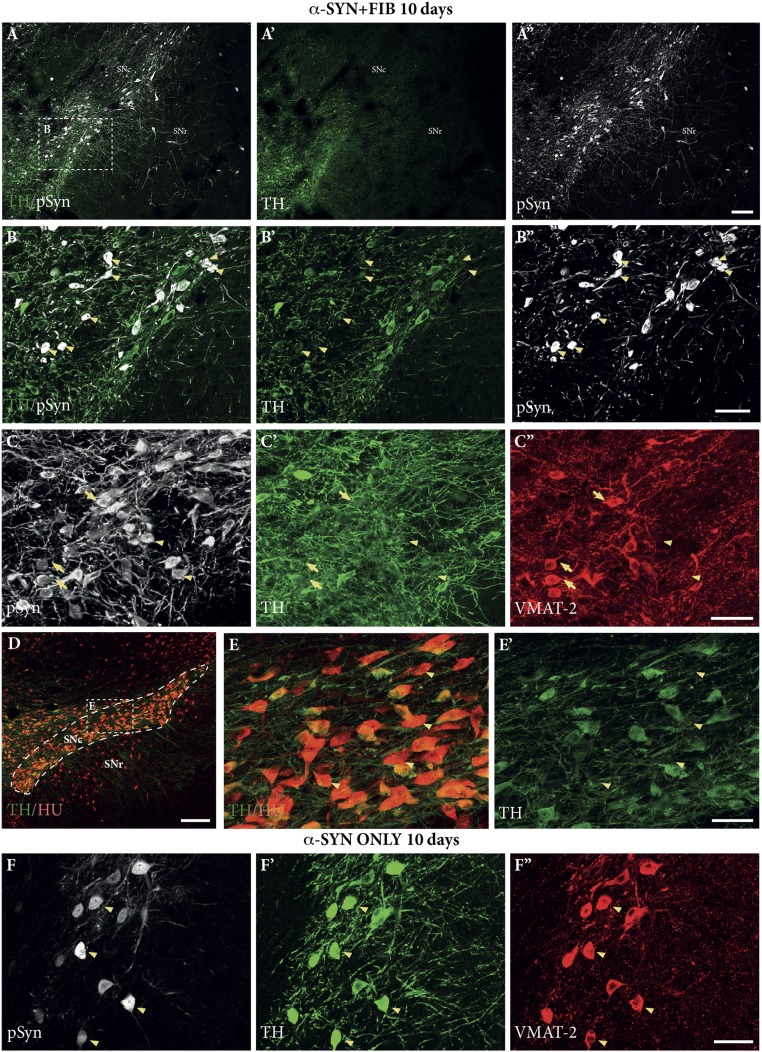
The changes in TH expression were studied in greater detail using confocal microscopy of sections from the SN, stained for TH and pSyn in combination with either human α-Syn or the panneuronal marker ELAV-like protein (Hu) (Fig. 4). In the combined α-SYN + FIB group, the vast majority of the cells in SNc with prominent pSyn pathology expressed TH at reduced or undetectable levels (arrowheads in Fig. 4B). Quantification performed in the part of the SNc containing pSyn-expressing neurons, assessed at 10 d and 3 wk after PFF injection, showed that about 20% of the surviving Hu+ neurons in the SNc were TH− (Fig. 4 D and E). Thus, the overall reduction in the number of TH+ neurons, which amounted to about 50% at 3 wk (Fig. 1C), was, in part, due to loss of TH expression in neurons that had developed more prominent pSyn pathology.
Fig. 4.
TH and VMAT-2 down-regulation. (A–C) Representative photographs of triple-stained sections from the combined α-SYN + FIB group, showing marked down-regulation of TH (green) and VMAT-2 (red) in neurons containing dense p-Syn+ aggregates (white) at 10 d after PFF injection (examples marked by arrowheads). Arrows in C–C′′ mark cells where TH is down-regulated and the expression of VMAT-2 is retained. (D and E) Colabeling with the panneuronal marker Hu confirmed that part of the surviving neurons in SNc had lost their TH expression (arrowheads). In the animals treated with AAV vector alone (α-SYN ONLY), pSyn was more diffusely distributed in the cytoplasm (F) and the expression of TH and VMAT-2 was mostly retained (F′ and F′′, arrowheads). (Scale bars: A, A′, and A′′, 100 μm; B, B′, and B′′, 50 μm; C, C′, and C′′, 50 μm; D, 200 μm; E and E′, 50 μm; F, F′, and F′′, 50 μm.)
Sections stained for TH and VMAT-2 (Fig. 4 C and F; α-SYN + FIB group) showed that the impact on VMAT-2 expression was more variable. In cells with low or moderate expression of pSyn, the expression of VMAT-2 was retained (arrows in Fig. 4C), whereas both TH and VMAT-2 were markedly reduced or absent in cells expressing more severe pSyn pathology (arrowheads in Fig. 4C). The expression of these two enzymes was largely unaffected in the α-SYN ONLY animals (Fig. 4F), suggesting that the down-regulation seen in the combined α-SYN + FIB group was caused not by the expression of pSyn itself, but by the pSyn+ pathology induced by the injected fibrils.
Impact on DA Release Assessed by in Vivo Amperometry.
Next, we used in vivo amperometry to investigate possible changes in DA release in the striatum in animals from the α-SYN + FIB, α-SYN ONLY, and FIB ONLY groups at 10 d after PFF injection (i.e., 38 d after vector injection). As indicated in Fig. 3C, we measured the rate of K+-evoked release, the amplitude of the release curve, and the rate of reuptake of DA. The recordings were made bilaterally from electrodes placed at two different sites in the centrolateral part of the striatum, as illustrated in Fig. 3 D–F, allowing us to compare the responses in the affected striatum with those recorded from the intact side (Fig. 3A).
The results showed a significant impairment in the α-SYN + FIB rats, most prominently in the rates of release and reuptake that were reduced by about 70% in these animals (Fig. 3 H–J). In the α-SYN + FIB group, a paired t test of the peak amplitude data showed significantly lower release on the injected side (P = 0.018; n = 11). A slight reduction in peak amplitude could be seen also in the FIB ONLY and α-SYN ONLY groups, but these effects were not statistically significant. Reuptake rate was similarly affected in the mixed treatment group (P = 0.028, paired t test; n = 10) but not in the single-treatment groups. The rate of release was slower on the injected side in the α-SYN + FIB group (P = 0.011; n = 11).
The net effect of the alterations induced by the combined treatment was seen as a release curve with a lower peak level and with a broader kinetic profile (purple curve in Fig. 3G). The magnitude of this change, however, varied markedly between the individual measuring points, as well as between animals. This reflected most probably the uneven distribution of pSyn pathology in the nigrostriatal afferents. The pSyn pathology was overall much more pronounced in the α-SYN + FIB animals than in the other two groups (Fig. 3 K–M), and it was observed not only in the cell bodies and processes of the DA neurons in the SNc but also in axons and terminals in the striatum (Fig. 3 N–P). The overall striatal TH+ fiber density was reduced by about 40% (Fig. 3Q), but this reduction varied not only between animals but (as seen in Fig. 3D) also between areas in the striatum. The pSyn-expressing axons and terminals showed a similarly uneven and patchy distribution, suggesting that the variable effect on DA release depended on the extent of axonal pathology and TH+ fiber loss at the electrode placement site.
Inflammatory Response.
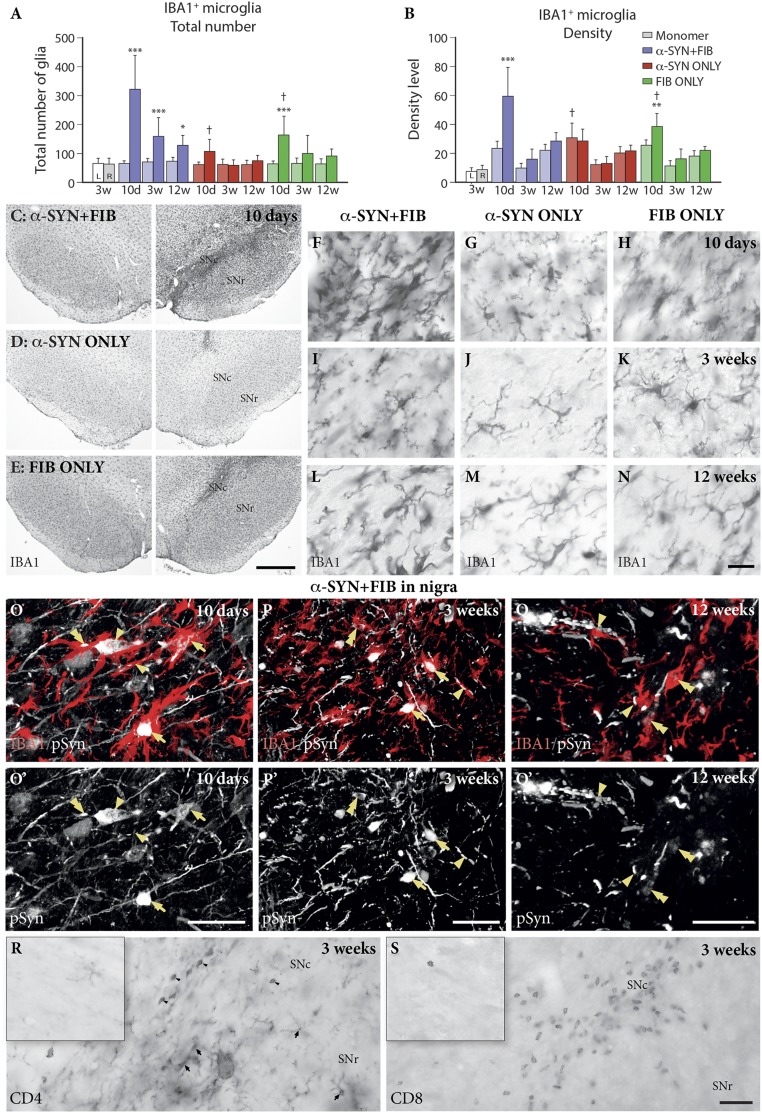
The relatively modest microglial reaction seen in the α-SYN ONLY and FIB ONLY animals was substantially amplified in the combined α-SYN + FIB group. This effect was primarily confined to the SNc (i.e., the area containing the affected cell bodies) (Fig. 5C), and was much less pronounced in other areas, such as the SN pars reticulata (SNr) (Fig. S5). In the combined group, the number of Iba1+ microglia in the SNc increased fivefold, and their overall staining intensity increased 2.5-fold, at 10 d after PFF injection (purple bars in Fig. 5 A and B). The reaction declined over time, in parallel with the loss of pSyn-affected DA neurons, as shown in Fig. 2, but a distinct microglial response remained still by 12–24 wk (Fig. 5L). At this time, the reaction seen in the α-SYN ONLY and FIB ONLY animals had faded out (red and green bars in Fig. 5 A and B). Injection of α-syn monomers, rather than PFF, did not induce any measurable microglial reaction (open bars in Fig. 5 A and B).
Fig. 5.
Inflammatory response in SN. Total number of IBA1+ cells (A) and their staining density (B) were quantified in the SNc of animals injected with α-SYN + FIB (purple), α-SYN ONLY (red), FIB ONLY (green), or monomers (white). The differences between injected and noninjected sides, as well as between the different groups, were significant in both total number—side, F(1, 55) = 106.83, P < 0.001; group, F(3, 55) = 30.24, P < 0.001—and density—side, F(1, 55) = 73.96, P < 0.001; group, F(3, 55) = 7.56, P < 0.001, respectively. All data are mean ± SD. *P < 0.05; **P < 0.01; ***P < 0.001, compared with the contralateral side. †P < 0.05, compared with the α-SYN + FIB group at the same time point. (C–N) Representative images of IBA1 staining for each group at different time points. (Scale bars: C–E, 500 μm; F–N, 20 μm.) (O–Q) Reactive IBA1+ microglia (red) attached to pSyn-containing cell bodies and processes (white) (arrowheads); cells with advanced pSyn pathology were frequently seen to be completely enclosed or engulfed by one or several microglial cells (arrows). The pSyn+ grains or filaments were observed also inside Iba1+ cells (double arrows). (Scale bars: 50 μm.) (R and S) Infiltration of CD4+ and CD8+ T lymphocytes in the SNc (arrowheads in R) and CD4+ expression in processes of activated microglia (arrows in R) at 3 wk after PFF injection in an animal from the α-SYN + FIB group. No similar staining was observed on the noninjected control side (Insets). (Scale bars: R, S, and Insets, 20 μm.)
Fig. S5.
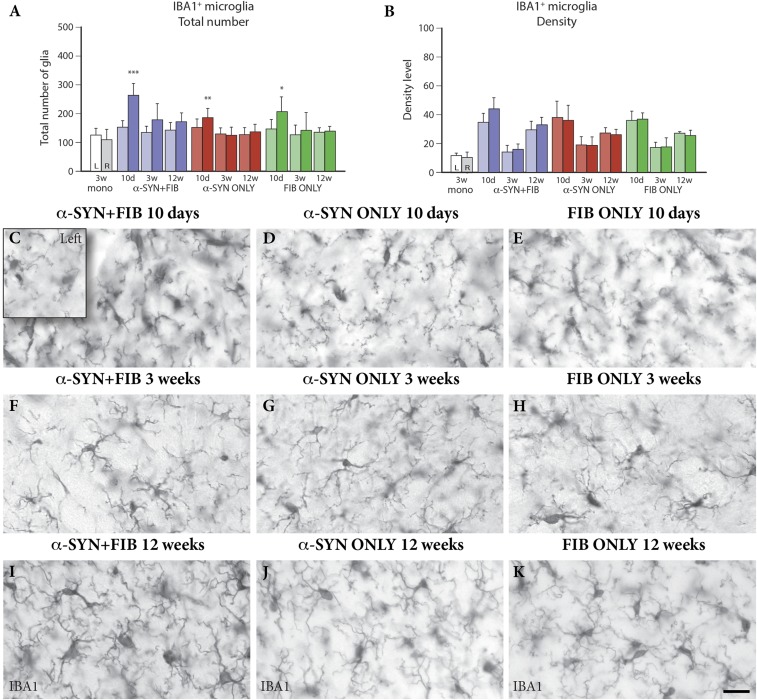
Inflammatory response in SN pars reticulata. Total number of IBA1+ cells (A) and their staining density (B) were quantified in the SN pars reticulata of animals injected with α-SYN + FIB (purple), α-SYN ONLY (red), FIB ONLY (green), or monomers (mono; white). The differences between the injected and noninjected sides were significant in both total number, F(1, 55) = 48.61, P < 0.001, and density, F(1, 55) = 14.28, P < 0.001. All data are mean ± SD. *P < 0.05; **P < 0.01; ***P < 0.001, compared with the contralateral side. (C–K) Representative images of IBA1 staining are presented for each group at the different time points. (Scale bars: 20 μm.)
Further analysis of the microglial response, performed on 3D-rendered images from double-stained sections in the confocal microscope, showed that the reactive microglia were closely associated with cells and processes expressing pSyn pathology. Hypertrophic Iba1+ microglial cells attached closely to pSyn-containing cell bodies and processes (arrowheads in Fig. 5 O–Q), and cells with advanced pSyn pathology were frequently seen to be completely enclosed or engulfed by one or several microglial cells (arrows in Fig. 5 O–Q). Closer inspection at higher magnification showed that pSyn-immunostained grains or filaments were observed also inside Iba1+ cells (double arrows in Fig. 5 O–Q), suggesting the presence of cellular debris, engulfed by the cells, or uptake of pSyn oligomers or fibrils released by the affected DA neurons. These cellular changes were prominent at the early time points, 10 d and 3 wk (Fig. 5 O and P), but were still present at 12 and 24 wk, albeit in lower numbers (Fig. 5Q).
Similar to previous findings in human Parkinson’s disease and 1-methyl-4-phenyl-1,2,3,6-tetrahydropyridine (MPTP)-treated mice (20), we observed infiltration of CD4+ and CD8+ T lymphocytes, distributed in patches within the areas of the SNc containing pSyn pathology and activated microglia (Fig. 5 R and S; 3-wk survival). Distinct CD4 expression was also observed on the processes of cells with the appearance of activated microglia (arrows in Fig. 5R). These changes remained at a reduced level at 12 wk after PFF injection.
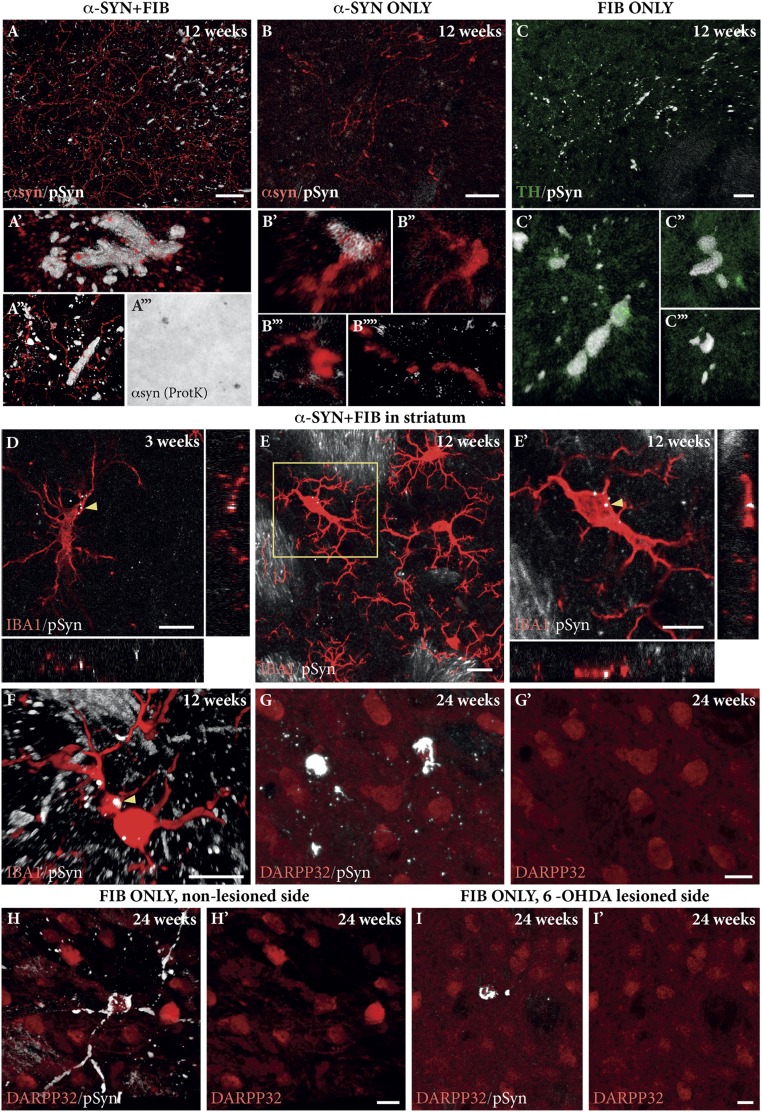
A distinct microglial response was observed also in the parts of the striatum containing pSyn+ distorted and swollen axons and terminals (Fig. 6 A–C). In these reactive areas, pSyn+ grains were found in cell bodies and processes of Iba1+ reactive microglia (arrowheads in Fig. 6 D–F), suggesting transfer of pSyn from the affected nigrostriatal terminals to reactive microglia in the striatum. These signs of pSyn transfer were found already at 3 wk after PFF injection (Fig. 6D) and also remained prominent at longer time points (12 wk; Fig. 6 E and F).
Fig. 6.
Striatal pathology. Expression of human α-syn (red) and p-Syn+ inclusions (white) was observed in axons and terminals in the striatum of animals from the α-SYN + FIB group (A) and, to a lesser extent, from the α-SYN ONLY (B) and FIB ONLY (C) groups. (Scale bars: A–C, 20 μm.) (A′′′) Some of these inclusions were resistant to proteinase K (ProtK) digestion. (D–F) The p-Syn+ grains were also observed in hypertrophic IBA1+ microglia. (Scale bars: D, 10 μm; E, 20 μm; E′ and F, 10 μm.) (G) In the PFF-injected animals p-Syn+ pathology (white) transferred to a few DARPP32+ medium spiny neurons (red). This transfer, which was detected only at 12–24 wk after PFF injection, occurred independent of the presence of DA fibers projecting to the striatum [intact side (H) and 6-OHDA–lesioned side (I)]. (Scale bars: G, H, and I, 10 μm.)
Transfer of pSyn to Neurons in the Striatum.
Neuron-to-neuron transfer of oligomeric or fibrillar forms of α-syn has been well documented following injections of PFF into the brain (14, 21, 22), and a slow and progressive transfer along synaptically linked pathways, observed as pSyn+ deposits in cells and neurites, has been shown to occur after injection of PFF into the olfactory bulb (21). This phenomenon, however, has so far not been observed in the AAV–α-syn model. In the α-SYN + FIB and FIB ONLY animals processed 24 wk after PFF injection, we could detect pSyn+ inclusions and aggregates in a few scattered neurons (0–10 per section) located in the ventromedial striatum and the adjacent part of NAcc. Such cells were found also in some of the 12-wk specimens, albeit in lower numbers and with less elaborate pSyn+ aggregates, but not in the animals processed 3 wk after PFF injection.
Confocal microscopy of sections showed that the cells containing pSyn+ aggregates expressed the striatal neuron marker DARPP-32 (Fig. 6G). Since some of the DARPP-32–expressing neurons are known to project to the SN, this raised the possibility that the pSyn+ inclusions could be derived from PFF retrogradely transported from the SN within striatonigral axons. To investigate that possibility, we performed an additional experiment where PFF were injected bilaterally into the SN and VTA in rats that, 4 wk earlier, had received a 6-hydroxydopamine (6-OHDA) injection into the MFB (n = 8), resulting in a complete removal of the TH+ innervation on the lesioned side. The brains were processed for double-pSyn/DARPP-32 immunostaining 24 wk after PFF injection. As shown in Fig. 6 H and I, the appearance of pSyn+ aggregates in DARPP-32–expressing striatal neurons was similar on both sides, indicating that the induction of pSyn+ inclusions was not due to transsynaptic transfer of PFF from the DA neurons to their striatal targets, but more likely reflecting retrograde transport of PFF seeds in the striatonigral projection neurons. The rate of appearance of these aggregates suggests that these seeds expanded over the following 3–6 mo into large cytoplasmic aggregates.
Discussion
Animal models of Parkinson’s disease based on α-syn overexpression are important for our understanding of disease pathogenesis and are also useful tools for validation of therapeutic targets. However, most α-syn–based rodent models do not display neurodegeneration of the nigrostriatal tract unless α-syn is expressed at levels that far exceed what is seen in the human disease. The ability of PFF to act as seeds for the formation of Lewy body-like α-syn aggregation has been extensively documented, both in cell cultures and in α-syn–overexpressing mice and rats. It has also been shown that this process is dependent on the level of endogenous α-syn present in the cell (14, 15, 18) and that aggregate formation is more efficient if the PFF and the endogenous α-syn to be recruited into the aggregates are from the same species (19).
In the Parkinson’s disease model described here, we used human α-syn PFF in combination with AAV-induced human α-syn expressed at a level that, by itself, induced only modest pSyn pathology and no inflammatory response. The effect of this combination was striking: injection of PFF triggered within 10 d the formation of large pSyn+ aggregates and filamentous inclusions, accompanied by degenerative changes and a prominent inflammatory response. This was in stark contrast to the changes seen in the animals treated with PFF alone, where the development of α-syn–induced pathology was a much more restricted and protracted process limited to a small number of neurons located close to the injection sites. This is consistent with the view that the recruitment of endogenous rat α-syn by human PFF into toxic aggregates is both slow and inefficient. As a consequence, the acute toxicity and cell death, as well as the accompanying inflammatory response, in response to the PFF injection, were quite discrete. It is safe to conclude, therefore, that the pSyn pathology, toxicity, and inflammation seen in the combined α-SYN + FIB animals were due to the recruitment of human α-syn expressed from the vector.
In the α-SYN + FIB animals, abundant pathological changes were observed as early as 10 d after PFF injection. At this early time point, the vast majority of the pSyn-expressing neurons in the SN were still alive, but with reduced expression of the DA-synthesizing enzyme TH and accompanied by a significant impairment in DA release and reuptake as measured by in vivo amperometry in the striatum. In the α-SYN + FIB group, the loss of TH+ neurons in the SN seen at 3 wk after PFF injection (−55%) was similar in magnitude to that obtained only at 6 mo in the α-SYN ONLY and FIB ONLY animals. The number of pSyn-expressing neurons declined over time, and, in SN at least, this decline was consistent with a progressive loss of the most severely affected neurons over time. In VTA, it appeared that the extent of pSyn pathology at the early time points exceeded the relatively modest loss of neurons seen at later time points, suggesting that the VTA neurons were able to dispose of excess toxic pSyn, thus making them more resistant to α-syn–induced toxicity.
At the longest survival time points studied here, 12–24 wk after PFF injection, about 60–70% of the TH+ neurons in the SN and about 40% of the TH+ neurons in the VTA had degenerated. Thus, the impact of PFF seeds in the α-syn–overexpressing cells appeared as a potentiation of the acute pSyn-induced toxicity in combination with an acceleration of the processes that lead to cell death in the affected DA neurons. In line with previous studies (23–25), these observations are in support of the view that it is the development of toxic pSyn-containing aggregates that drives degeneration and cell death. The ability of some affected DA neurons to survive long term also in the presence of elevated levels of pSyn suggests, moreover, that the toxic impact of pSyn+ inclusions may be dose-dependent.
The pSyn aggregation occurred exclusively at the injection site. Interestingly, the ability of the PFF to induce pSyn+ inclusions seemed to be highly selective for the DA neurons in the SN and the VTA. Despite the fact that AAV-derived human α-syn was expressed not only in the nigral DA neurons but also in large numbers of neurons located outside the midbrain DA neuron domain, the pSyn pathology was confined almost exclusively to the neurons of the SNc and the VTA. This is an intriguing finding, suggesting that the seeding process induced by the PFF was particularly effective in these neurons. This is in line with previous studies showing that DA can interact with α-syn to promote the formation of oligomers and increase its toxicity in DA-expressing neurons (26–29). Thus, the generation of toxic α-syn aggregates may be facilitated in the presence of DA and may be further promoted by the increased oxidative stress associated with its metabolism (28).
Similar to what has been observed in the SN in human Parkinson’s disease (20, 30), the immune/inflammatory response induced by the injection of PFF in the combined α-SYN + FIB animals involved both activation of resident microglia and infiltration of T lymphocytes. The microglial response, in particular, had several interesting features. It developed rapidly and was regionally specific in that it was most prominently expressed in the region of the affected nigral DA neurons. The hypertrophic microglia were closely associated with the cell bodies and neurites of neurons expressing Lewy-like pSyn pathology, and, as illustrated by the 3D confocal images in Fig. 5, they were frequently seen to enclose or engulf cells and processes containing pSyn+ aggregates. An additional notable finding was the appearance of pSyn+ grains and short filaments inside the hypertrophic Iba1+ microglia, reflecting an active uptake of pSyn oligomers or fibrils released by the affected neurons or, alternatively, the presence of pSyn-containing cellular debris internalized by the activated microglia. This microglial uptake of pSyn was observed also in the striatum in the area of the pSyn-expressing nigrostriatal axons and terminals.
The prominent involvement of microglia in the PFF-induced toxic response is in line with previous studies showing that α-syn oligomers are efficient activators of a microglia-dependent proinflammatory response, including microglial activation and release of proinflammatory cytokines, as well as infiltration of CD4+ T lymphocytes (28, 31–33). This effect is, at least in part, mediated by internalization of α-syn oligomers by phagocytosis (28, 34) as well as activation of the Toll-like receptor 2 expressed by the resident microglia (32).
There is compelling evidence that this immune/inflammatory cascade is triggered by release of oligomeric α-syn from the affected neurons, and that it is involved as a mediator of the α-syn–induced toxic response (recently reviewed in ref. 35). In cell culture models, it has been shown that α-syn is released from neuronal cells in the form of oligomers and that their production and release are markedly increased in the presence of DA (27, 28, 32). This readily explains not only why the PFF-induced pSyn toxicity was confined to the nigral DA neurons but also why the microglial response seen here was restricted to the area close to the cell bodies and processes of the affected DA neurons and around the pSyn-expressing dystrophic axons and terminals in the striatum. This occurred early after PFF injection close to the pSyn-expressing but still surviving neurons, suggesting that the initial inflammatory reaction was induced by release of oligomers produced by the PFF-induced seeding process. As suggested by Zhang et al. (28), this oligomer-induced microglial reaction may add to the toxic impact induced by intracellular pSyn aggregation, and thus help to drive and accelerate the neurodegenerative process.
In the α-SYN + FIB and FIB ONLY animals, we observed transfer of pSyn not only to microglia but also to the medium spiny projection neurons in the striatum. The number of pSyn-containing striatal neurons was very low, however, and was due to retrograde transport of PFF seeds in the striatonigral projection neurons rather than transsynaptic transfer from the DA neurons to their striatal targets. In agreement with previous findings (13, 17, 18), this process was very slow and fully developed only at 3–6 mo after PFF injection.
Conclusion
The results show that the ability of externally administered PFF to trigger Lewy-like pSyn pathology is dramatically enhanced and accelerated in the presence of elevated cytoplasmic levels of α-syn. The use of human α-syn PFF in combination with AAV-mediated overexpression of human α-syn provides a model of Parkinson’s disease-like synucleinopathy with several interesting features. First, the induction of pSyn+ aggregates is rapid, within 10 d after PFF injection, and is confined almost exclusively to the cell bodies and processes of DA neurons in SN and VTA. These pSyn+ aggregates express Lewy-like features, including proteinase-K resistance and coexpression with ubiquitin. Second, the development of pSyn pathology is accompanied by a prominent immune/inflammatory response that involves both activation of resident microglia and site-specific infiltration of T lymphocytes; it develops early at the site of pathology in SNc and striatum, before any overt cell loss has occurred, and is maintained over at least 3–6 mo, involving also transfer of pSyn from the affected neurons to hypertrophic microglia. Third, the impact on DA neuron function and survival develops in stages, as reflected in impaired striatal DA release and reduced expression of TH and VMAT-2, followed by degeneration of the aggregate-bearing nigral neurons that starts at around 3 wk after PFF injection and progresses over the subsequent months.
The range of neurodegenerative and inflammatory changes induced by PFF in combination with AAV-mediated overexpression of α-syn reproduces many of the cardinal features of the human disease, including early stage axonal pathology and neuronal dysfunction, neuroinflammation without the presence of overt neurodegeneration, induction of Lewy-like synucleinopathy in cell bodies and neurites, and progressive DA neuron cell loss. The short time span and the distinct sequence of pathological and degenerative changes seen with this combined approach make it attractive as an experimental model for studies aimed at neuroprotection and disease modification. An additional attractive feature of this model is that it is applied unilaterally, which means that the contralateral untreated side can be used as an internal reference and control.
Materials and Methods
Experimental Design.
All experiments have been approved by the Ethical Committee for the use of laboratory animals in the Lund–Malmö region (Sweden) and follow the European Communities Council Directive (2010/63/EEC). Female Sprague–Dawley rats (225–250 g; Charles River) received unilateral injections of AAV–α-syn alone (α-SYN ONLY group; n = 32), PFF alone (FIB ONLY group; n = 31), or a combination of AAV–α-syn and PFF (α-SYN + FIB group; n = 33) administered 4 wk apart. In one set of experiments, injections were made into the SN and VTA at the following coordinates: SN: anteroposterior (AP), −5.3; mediolateral (ML), −1.7; dorsoventral (DV), −7.2; and VTA: AP, −5.3, ML, −0.5; DV, −7.0. In a second set, the injections were made at two sites in the SN at the following coordinates: (i) AP, −5.3, ML, −1.6, DV, −7.2; and (ii) AP, −5.3, ML, −2.6, DV, −6.7. Rats injected in SN and VTA were killed and perfused for immunohistochemical analysis at 3, 12, and 24 wk after the PFF injection (seven to eight rats per group). The rats injected at two sites in SN (9–11 rats per group) were killed at 10 d after PFF injection. Four additional rats injected with PFF only were killed 3 h (n = 2) or 3 d (n = 2) after the injection. In one group (n = 8), the rats had received a unilateral injection of 6-OHDA in the medial forebrain bundle, followed by a bilateral injection of PFF in SN and VTA.
We used an AAV6 vector to overexpress human wild-type α-syn, in which the expression of the transgene is driven by the human synapsin-1 promoter, as described elsewhere (36). A total of 8.8 × 10⁸ genome copies were injected per animal (2 μL per site). PFF were prepared from full-length recombinant human α-syn, as described previously (16) and injected 4 wk after the vector injection at the same coordinate sites (10 μg total, 2.5 μL per site).
Tissue Processing and Immunohistochemistry.
Animals were perfused under deep pentobarbital anesthesia with saline, followed by ice-cold paraformaldehyde (4% wt/vol in 0.1 M PBS). Immunostaining was performed on 35-μm-thick frozen sections, as described elsewhere (9), using antibodies listed in Table S1.
Table S1.
List of antibodies used in the study
| Antigen | Company | Host | Dilution |
| α-Syn | BD Biosciences | Mouse | 1:1,000 |
| α-Syn | EMD Millipore | Rabbit | 1:1,000 |
| α-Syn 211(human-specific) | Abcam | Mouse | 1:1,000 |
| pSyn 5038 (Ser129) | EMD Millipore | Rabbit | 1:1,000 |
| pSyn 81A (Ser129) | Abcam | Mouse | 1:10,000 |
| CD4 | AbD Serotec | Mouse | 1:500 |
| CD8 | AbD Serotec | Mouse | 1:500 |
| DARPP-32 | Abcam | Rabbit | 1:1,000 |
| Hu | Abcam | Mouse | 1:200 |
| IBA-1 | Wako | Rabbit | 1:1,000 |
| NeuN | EMD Millipore | Mouse | 1:1,000 |
| TH | EMD Millipore | Sheep | 1:1,000 |
| TH | Abcam | Rabbit | 1:1,000 |
| Ubiquitin | Dako | Rabbit | 1:200 |
| VMAT-2 | Abcam | Rabbit | 1:5,000 |
Quantification of TH+ Cell Numbers, Fiber Density, and IBA1+ Microglia.
The total number of TH+ neurons in the SN and VTA was determined by unbiased stereology according to the optical fractionator principle using a Stereo-Investigator System (MBF Biosciences). TH+ fiber density was measured bilaterally at three sites in the medial, central, and lateral parts of the caudate-putamen and at two sites in the NAcc using the “sphere counting” technique of Mouton et al. (39) as described previously. Density of IBA1+ microglia was determined in the SN bilaterally from z-stacks of pictures using a 40× objective, and 3D images were compiled. Mean staining density was determined and expressed as the percentage of density measured on the control side.
Behavioral Testing.
Forelimb use in the stepping and cylinder tests was as described in SI Materials and Methods.
In Vivo Amperometry.
Chronoamperometric recordings of DA release were performed bilaterally at 10 d post-PFF injection from two sites in the striatum, as described previously (40, 41).
Statistics.
All data are expressed as the mean ± SD. Statistics were applied using SPSS (IBM SPSS Statistics for Windows, version 21.0; IBM Corp.). Significant changes were evaluated using multivariate ANOVA followed by post hoc analysis using Bonferroni or Sidak corrections for multiple comparisons, as appropriate. P values were considered significant when less than 0.05. In the analysis of the amperometry data, we compared release on the injected and control sides using paired t tests.
Further experimental details are provided in SI Materials and Methods.
SI Materials and Methods
Tissue Processing and Immunohistochemistry.
Animals were perfused under deep pentobarbital anesthesia (1.5 mL, i.p.) with 50 mL of saline (0.9% wt/vol) at room temperature, followed by ice-cold paraformaldehyde (4% wt/vol in 0.1 M PBS). Brains were postfixed in the same solution for at least 24 h and cryoprotected overnight in 25% sucrose (in 0.1 M PBS). Then, 35-μm-thick coronal sections were cut using a freezing microtome (Leica) and collected in eight series. Free-floating sections were incubated at 80 °C for 30 min in Tris⋅EDTA buffer [10 mM Tris base, 1 mM EDTA solution, 0.05% Tween 20 (pH 9.0)]. Staining was performed as described elsewhere (9) using antibodies listed in Table S1. For triple-fluorescence immunostaining, Alexa 488-, Alexa 568-, and Alexa 642-conjugated secondary antibodies were used.
Thioflavin staining was performed as follows. Sections were dipped in water, washed, and then incubated successively in a 0.01% thioflavin S (Sigma) solution for 5 min and 70% ethanol for 1 min and then washed in PBS three times. For proteinase K digestions, mounted sections were incubated in proteinase K solution (5 μg/mL; QIAGEN) for 60 min at room temperature before proceeding with DAB (3,3′-diaminobenzidine) staining (as described above). Confocal microscopy was performed with a Leica TCS SP8 confocal microscope under 20× or 63× objective magnification. Three-dimensional images were generated from z-stacks of pictures captured throughout the thickness of the 35-μm-thick sections using Volocity v.5.4.2 image analysis software (PerkinElmer).
Quantification of TH+ Cell Numbers and Fiber Density.
The total number of TH+ neurons in the SN and VTA was determined by unbiased stereology according to the optical fractionator principle using a Stereo-Investigator System (MBF Biosciences). The border of SN or VTA was traced at 5× magnification, and counting was done at 100× magnification. Cell counting was performed separately on both sides of the brain. Final results were expressed as the percentage of remaining cells on the injected side compared with the contralateral side.
TH+ fiber density was measured bilaterally at three sites in the medial, central, and lateral part of the caudate-putamen and at two sites in the NAcc using the “sphere counting” technique of Mouton et al. (39) as described previously. For measurement of axonal swellings, a z-stack of pictures was captured throughout the thickness of the section using a 40× objective, and images were compiled using Volocity 5.4.2 software. TH+ structures with a volume larger than 20 μm3 were defined as pathological and quantified.
Quantification of IBA1+ Microglia.
The density of IBA1+ microglia was determined in the SN bilaterally using the same Volocity 5.4.2 software. A z-stack of pictures was captured throughout the thickness of the 35-μm-thick sections using a 40× objective, and 3D images were compiled. From each measured area, 338 × 330 μm, the total number of IBA1+ cells was recorded from pars compacta and pars reticulata at two levels through the SN, −5.2 mm and −5.3 mm behind bregma. Data are expressed as the total number per measuring field and as the percentage of the control side. Mean staining density was determined and expressed as the percentage of density measured on the control side.
Behavioral Testing.
Cylinder test.
Rats were placed in a transparent glass cylinder and allowed to move freely. A total of 20 paw touches were counted, and the percentage of touches made with the left paw (contralateral side) was used as a measure of the dopaminergic system.
Stepping test.
Rats were held in a manner that restrained one paw while the other paw was left freely moving, and were then allowed to walk over a length of 90 cm both in forehand and backhand directions. The total number of steps taken by the left and right paws was recorded. Rats were trained to perform this test a day before the test. To reduce the bias, animals were tested for three consecutive days, the median of the readings was used, and the same researcher performed the test blindly for the entire experiment.
In Vivo Amperometry to Detect DA Release and Reuptake.
Chronoamperometric recordings were made with nafion-coated carbon fiber electrodes (SF1A; Quanteon) (38, 40). A 10-Hz square wave potential was applied (0.55-V applied potential, 0-V resting potential), and the resulting oxidation and reduction current were recorded with a temporal resolution of 0.5 s. Each electrode was individually calibrated in vitro in 0.1 M PBS, and the linearity of the response was verified by three additions of 2 μM DA. Linearity of the response (r2) was 0.999 ± 0.002, and the limit of detection was 45 nM ± 71 nM (SD). Selectivity of DA vs. ascorbic acid averaged 3,018:1.
Bilateral recordings were made 10 d after PFF injection from striatum at two sites (from bregma: AP, +1; L, ±2.7; V, −4.5 and −5.0 mm) from 11 α-SYN + FIB, 10 FIB ONLY, and 9 α-SYN ONLY animals. Each electrode was mounted together with a micropipette (10–15 μm OD) 90–110 μm away from the recording electrode. DA release was induced by pressure ejection of 120–150 nL of 120 mM KCl using a micropressure system (Parker picospritzer III) with three consecutive ejections spaced 5 min apart. DA release from the first KCl ejection was used in the data analysis. The first release event was considered to be release from the idle state, whereas the two following events were used to investigate reloading capacity. No difference in reloading capacity was found between groups. Peak amplitude was calculated as the maximum DA concentration after KCl ejection minus baseline. Reuptake rate and the release rate were defined as the linear concentration change per time unit (μM⋅s−1) between 40% and 60% of the peak maximum portion of the reuptake part of the curve (post peak) and release part (prepeak), respectively.
Acknowledgments
We thank Ulla Jarl for excellent technical support and Jenny B. Johansson for the production of the AAV vectors used in this study. This research was supported by Swedish Research Council Grant 04X-3874 and a grant from the Swedish Foundation for Strategic Research, as well as by National Institute of Neurological Disorders and Stroke-funded Udall Center Grant P50 NS053488.
Footnotes
The authors declare no conflict of interest.
This article contains supporting information online at www.pnas.org/lookup/suppl/doi:10.1073/pnas.1710442114/-/DCSupplemental.
References
- 1.Spillantini MG, et al. Alpha-synuclein in Lewy bodies. Nature. 1997;388:839–840. doi: 10.1038/42166. [DOI] [PubMed] [Google Scholar]
- 2.Polymeropoulos MH, et al. Mutation in the alpha-synuclein gene identified in families with Parkinson’s disease. Science. 1997;276:2045–2047. doi: 10.1126/science.276.5321.2045. [DOI] [PubMed] [Google Scholar]
- 3.Krüger R, et al. Ala30Pro mutation in the gene encoding α-synuclein in Parkinson’s disease. Nat Genet. 1998;18:106–108. doi: 10.1038/ng0298-106. [DOI] [PubMed] [Google Scholar]
- 4.Zarranz JJ, et al. The new mutation, E46K, of α-synuclein causes Parkinson and Lewy body dementia. Ann Neurol. 2004;55:164–173. doi: 10.1002/ana.10795. [DOI] [PubMed] [Google Scholar]
- 5.Singleton AB, et al. alpha-Synuclein locus triplication causes Parkinson’s disease. Science. 2003;302:841. doi: 10.1126/science.1090278. [DOI] [PubMed] [Google Scholar]
- 6.Chartier-Harlin M-C, et al. α-synuclein locus duplication as a cause of familial Parkinson’s disease. Lancet. 2004;364:1167–1169. doi: 10.1016/S0140-6736(04)17103-1. [DOI] [PubMed] [Google Scholar]
- 7.Visanji NP, et al. α-Synuclein-based animal models of Parkinson’s disease: Challenges and opportunities in a new era. Trends Neurosci. 2016;39:750–762. doi: 10.1016/j.tins.2016.09.003. [DOI] [PubMed] [Google Scholar]
- 8.Volpicelli-Daley LA, Kirik D, Stoyka LE, Standaert DG, Harms AS. How can rAAV-α-synuclein and the fibril α-synuclein models advance our understanding of Parkinson’s disease? J Neurochem. 2016;139:131–155. doi: 10.1111/jnc.13627. [DOI] [PMC free article] [PubMed] [Google Scholar]
- 9.Decressac M, Mattsson B, Lundblad M, Weikop P, Björklund A. Progressive neurodegenerative and behavioural changes induced by AAV-mediated overexpression of α-synuclein in midbrain dopamine neurons. Neurobiol Dis. 2012;45:939–953. doi: 10.1016/j.nbd.2011.12.013. [DOI] [PubMed] [Google Scholar]
- 10.Theodore S, Cao S, McLean PJ, Standaert DG. Targeted overexpression of human α-synuclein triggers microglial activation and an adaptive immune response in a mouse model of Parkinson disease. J Neuropathol Exp Neurol. 2008;67:1149–1158. doi: 10.1097/NEN.0b013e31818e5e99. [DOI] [PMC free article] [PubMed] [Google Scholar]
- 11.Chung CY, Koprich JB, Siddiqi H, Isacson O. Dynamic changes in presynaptic and axonal transport proteins combined with striatal neuroinflammation precede dopaminergic neuronal loss in a rat model of AAV α-synucleinopathy. J Neurosci. 2009;29:3365–3373. doi: 10.1523/JNEUROSCI.5427-08.2009. [DOI] [PMC free article] [PubMed] [Google Scholar]
- 12.Sanchez-Guajardo V, Febbraro F, Kirik D, Romero-Ramos M. Microglia acquire distinct activation profiles depending on the degree of α-synuclein neuropathology in a rAAV based model of Parkinson’s disease. PLoS One. 2010;5:e8784. doi: 10.1371/journal.pone.0008784. [DOI] [PMC free article] [PubMed] [Google Scholar]
- 13.Luk KC, et al. Pathological α-synuclein transmission initiates Parkinson-like neurodegeneration in nontransgenic mice. Science. 2012;338:949–953. doi: 10.1126/science.1227157. [DOI] [PMC free article] [PubMed] [Google Scholar]
- 14.Luk KC, et al. Intracerebral inoculation of pathological α-synuclein initiates a rapidly progressive neurodegenerative α-synucleinopathy in mice. J Exp Med. 2012;209:975–986. doi: 10.1084/jem.20112457. [DOI] [PMC free article] [PubMed] [Google Scholar]
- 15.Volpicelli-Daley LA, et al. Exogenous α-synuclein fibrils induce Lewy body pathology leading to synaptic dysfunction and neuron death. Neuron. 2011;72:57–71. doi: 10.1016/j.neuron.2011.08.033. [DOI] [PMC free article] [PubMed] [Google Scholar]
- 16.Volpicelli-Daley LA, Luk KC, Lee VM-Y. Addition of exogenous α-synuclein preformed fibrils to primary neuronal cultures to seed recruitment of endogenous α-synuclein to Lewy body and Lewy neurite-like aggregates. Nat Protoc. 2014;9:2135–2146. doi: 10.1038/nprot.2014.143. [DOI] [PMC free article] [PubMed] [Google Scholar]
- 17.Paumier KL, et al. Intrastriatal injection of pre-formed mouse α-synuclein fibrils into rats triggers α-synuclein pathology and bilateral nigrostriatal degeneration. Neurobiol Dis. 2015;82:185–199. doi: 10.1016/j.nbd.2015.06.003. [DOI] [PMC free article] [PubMed] [Google Scholar]
- 18.Peelaerts W, et al. α-Synuclein strains cause distinct synucleinopathies after local and systemic administration. Nature. 2015;522:340–344. doi: 10.1038/nature14547. [DOI] [PubMed] [Google Scholar]
- 19.Luk KC, et al. Molecular and biological compatibility with host alpha-synuclein influences fibril pathogenicity. Cell Rep. 2016;16:3373–3387. doi: 10.1016/j.celrep.2016.08.053. [DOI] [PMC free article] [PubMed] [Google Scholar]
- 20.Brochard V, et al. Infiltration of CD4+ lymphocytes into the brain contributes to neurodegeneration in a mouse model of Parkinson disease. J Clin Invest. 2009;119:182–192. doi: 10.1172/JCI36470. [DOI] [PMC free article] [PubMed] [Google Scholar]
- 21.Rey NL, et al. Widespread transneuronal propagation of α-synucleinopathy triggered in olfactory bulb mimics prodromal Parkinson’s disease. J Exp Med. 2016;213:1759–1778. doi: 10.1084/jem.20160368. [DOI] [PMC free article] [PubMed] [Google Scholar]
- 22.Dehay B, et al. Targeting α-synuclein: Therapeutic options. Mov Disord. 2016;31:882–888. doi: 10.1002/mds.26568. [DOI] [PubMed] [Google Scholar]
- 23.Lu L, et al. Gene expression profiling of Lewy body-bearing neurons in Parkinson’s disease. Exp Neurol. 2005;195:27–39. doi: 10.1016/j.expneurol.2005.04.011. [DOI] [PubMed] [Google Scholar]
- 24.Greffard S, et al. A stable proportion of Lewy body bearing neurons in the substantia nigra suggests a model in which the Lewy body causes neuronal death. Neurobiol Aging. 2010;31:99–103. doi: 10.1016/j.neurobiolaging.2008.03.015. [DOI] [PubMed] [Google Scholar]
- 25.Osterberg VR, et al. Progressive aggregation of alpha-synuclein and selective degeneration of lewy inclusion-bearing neurons in a mouse model of parkinsonism. Cell Rep. 2015;10:1252–1260. doi: 10.1016/j.celrep.2015.01.060. [DOI] [PMC free article] [PubMed] [Google Scholar]
- 26.Conway KA, Rochet JC, Bieganski RM, Lansbury PT., Jr Kinetic stabilization of the α-synuclein protofibril by a dopamine-α-synuclein adduct. Science. 2001;294:1346–1349. doi: 10.1126/science.1063522. [DOI] [PubMed] [Google Scholar]
- 27.Cappai R, et al. Dopamine promotes alpha-synuclein aggregation into SDS-resistant soluble oligomers via a distinct folding pathway. FASEB J. 2005;19:1377–1379. doi: 10.1096/fj.04-3437fje. [DOI] [PubMed] [Google Scholar]
- 28.Zhang W, et al. Aggregated alpha-synuclein activates microglia: A process leading to disease progression in Parkinson’s disease. FASEB J. 2005;19:533–542. doi: 10.1096/fj.04-2751com. [DOI] [PubMed] [Google Scholar]
- 29.Lee H-J, et al. Dopamine promotes formation and secretion of non-fibrillar alpha-synuclein oligomers. Exp Mol Med. 2011;43:216–222. doi: 10.3858/emm.2011.43.4.026. [DOI] [PMC free article] [PubMed] [Google Scholar]
- 30.McGeer PL, Itagaki S, Akiyama H, McGeer EG. Rate of cell death in parkinsonism indicates active neuropathological process. Ann Neurol. 1988;24:574–576. doi: 10.1002/ana.410240415. [DOI] [PubMed] [Google Scholar]
- 31.Harms AS, et al. MHCII is required for α-synuclein-induced activation of microglia, CD4 T cell proliferation, and dopaminergic neurodegeneration. J Neurosci. 2013;33:9592–9600. doi: 10.1523/JNEUROSCI.5610-12.2013. [DOI] [PMC free article] [PubMed] [Google Scholar]
- 32.Kim C, et al. Neuron-released oligomeric α-synuclein is an endogenous agonist of TLR2 for paracrine activation of microglia. Nat Commun. 2013;4:1562. doi: 10.1038/ncomms2534. [DOI] [PMC free article] [PubMed] [Google Scholar]
- 33.Qin H, et al. Inhibition of the JAK/STAT pathway protects against α-synuclein-induced neuroinflammation and dopaminergic neurodegeneration. J Neurosci. 2016;36:5144–5159. doi: 10.1523/JNEUROSCI.4658-15.2016. [DOI] [PMC free article] [PubMed] [Google Scholar]
- 34.Cao S, Standaert DG, Harms AS. The gamma chain subunit of Fc receptors is required for alpha-synuclein-induced pro-inflammatory signaling in microglia. J Neuroinflammation. 2012;9:259. doi: 10.1186/1742-2094-9-259. [DOI] [PMC free article] [PubMed] [Google Scholar]
- 35.Lee H-J, Bae E-J, Lee S-J. Extracellular α-synuclein–A novel and crucial factor in Lewy body diseases. Nat Rev Neurol. 2014;10:92–98. doi: 10.1038/nrneurol.2013.275. [DOI] [PubMed] [Google Scholar]
- 36.Decressac M, et al. GDNF fails to exert neuroprotection in a rat α-synuclein model of Parkinson’s disease. Brain. 2011;134:2302–2311. doi: 10.1093/brain/awr149. [DOI] [PubMed] [Google Scholar]
- 37.Wan OW, et al. α-Synuclein induced toxicity in brain stem serotonin neurons mediated by an AAV vector driven by the tryptophan hydroxylase promoter. Sci Rep. 2016;6:26285. doi: 10.1038/srep26285. [DOI] [PMC free article] [PubMed] [Google Scholar]
- 38.Hoffman AF, Gerhardt GA. In vivo electrochemical studies of dopamine clearance in the rat substantia nigra: Effects of locally applied uptake inhibitors and unilateral 6-hydroxydopamine lesions. J Neurochem. 1998;70:179–189. doi: 10.1046/j.1471-4159.1998.70010179.x. [DOI] [PubMed] [Google Scholar]
- 39.Mouton PR, Gokhale AM, Ward NL, West MJ. Stereological length estimation using spherical probes. J Microsc. 2002;206:54–64. doi: 10.1046/j.1365-2818.2002.01006.x. [DOI] [PubMed] [Google Scholar]
- 40.Lundblad M, Decressac M, Mattsson B, Björklund A. Impaired neurotransmission caused by overexpression of α-synuclein in nigral dopamine neurons. Proc Natl Acad Sci USA. 2012;109:3213–3219. doi: 10.1073/pnas.1200575109. [DOI] [PMC free article] [PubMed] [Google Scholar]
- 41.Paxinos G, Watson C. The Rat Brain in Stereotaxic Coordinates. Academic; San Diego: 1986. [DOI] [PubMed] [Google Scholar]


