Significance
Myosin motors can convert chemical energy to motion. Myosin V is a processive motor that walks on actin filaments in one direction without detaching for a few dozen steps. Here we explore the nature of the directionality—namely, what is the microscopic mechanism that ensures the two myosin motor heads will coordinate to achieve unidirectional motion. With the help of Langevin Dynamics (LD) simulations, Monte Carlo (MC) simulations, and a technique we term SLiK (Segmental LD integrated Kinetics), we solve the kinetic equation and reach the conclusion that directionality is gained through selective ADP release. We find that ADP release has a higher barrier when the motor head is in the lever-up state (pre-power stroke) and support this through structure-based energy calculations.
Keywords: energy transduction, power stroke, molecular motor
Abstract
The nature of the conversion of chemical energy to directional motion in myosin V is examined by careful simulations that include two complementary methods: direct Langevin Dynamics (LD) simulations with a scaled-down potential that provided a detailed time-resolved mechanism, and kinetic equations solution for the ensemble long-time propagation (based on information collected for segments of the landscape using LD simulations and experimental information). It is found that the directionality is due to the rate-limiting ADP release step rather than the potential energy of the lever arm angle. We show that the energy of the power stroke and the barriers involved in it are of minor consequence to the selectivity of forward over backward steps and instead suggest that the selective release of ADP from a postrigor myosin motor head promotes highly selective and processive myosin V. Our model is supported by different computational methods—LD simulations, Monte Carlo simulations, and kinetic equations solution—as well as by structure-based binding energy calculations.
Myosin constitutes a superfamily of motor proteins that interact with actin and perform directional movement by consuming ATP. The general architecture of the myosin is one or two motor head domains, with ATPase activity and an actin binding interface, a lever arm extending from the motor head, a joint (if two heads are present), and a cargo binding site. Myosin motors produce force that either moves actin filaments (a hallmark in muscle contraction) or moves themselves along actin filaments [such as translocation of cargos inside cells (1)]. The latter case is often referred to as processive motors.
Myosin V is such a processive motor, which means that it performs multiple cycles of its “reaction” before disengaging from its “substrate”—more specifically, each myosin V motor performs multiple steps [few dozen (2, 3)] before unbinding actin completely. For processivity to be high, the myosin heads need to spend most of their cycle bound to actin (4).
On top of being processive, myosin V is also selective, meaning it performs most of its steps in one direction (the barbed or plus-end; ref. 5). The coupling between the two independent motor heads is termed “gating,” and its existence might not be mandatory for a motor to function, but it likely achieves higher efficiency and directional processivity (6).
Detailed understanding of the action and motion of myosin V is a challenge of major importance. Myosin V advances in hand-over-hand steps (7) with a step size of ∼36 nm (8). This protein has been shown to perform an action termed “stomping,” where a motor head detaches from actin and then rebinds to the same actin binding site (or very close to it) (9), reportedly when still bound to ADP.
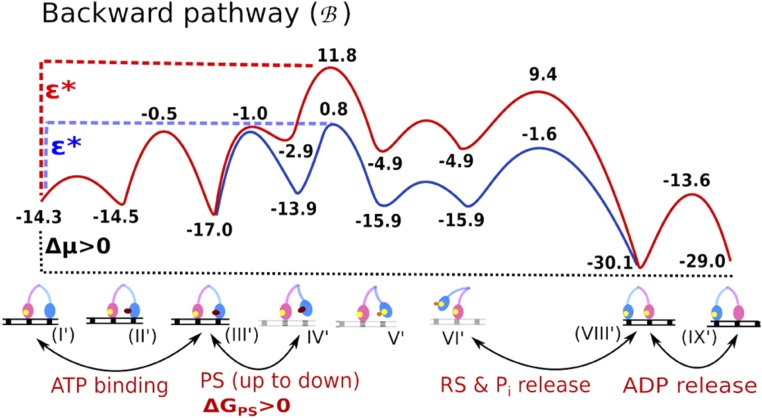
One of the main open problems is understanding how the microscopic energy landscape dictates the direction of movement (for review, see ref. 10). Our previous study of this key unresolved issue suggested that the directionality is due to the angular energy of the lever (11, 12) as well as the coupling of the lever angle with the chemical energy and possibly the asymmetry in the ADP release barrier (12). This proposal that focused on the angular energy involves a possible high-energy backward barrier (Fig. S1, red path), but it also considered the possibility that such a path is not the least energy path for the back movement (Fig. S1, blue path). In contrast, one of the more popular working hypotheses for myosin directionality is a strain-activated power stroke, where the ATP hydrolysis energy (specifically the Pi release energy) is converted to conformational strain energy that is released by lashing the entire myosin forward (via the lever angle; e.g., ref. 4). Related ideas for other systems have also been proposed (13, 14). We note that this model essentially translates to an exergonic power stroke (ΔG < 0; more on this below), which can be reversible or irreversible (inertial model).
Fig. S1.
The backward pathways of myosin V. ΔGPS is the free-energy difference of the lever-up to lever-down conformational change known as the power stroke. Note that in contrast to Figs. 1 and 4 the ADP release in this figure is at the end of the cycle. Adapted from ref. 11.
Our previous studies of the origin of the directionality included Langevin Dynamics (LD) simulations with a very minimalistic model and Monte Carlo (MC) simulations with a more complete but still tentative model (12). These studies reached the conclusion that the power stroke is not dictating the directionality but remained inconclusive with regards to the role of the angular potential in dictating the directionality. In this work, we tried to gain a more concrete insight on the origin of the directionality and the actual least energy paths by much more detailed LD simulations with a coarse-grained (CG) model. The LD–CG simulations provided crucial information on the behavior of the system on a molecular level and allowed us to judge what is the most probable order of events and what is the least energy path in the multicoordinate system. Note in this respect that multiscale CG models can effectively describe the physics of diverse biological systems (e.g., refs. 15–17). Our improved model allowed us to efficiently explore different scenarios and narrow down to the most probable explanation (in energy terms) for effective directional and processive motion. We critically tried all of the previously suggested scenarios, including the red and blue paths (12) as well as conformational strain and kinetics-driven power stroke schemes, and considered the energetics and resulting motion for myosin. For simplicity, our model did not focus on stomping, and we did not investigate it. Also, we did not consider the spatial biased diffusion, addressed by Andrecka et al. (18).
Since the LD simulations involved a high computational cost (particularly in cases with high barriers), we also used our so-called Segmental LD integrated Kinetics (abbreviated SLiK) method, where we obtained parameters for a kinetic equation analysis from LD simulations. The SLiK yielded much longer simulations and corroborated the conclusions from the direct LD simulations.
Overall, verifying different scenarios in a nonbiased way led us to the conclusion that the gating can arise from two sources, considering what is known about myosin: (i) If the stepping rate (i.e., unbinding of the motor head from actin, diffusion of the motor head to the next actin site, hydrolysis of ATP, and rebinding of the motor head) is comparable to the putative rate-determining step, the ADP release, then differences in barriers for the back and front movements can dictate directionality; however, this selectivity gate is not very sensitive, and processivity is not guaranteed. (ii) Selective release of ADP, meaning that ADP release is more favorable at the trailing head (probably due to the different conformation of the head at different lever angles). This possibility proved to be very efficient and mechanistically appeared to be more reasonable.
Materials and Methods
Our strategy is based on a free-energy landscape that attempts to capture the physics of the system under study. With the free-energy landscape at hand, we can simulate the time-dependent propagation of the system and observe the overall kinetics.
LD Simulations.
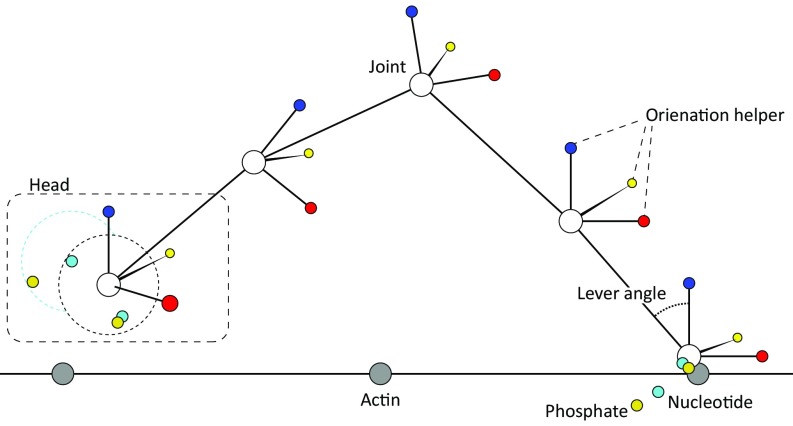
The landscape used for the LD simulation is a CG model of myosin V. This model simplified the system to rigid body beads, each one composed of four particles: one particle to represent the position of the bead and three helper particles (kept at 90° angles) to represent the orientation of the bead. These beads therefore represent a CG body with explicit translation and rotation. Our analyses were performed using 15 such beads (one for each motor head, one for the joint, and one for each of the six IQ domains in each lever arm). We use standard harmonic potentials for 2-particle bonds (between beads and between the bead’s position particle and the helper particles), 3-particle angles, and 4-particles torsions (because the particles represent protein domains, the torsion should not be periodic). We introduce a reflective boundary (using half of a parabola for the energy function) to prevent particle overlapping, when they were within a certain threshold. Each motor head had two nucleotide particles associated with it, and each nucleotide particle had a phosphate particle associated with it. These were single-point particles (we neglected orientation to save computer time) and had a reflective boundary so they could not escape the system. Additionally, we introduced rejection between the two nucleotide particles so they do not bind simultaneously. An illustration of the system is depicted in Fig. S2.
Fig. S2.
An illustration of the LD system. White, gray, red, yellow, blue, cyan, and gold spheres represent myosin, actin, x-helper, y-helper, z-helper, nucleotide, and phosphate particles, respectively. The dashed square shows one motor head unit, the dashed circles represent the reflective boundary for nucleotides and phosphate particles, the solid lines represent bonds, and the lever angle is shown (note that it appears as an angle on the 2D illustration but is computed as a dihedral in the simulations). Only five beads are shown for simplicity. The figure is not to scale.
When head beads attempted to bind the actin (represented by a string of immobile 36 nm-apart points, parallel to the x axis), the potential energy between the myosin head and the actin binding site resulted in rejection if the binding is not at the correct orientation (set to align with x–y–z-axes). This mimicked the fact that myosin binds actin with a specific anisotropic interface.
Due to the down-scaling of the energy (see below), the ADP release occurred often during the stepping process, potentially resulting in detachment of the myosin from the actin. We therefore used two strategies to minimize this premature end of the motion: (i) We tested a limitation where nucleotide binding and unbinding can only happen when both motor heads are bound to actin. The decoupling of nucleotide binding/unbinding from the stepping part is somewhat justified since the ADP release step (in the unscaled landscape) is much slower than the stepping part. Indeed, when comparing simulations that ran to completion with and without this limitation, we found no noticeable difference. We will refer to this strategy as “symmetrical conditions” below. (ii) We used lever angle-dependent ADP-release barriers (see below). Few simulations still ended prematurely, but this is physiologically expected, as processivity of myosin is finite (typically a few dozen steps; Movie S1).
We performed two types of time-dependent simulations. The first was a regular LD approach, and the second was an updated version we term SLiK, which has been aimed at overcoming problems with long-time LD simulations (more on this below). All LD-related simulations were performed using the overdamped regime.
Our regular LD approach used the equation:
| [1] |
where Mi and Xi are the mass and coordinate of the ith particle, U(X) is the potential, γ is the friction, kB is the Boltzmann constant, and Ri(t) is a random force that satisfies the fluctuation dissipation theorem—that is, a Gaussian process with zero mean that fulfills:
| [2] |
In our study, we used γ = 10 ps−1 and mass of 5 amu for each particle (so 20 per bead), 3 amu per nucleotide or phosphate particle, and 200 amu for the joint bead, emulating the cargo. We ran 1010 steps per simulation, with 16–48 repeats for each system at 300 K. Our step size was 2.5 fs. We performed simulations using a shorter step size of 1 fs and saw no difference in the results, and we also tried increasing the masses or friction but did not observe any qualitative difference; however, quantitatively, the progress of myosin in those simulations was slower.
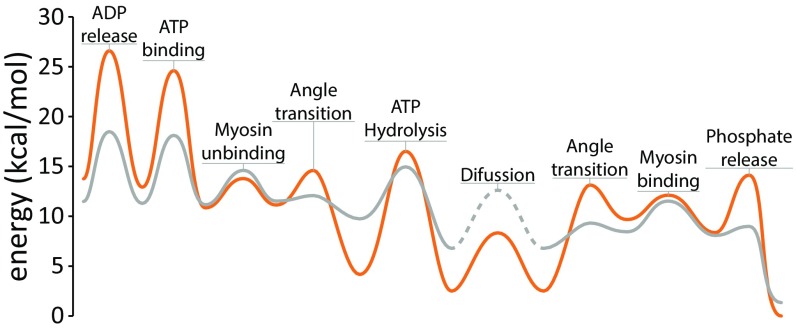
The original input potential was aimed at reproducing the energy landscape shown in Fig. 1, but computer time limitations forced us to scale the energies down, while maintaining most differences in energies between the states and the differences between barrier heights (Fig. 1 for specifics). This treatment allowed the simulations to run faster but maintain the rate ratios and the equilibrium ratios as close to the real energies as possible. To consider the effect of entropy and our system constraints, we performed long simulations, focusing on one coordinate at a time, and constructed free-energy curves based on the coordinate distribution in the simulation (in all cases, we verified that equilibrium was reached). The resulting free-energy landscape is compared with the unscaled energy in Fig. 1, and with the input potential in Fig. S3.
Fig. 1.
The free-energy landscape for one myosin step (the least energy path is drawn in one dimension for simplicity). The unscaled energy is in orange, and the scaled energy (used in the LD simulations) is in gray. The diffusion segment cannot be explicitly scaled and appears as a dashed line. Note that the landscape was rendered as Bézier curves for visual appeal but shows the correct magnitudes (refer to Fig. S3 for the raw profiles).
Fig. S3.
Comparison of the potential used in LD system with the corresponding free energy (based on probabilities in equilibrated simulations). Each coordinate was run independently (n = 16). The potential is shown in blue. The significant difference between the Myosin–actin potential and distribution is a result of the large space available for a free motor head and the entropy involved.
The second strategy, which was termed SLiK, recognized two sorts of time-limited processes (“reactions”): diffusion-limited and thermal activation-limited. The former included processes whose time dependence was due to random walk, such as a free motor head randomly diffusing until it was close enough to an actin binding site to attempt binding. The latter included all chemical and physical reactions that need to overcome an energy barrier and thus require enough thermal energy to occur—for example, hydrolysis of ATP. In LD simulations, the ability to overcome a high-energy barrier was quite limited in terms of computer resources, and therefore, we scaled down the energies in our simulations. The main idea with SLiK was to obtain the average first passage time for each segment with LD and then to use these rates in a kinetic equation for long time scales.
This approach started with charting the landscape by running LD simulations, while scaling down the barriers of the systems, as explained above. We then examined whether the time of crossing each segment was slowed down upon increasing the barriers in the entire potential or whether the crossing time was not so sensitive to the magnitude of the potential barriers. The corresponding segments were then divided to barrier-controlled (thermal energy; the former) and diffusion-controlled (the latter).
For the regions that were identified as being controlled by barriers, we computed the average first passage time from the LD simulations, τ, and estimate the corresponding barrier by interpolating Δg‡ according to transition state theory as:
| [3] |
For the thermal-limited barriers, we used the unscaled barrier taken from the literature.
Once we determined the time and rate constant for passing different regions, we could solve the overall kinetic by setting the relevant kinetic equation (not much different from Markov chain treatments) for the main process and then solving the time-dependent problem. In this study, we used the program Kinetiscope (www.hinsberg.net/kinetiscope/) to solve the kinetic equation using stochastic kinetics (19, 20).
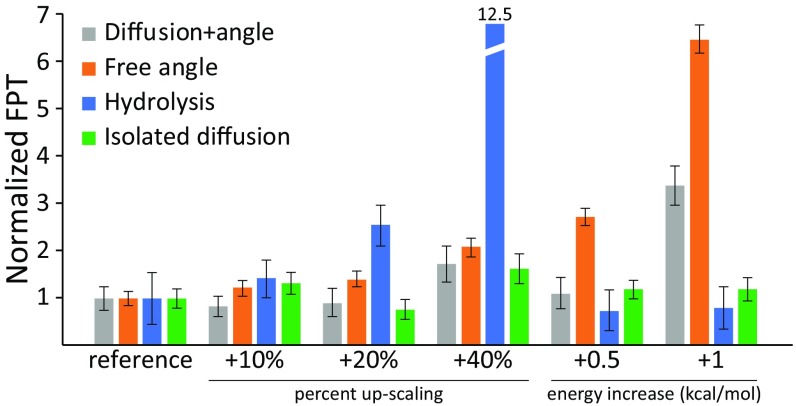
An example of our segmentation procedure is provided in Fig. 2. In the figure, we show the average first passage time (n = 17) of three coordinates: (i) the lever angle transition for the bound head, which entails diffusion of the cargo; (ii) the lever angle transition for the unbound head; and (iii) the ATP hydrolysis. It is apparent from the figure that the diffusion step’s first passage time does not rely heavily on the energy landscape, compared with the thermal barriers (whether we scale linearly or by adding a fixed number to all of the barriers). This highlights that the stepping part is dominantly diffusive and when separated from the lever angle (Fig. 2, green bars) is unaffected by the energy’s scaling. Thus, we can continue with our SLiK method using a single diffusive segment, with a Δg‡ as calculated above.
Fig. 2.
Average first passage times (FPT) for the lever angle transition of a bound head (gray; entailing diffusion) for a free head (orange), and for hydrolysis (blue) are shown for different energy scaling. Error bars express the SEM (n > 11). “Reference” is the scaled landscape from Fig. 1. A potential where the lever angle potential is flat is shown in green to present isolated diffusion.
PDLD Binding Calculations.
Binding energy calculations were done using the scaled semimacroscopic Protein Dipoles Langevin Dipoles (PDLD/S) approach of MOLARIS (21, 22). We averaged the energies of the charged and uncharged states, following the linear response approximation (LRA), scaled using a dielectric constant εp = 8. Statistical significance is achieved by running molecular dynamics (MD) simulations and averaging results from different conformations [PDLD/S-LRA (23)].
Results and Discussion
LD Simulations.
We started the simulation study by exploring the original idea in refs. 11 and 12 that the directionality is due to having an endergonic potential (ΔG > 0) for the lever angle transition and a uniform barrier for ADP release (i.e., same barrier regardless of the myosin head state).
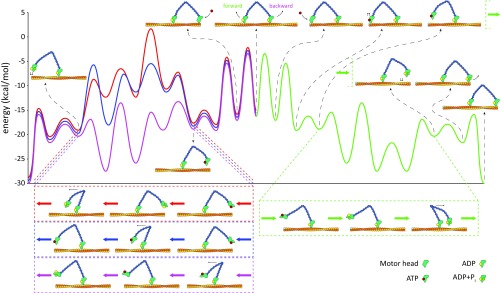
Our LD simulations show that under a potential with an endergonic power stroke, the myosin complex moves both forward and backward, with some bias to the backward movement. To explore this finding, we performed simulations where all parameters except for the lever angle potential are symmetrical. It was found that the energy landscape of the lever angle promotes forward movement if the lever-down position is lower in energy and backward movement if the lever-up position is lower in energy, and no preference if ΔG = 0 (Fig. 3A). These results are in contrast to our previous results (11) and indicate that the LD does not move in the path with the high backward barrier (Fig. S1) and that it finds a way to avoid the corresponding barrier (Fig. 4, red and blue). It appears that the backward-stepping high-barrier path assumed in our previous study is not the path that myosin chooses in our LD simulations. We examined the simulations and found that myosin instead first goes down in energy to the lowest state (in this landscape, both heads are level-up) and then performs the high-energy ATP hydrolysis step. Up to this point, forward or backward stepping would have identical energy landscapes. Then, it goes up in energy, when the required lever changes to high-energy lever-down, so that the barrier with this rearrangement is identical to the barrier of the forward movement (Fig. 4, magenta and green). Note that if the power stroke was exergonic, we would get the same behavior, while exchanging the backward and forward steps.
Fig. 3.
Mean position of myosin joint as a function of time. (A) Representative simulations from the symmetrical strategy, with a ΔG = 0 power stroke. (B) Representative simulations from runs where ADP release is easier when the lever angle is lever-down. (C) A representative simulation from B showing the joint bead position in black and the two motor heads in red and green; notice the hand-over-hand dynamics. Position is given with respect to the actin axis.
Fig. 4.
Free-energy landscape for myosin stepping. The landscape for a forward step (with an endergonic power stroke) is shown in green, with the corresponding steps in the illustration at the bottom. The high-energy backward steps are shown in red and blue (Fig. S1). The path in magenta presents the actual path we observe in the LD simulations (and infer from the kinetic equations).
Apparently, when the lever-up angle is lower in energy, the lever samples the lever-up position more, and this results in increased probability for the detached motor head meeting and binding to the next actin particle, compared with binding to the previous actin particle. Although energetically the two heads should maintain opposite angles when the myosin binds with both heads (assuming the levers are rigid, as shown by refs. 24–26), our simulations found that it is easier for the free head to go up in energy and bind the actin than for the bound head to go up in energy, when all of the rest of the myosin is diffusing in the medium around it. It is possible that this is a consequence of our scaled potential, but it is likely that this is to some extent true, because when a free motor head comes near the actin binding site, some induced fit occurs to allow binding (since binding lowers the energy of the system).
The results obtained with the scaled-down energies show that the lever-angle energy alone cannot explain the observed forward motion. Nonetheless, to get a full picture, we must consider more realistic scaling of the energy barriers. That is, whereas the above scaling was done proportionally (from a Boltzmann distribution standpoint; Fig. 1), one factor—namely, the diffusion—cannot be scaled down (Fig. 2). The corresponding examination of the kinetic with realistic barriers will be reported below.
One more interesting observation that we made is related to the amplitude of the lever angle. The structures available show an absolute value lever-down angle that is larger than the lever-up angle (with respect to the vector perpendicular to the actin). In simple words, the lever arm bends more forward than it does backward. If we consider that myosin needs to bind in specific positions on the actin, it is possible that when trying to step backward the myosin head requires more strain to “reach” the site. Energetically, this translates to a higher energy barrier when trying to walk backward (and appears like the kinetic power stroke idea, albeit fully reversible). Once we introduced this asymmetry in the myosin lever angles, we observed a significant bias toward forward stepping, but the magnitude of the said barrier should be considered carefully. Such considerations are provided below with our kinetic analysis.
SLiK Treatment.
Regardless of the difficulties of blocking the back motion by the angular potential, we note that with other rate-determining barriers it might not matter too much what the angular potential is. To explore this issue, we turned to the SLiK kinetic equation simulation.
To implement our SLiK method, we conducted extensive LD simulations using different energy-scaling schemes. Qualitatively all simulations, regardless of scaling, produced the same behavior and the same time evolution. As expected though, the rate of the myosin movement decreases as the energy barriers increase. Counting the individual rates (specifically, the average first passage time), it was found that the segment of the power stroke (the swinging of myosin where the bound head moves from lever-up to lever-down) is dominantly diffusive (Fig. 2, gray bars). Note that in an unscaled scenario, the lever angle’s energy might become dominant over the diffusion and therefore separate these two steps into a swinging step that is purely diffusive (Fig. 2, green bars), with a rate of about 7 × 10⁶ s−1 and a lever-angle step that is thermally controlled.
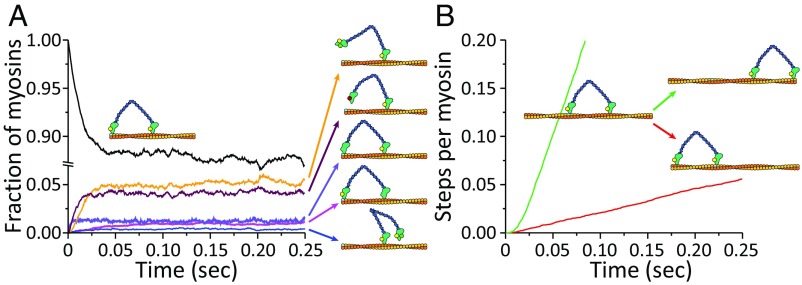
This SLiK kinetic treatment yielded the results shown in Figs. 5 and 6. Using the unscaled energy landscape (where the ADP release is the same in both motor heads), it was found that the system quickly reaches steady state and the fractions of myosin states do not change, and only stepping events accumulate (for simplicity, we count the number of steps performed overall). Looking at the fractions, it is very clear that the system spends the vast majority of time in the ADP–ADP state (i.e., both motor heads are bound to actin and to ADP), highlighting the role of the ADP release as the rate-limiting step. Then, we see that ATP hydrolysis and the power stroke are more or less equal in rate (based on the intermediates) but much faster than the ADP release. The result of these rates is equal to the rate of forward and backward steps, as is evident in Fig. 5B. Changing the energy of the power stroke, by making it exergonic or endergonic, makes no difference in the resulting stepping ratio, as this step is not rate-limiting anyway.
Fig. 5.
Results of the kinetic equation with the unscaled potential. (A) The system starts with all particles bound to two ADP nucleotides as indicated by the illustration. The concentration of intermediates that are not negligible is shown with illustrations on the right. (B) The green and red lines are the accumulated number of steps performed by the entire population of myosin particles. The system in this figure is a myosin that can release ADP from both heads, with an exergonic power stroke. Notice the broken scale on the ordinate.
Fig. 6.
Same as Fig. 5, but with a system that releases ADP more easily from the trailing head (lever-down; see SLiK Treatment) and an exergonic power stroke. (A) Myosin states. (B) Accumulated steps.
This observation can be illustrated if we begin at the ADP–ADP state, which is the lowest in energy. Whichever ADP releases first, this motor head will be able to attempt a step or end up stomping (or rebind ADP, but this is a rare event). If the trailing ADP leaves first (assuming at this point 50% chance), then a forward step is possible, and if it is the leading ADP, a backward step is possible. Now the ADP release step is slow enough to make the power stroke inconsequential in equilibrium; nonetheless, it is worthwhile considering a scenario where the specific energetics of the power stroke when walking backward is comparable to the ADP release barrier (making forward steps faster than backward steps). In this case, we indeed see a preference to walking forward, but we note that the system spends a lot of time waiting for a backward step attempt to complete. Unfortunately, in this scenario the system is highly inefficient, as it is wasting a lot of time on useless binding and unbinding of ADP or, worse, wasting a lot of time on actually walking backward, which is counterproductive and spends ATP. Furthermore, the system spends a lot of time (at 50% chance and even more than 50% of the time) waiting in a state that allows unbinding of the other ADP, which could result in falling of the myosin altogether from actin.
With the above analysis in mind, we reach our principle hypothesis: The selectivity must be achieved by asymmetry in the ADP-release step, probably by the coupling to the lever angle. If the chances to initiate a step are skewed to one direction, then the entire system will perform more steps in that direction. As seen in Fig. 6, this strategy is easy to implement, since the two myosin heads are found at different conformations at nearly all times (assuming rigid levers, see refs. 24–26). If the ADP release would be even slightly more difficult when the myosin head is found at the lever-up angle, then directionality is achieved, and this also allows processivity (Fig. 6). Gating through differential ADP release rates is supported by other studies as well (6, 27–31).
MC Simulations.
To provide qualitative support to the SLiK results, we also ran MC simulations that led to comparable results. The MC simulations are summarized in Supporting Information.
Exploring the Structural Basis for Directionality.
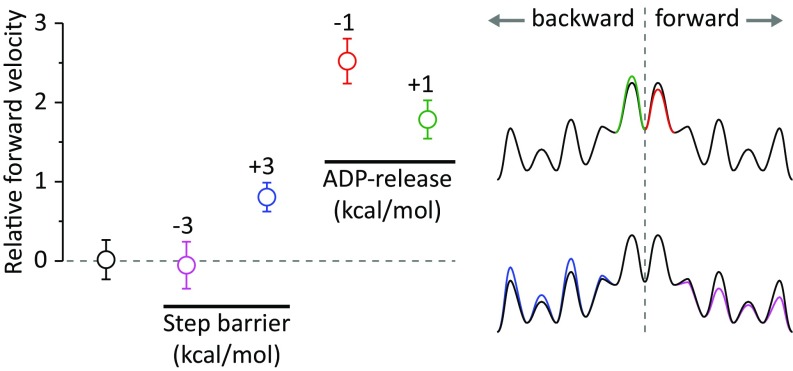
Exploring the origin for the directionality, we found in the LD simulations, in the simplified MC simulations, and in the kinetic equations (Figs. 3 and 6 and Fig. S4) a significant and strong bias to forward stepping even with a preference of only 1–2 kcal/mol to the ADP release at the lever-down position (trailing head).
Fig. S4.
The relative rate (n = 100) of MC simulations using a scaled potential as a function of the landscape. In magenta and blue, we explore the possibility of higher barriers for the backward step (by decreasing the forward barriers or increasing the backward barriers, respectively), and in red and green, we explore the possibility of higher barriers for the release of ADP from the leading head (by decreasing the trailing leg barrier or by increasing the leading head barrier, respectively). We present relative rates because the absolute rates depend on the scaling and simulation length. The magnitude of the difference in the barriers was chosen to emphasize the larger effect of the ADP-release selectivity, and the landscapes on the right are simplified for easy visualization.
Thus, we tried to find a structural support to our hypothesis with calculations that used myosin high-resolution structures. As a start, we noted that a visual inspection of the structures hints that the lever-up conformation (mostly postrigor) has an obstructed path for the ADP release compared to that with the lever-down conformation (mostly pre-power stroke).
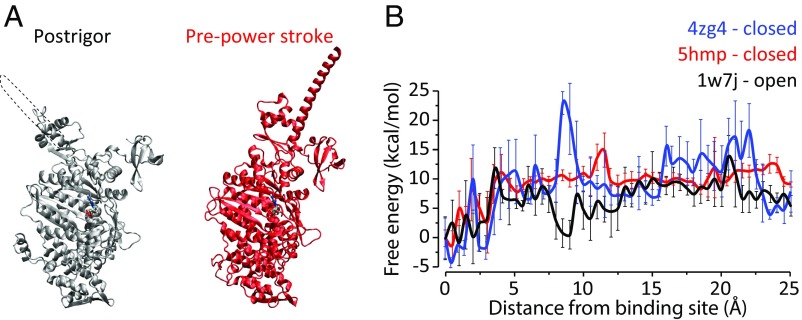
To obtain semiquantitative information, we used our PDLD/S-LRA method, which provided highly informative results in past studies (21, 32), to calculate the difference in the “solvation” energy of the ADP–Mg2+ complex as it moves along a path from the bulk to the binding site (taken from the X-ray structures: 5hmp and 4zg4 for the lever-up myosin Vc and 1w7j for the lever-down myosin V). In other words, we computed the binding energy profile for ADP–Mg2+ as it binds to myosin in three systems: two lever-up conformations and one lever-down conformation. Although the specific path and the orientation of the nucleotide upon unbinding are not experimentally known, we allowed some local relaxation of the protein and the nucleotide along the path. The results of the calculations are presented in Fig. 7, where it is apparent that the structures that are lever-up have higher barriers for release of bound ADP than in the structure that is in the rigor state and thus lever-down. We reiterate that our simulations indicate a very low threshold in terms of ΔΔg‡ to achieve directionality. Lastly, the magnitude of the barriers and binding energies in our PDLD curves is reasonable. Note that we used εp = 8 due to the high charge of the phosphate–Mg2+ assembly, which tends to require the use of higher dielectric (21). Our results are in line with the arguments of Coureux et al. (33), where it said that ADP is bound weakly at the rigor state.
Fig. 7.
(A) Postrigor and pre-power stroke structures in ribbon representation. The ADP is shown in licorice, and an extension of the lever arm missing in the structure is shown in a dashed outline. (B) Free energy for binding ADP–Mg to myosin motor heads. The distance shown is for the ring oxygen of the ribose, from the initial structure (pdb after minimization). The curves were vertically translated so that bound ADP is at energy 0. Each point represents the average of 16 runs.
It is worth considering our suggested model under the effect of resistive forces (e.g., pulling with optical tweezers). Since ultimately the directionality is dictated at the ADP release step, which is probably not force-dependent, one should expect directionality to be force invariant. However, there are two things to consider: (i) At some point, the force is so strong that the barrier for the diffusive search will be too high for the forward step (the power stroke). (ii) The force makes the lever-up angle more stable in energy and thus affects the observed ADP release rate (which is dependent on the lever angle). Thus, at weak forces, we do not expect any changes to the model, but as forces become stronger, some of the barriers might become rate-limiting, and myosin cycle might change.
It is also interesting to comment here on a reasonable assumption that the directionality is determined by the downhill free energy of the ATP hydrolysis. However, the free-energy release is identical in both directions. Apparently, the directionality is largely due to the structural (electrostatic) features that lead to asymmetry in the ADP release barrier.
Concluding Remarks
The aim of this work was to explore the origin of the directionality of myosin V and related systems by simulation approaches. Toward this aim, we used CG free-energy surfaces and then specialized simulation approaches to explore the time dependence of the system. Our approaches included propagating LD simulations with scaled surfaces and a hybrid method (termed SLiK) that combines the strength of the explicit LD simulation in determining time scales in confined regions with the robustness and long time scales of kinetic equations. Our work indicated that the angle potential cannot control the directionality, particularly if the power stroke motion is not rate-limiting (which is the situation in our case). We also note that the power stroke idea involves an inertial model which is problematic (Fig. S5). With the ADP release as the rate-limiting step, we find that the directionality is most likely determined at the ADP release step, where ADP is released faster from the trailing head (because it is in the lever-down conformation). This is also consistent with the experimental findings (6, 27, 28, 31). We consistently reached the same conclusions with LD and MC simulations and kinetics equation solution. Finally, we demonstrated using binding energy calculations on myosin structures that ADP indeed shows higher release barriers when it is found in the lever-up angle.
Fig. S5.
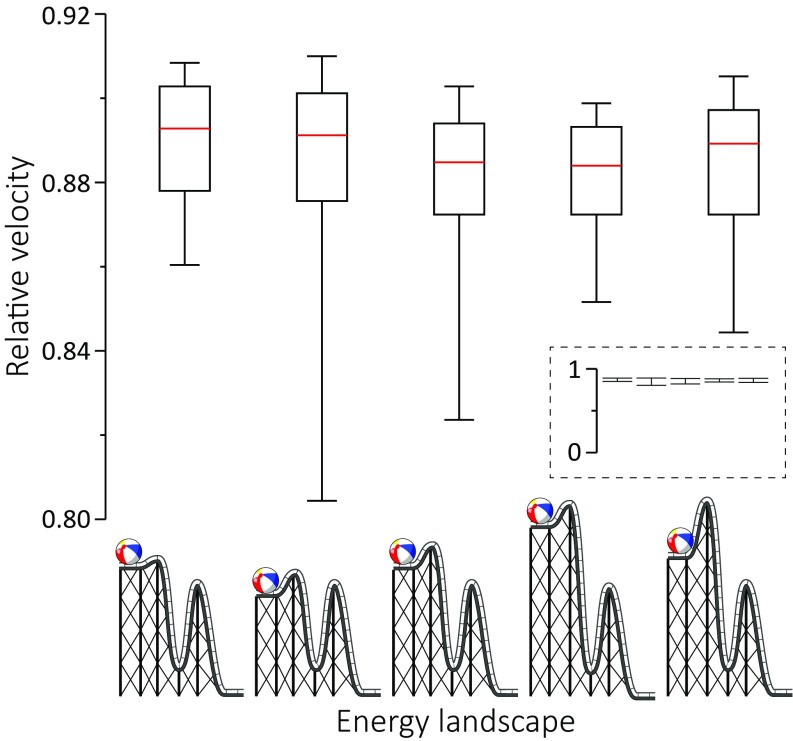
Box plot representations of the relative velocity for simple 2-barrier energy schemes. Velocity is computed by the average number of cycles completed in an MC simulation. A zoom-out of the chart is shown in Inset. At the bottom are illustrations of the energy landscape for each scheme.
This section provides supplementary information for the main text. We start with a description of the previous considerations of the backward path (Fig. S1). The corresponding energies include that of a path (red) where the power stroke is endergonic when going forward, and is thus exergonic when going backward, and that of an alternative path (blue) using the same energies but a different sequence of events. In the red path, the myosin undergoes hydrolysis when it is at the highest state (both angles are down), whereas in the blue path one angle reverts to lever-down but hydrolysis happens only after the energy decreases as the other angle reverts to lever-up.
SI MC Simulations
To provide a qualitative examination of the SLiK results, we conducted long-scale MC simulations of a simplified system, where the barrier for the backward step is indeed higher than the barrier for the forward step. The advantages of MC over LD simulations are as follows: (i) better sampling with medium height barriers and (ii) the simplified system allows more statistically significant sampling. In brief, the system is a linear chain of states, identical to the states presented in Figs. 1 and 4, using scaled-down energies (proportionally), and the propagation between the states is dictated by the Metropolis criterion (34). The chain is circular, and full cycles are counted.
Imposing lower barriers for the forward steps has no effect, but when imposing higher barriers for the backward step, we do see biased forward movement. However, a much bigger effect can be achieved by introducing a much smaller barrier difference in the ADP release step. This follows the trend of our SLiK method presented in the main text, where selectivity at the ADP release lever is more efficient (which probably affects processivity as well). The results are shown in Fig. S4.
In Fig. S5 we address the concept of inertia-driven reactions. It appears to us that some studies attribute a highly exergonic power stroke with the ability to drive forward a process that needs to surpass an energy barrier. This concept, which assumes implicitly an inertial model, does not consider correctly the diffusive physics in proteins, as the release of energy from one process is quickly dissipated and cannot be used to perform work, unless mechanistically coupled (via using a different route that does not actually release the energy). We present simple MC simulations that show that a rate-limited step cannot be affected by a previous step, regardless of how much energy is being released or how fast or slow the previous step is (provided it does not become rate-limiting itself). We wish to compare this to the concept of a strain-loaded myosin whose release could drive directional movement. Recent studies in myosin VI suggest that the lever arm swing is not coupled to the power stroke (35); the same case might be true for myosin V as well.
Supplementary Material
Acknowledgments
We thank Dr. Shayantani Mukherjee for her pivotal contribution to the project and valuable comments in writing this manuscript. We thank the University of Southern California High Performance Computing and Communication Center (HPCC) for computational resources. This work was supported by National Science Foundation Grant MCB-1707167 and National Institute of Health Grant R01-AI055926.
Footnotes
The authors declare no conflict of interest.
This article contains supporting information online at www.pnas.org/lookup/suppl/doi:10.1073/pnas.1711214114/-/DCSupplemental.
References
- 1.Hartman MA, Finan D, Sivaramakrishnan S, Spudich JA. Principles of unconventional myosin function and targeting. Annu Rev Cell Dev Biol. 2011;27:133–155. doi: 10.1146/annurev-cellbio-100809-151502. [DOI] [PMC free article] [PubMed] [Google Scholar]
- 2.Baker JE, et al. Myosin V processivity: Multiple kinetic pathways for head-to-head coordination. Proc Natl Acad Sci USA. 2004;101:5542–5546. doi: 10.1073/pnas.0307247101. [DOI] [PMC free article] [PubMed] [Google Scholar]
- 3.Pierobon P, et al. Velocity, processivity, and individual steps of single myosin V molecules in live cells. Biophys J. 2009;96:4268–4275. doi: 10.1016/j.bpj.2009.02.045. [DOI] [PMC free article] [PubMed] [Google Scholar]
- 4.Sweeney HL, Houdusse A. Structural and functional insights into the Myosin motor mechanism. Annu Rev Biophys. 2010;39:539–557. doi: 10.1146/annurev.biophys.050708.133751. [DOI] [PubMed] [Google Scholar]
- 5.Kad NM, Trybus KM, Warshaw DM. Load and Pi control flux through the branched kinetic cycle of myosin V. J Biol Chem. 2008;283:17477–17484. doi: 10.1074/jbc.M800539200. [DOI] [PMC free article] [PubMed] [Google Scholar]
- 6.Elting MW, Bryant Z, Liao JC, Spudich JA. Detailed tuning of structure and intramolecular communication are dispensable for processive motion of myosin VI. Biophys J. 2011;100:430–439. doi: 10.1016/j.bpj.2010.11.045. [DOI] [PMC free article] [PubMed] [Google Scholar]
- 7.Yildiz A, et al. Myosin V walks hand-over-hand: Single fluorophore imaging with 1.5-nm localization. Science. 2003;300:2061–2065. doi: 10.1126/science.1084398. [DOI] [PubMed] [Google Scholar]
- 8.Sakamoto T, Webb MR, Forgacs E, White HD, Sellers JR. Direct observation of the mechanochemical coupling in myosin Va during processive movement. Nature. 2008;455:128–132. doi: 10.1038/nature07188. [DOI] [PMC free article] [PubMed] [Google Scholar]
- 9.Kodera N, Yamamoto D, Ishikawa R, Ando T. Video imaging of walking myosin V by high-speed atomic force microscopy. Nature. 2010;468:72–76. doi: 10.1038/nature09450. [DOI] [PubMed] [Google Scholar]
- 10.Astumian RD, Mukherjee S, Warshel A. The physics and physical chemistry of molecular machines. ChemPhysChem. 2016;17:1719–1741. doi: 10.1002/cphc.201600184. [DOI] [PMC free article] [PubMed] [Google Scholar]
- 11.Mukherjee S, Warshel A. Electrostatic origin of the unidirectionality of walking myosin V motors. Proc Natl Acad Sci USA. 2013;110:17326–17331. doi: 10.1073/pnas.1317641110. [DOI] [PMC free article] [PubMed] [Google Scholar]
- 12.Mukherjee S, Alhadeff R, Warshel A. Simulating the dynamics of the mechanochemical cycle of myosin-V. Proc Natl Acad Sci USA. 2017;114:2259–2264. doi: 10.1073/pnas.1700318114. [DOI] [PMC free article] [PubMed] [Google Scholar]
- 13.Howard J. Mechanics of Motor Proteins and the Cytoskeleton. Sinauer Associates; Sunderland, MA: 2001. p. 384. [Google Scholar]
- 14.Wang H, Oster G. Ratchets, power strokes, and molecular motors. Appl Phys A. 2002;75:315–323. [Google Scholar]
- 15.Hyeon C, Thirumalai D. Capturing the essence of folding and functions of biomolecules using coarse-grained models. Nat Commun. 2011;2:487. doi: 10.1038/ncomms1481. [DOI] [PubMed] [Google Scholar]
- 16.Warshel A. Multiscale modeling of biological functions: From enzymes to molecular machines (Nobel Lecture) Angew Chem Int Ed Engl. 2014;53:10020–10031. doi: 10.1002/anie.201403689. [DOI] [PMC free article] [PubMed] [Google Scholar]
- 17.Zhao H, Winogradoff D, Bui M, Dalal Y, Papoian GA. Promiscuous histone mis-assembly is actively prevented by chaperones. J Am Chem Soc. 2016;138:13207–13218. doi: 10.1021/jacs.6b05355. [DOI] [PMC free article] [PubMed] [Google Scholar]
- 18.Andrecka J, et al. Structural dynamics of myosin 5 during processive motion revealed by interferometric scattering microscopy. Elife. 2015;4:e05413. doi: 10.7554/eLife.05413. [DOI] [PMC free article] [PubMed] [Google Scholar]
- 19.Bunker DL, Garrett B, Kleindienst T, Long GS. Discrete simulation methods in combustion kinetics. Combust Flame. 1974;23:373–379. [Google Scholar]
- 20.Gillespie DT. General method for numerically simulating stochastic time evolution of coupled chemical-reactions. J Comput Phys. 1976;22:403–434. [Google Scholar]
- 21.Warshel A, Sharma PK, Kato M, Parson WW. Modeling electrostatic effects in proteins. Biochim Biophys Acta. 2006;1764:1647–1676. doi: 10.1016/j.bbapap.2006.08.007. [DOI] [PubMed] [Google Scholar]
- 22.Lee FS, Chu ZT, Warshel A. Microscopic and semimicroscopic calculations of electrostatic energies in proteins by the polaris and enzymix programs. J Comput Chem. 1993;14:161–185. [Google Scholar]
- 23.Warshel A, et al. Electrostatic basis for enzyme catalysis. Chem Rev. 2006;106:3210–3235. doi: 10.1021/cr0503106. [DOI] [PubMed] [Google Scholar]
- 24.Hinczewski M, Tehver R, Thirumalai D. Design principles governing the motility of myosin V. Proc Natl Acad Sci USA. 2013;110:E4059–E4068. doi: 10.1073/pnas.1312393110. [DOI] [PMC free article] [PubMed] [Google Scholar]
- 25.Bryant Z, Altman D, Spudich JA. The power stroke of myosin VI and the basis of reverse directionality. Proc Natl Acad Sci USA. 2007;104:772–777. doi: 10.1073/pnas.0610144104. [DOI] [PMC free article] [PubMed] [Google Scholar]
- 26.Uyeda TQP, Abramson PD, Spudich JA. The neck region of the myosin motor domain acts as a lever arm to generate movement. Proc Natl Acad Sci USA. 1996;93:4459–4464. doi: 10.1073/pnas.93.9.4459. [DOI] [PMC free article] [PubMed] [Google Scholar]
- 27.Jana B, Onuchic JN. Strain mediated adaptation is key for myosin mechanochemistry: Discovering general rules for motor activity. PLOS Comput Biol. 2016;12:e1005035. doi: 10.1371/journal.pcbi.1005035. [DOI] [PMC free article] [PubMed] [Google Scholar]
- 28.Oguchi Y, et al. Load-dependent ADP binding to myosins V and VI: Implications for subunit coordination and function. Proc Natl Acad Sci USA. 2008;105:7714–7719. doi: 10.1073/pnas.0800564105. [DOI] [PMC free article] [PubMed] [Google Scholar]
- 29.Rosenfeld SS, Sweeney HL. A model of myosin V processivity. J Biol Chem. 2004;279:40100–40111. doi: 10.1074/jbc.M402583200. [DOI] [PubMed] [Google Scholar]
- 30.Veigel C, Schmitz S, Wang F, Sellers JR. Load-dependent kinetics of myosin-V can explain its high processivity. Nat Cell Biol. 2005;7:861–869. doi: 10.1038/ncb1287. [DOI] [PubMed] [Google Scholar]
- 31.Wulf SF, et al. Force-producing ADP state of myosin bound to actin. Proc Natl Acad Sci USA. 2016;113:E1844–E1852. doi: 10.1073/pnas.1516598113. [DOI] [PMC free article] [PubMed] [Google Scholar]
- 32.Alhadeff R, Warshel A. Simulating the function of the MjNhaP1 transporter. J Phys Chem B. 2016;120:10951–10958. doi: 10.1021/acs.jpcb.6b08126. [DOI] [PMC free article] [PubMed] [Google Scholar]
- 33.Coureux PD, Sweeney HL, Houdusse A. Three myosin V structures delineate essential features of chemo-mechanical transduction. EMBO J. 2004;23:4527–4537. doi: 10.1038/sj.emboj.7600458. [DOI] [PMC free article] [PubMed] [Google Scholar]
- 34.Metropolis N, Rosenbluth AW, Rosenbluth MN, Teller AH, Teller E. Equation of state calculations by fast computing machines. J Chem Phys. 1953;21:1087–1092. [Google Scholar]
- 35.Mugnai ML, Thirumalai D. Kinematics of the lever arm swing in myosin VI. Proc Natl Acad Sci USA. 2017;114:E4389–E4398. doi: 10.1073/pnas.1615708114. [DOI] [PMC free article] [PubMed] [Google Scholar]
Associated Data
This section collects any data citations, data availability statements, or supplementary materials included in this article.


