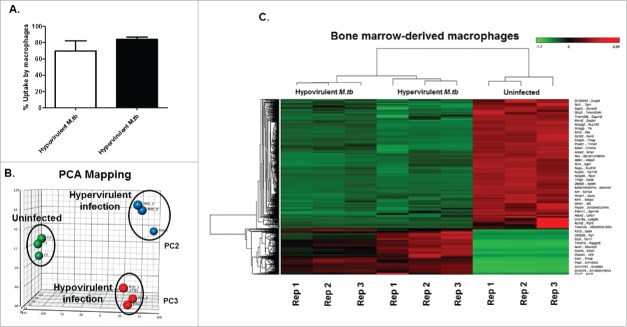
Figure 1.
Global transcriptome profile of BMDMs infected with either a hyper-(R5527) or hypovirulent (R1507) M.tb. (A). Percentage uptake of Hypovirulent and hypervirulent M.tb 4 hr post-infection in BMDM (MOI = 1). (B). Principal component analysis of uninfected BMDMs (Green, C1-C3), BMDMs infected with hypervirulent M.tb (Blue, R55-1-R55-3) and hypovirulent M.tb (Red, R50-1-R50-3) which are independently clustered. (C). Heatmap visualization of differentially expressed transcripts as analyzed by RNA-seq. Transcripts with significant fold changes, based on both fold change and FDR adjusted P-value threshold, are shown in the heat map. Gene names are indicated to the right of the heat map and bacterial growth conditions are shown at the top. Red = upregulation, green = downregulation. Dendrogram indicates sample clustering. Differentially expressed genes defined as having an FC > 2 .0 and FDR < 0 .05 in both the common and tagwise dispersion estimate analysis. Analysis was conducted on 3 biological replicates (C1, 2, 3, R55-1, 2, 3 and R150-1, 2, 3).

