

ABSTRACT
The eukaryotic transcriptional regulator Nuclear Factor kappa B (NF-κB) plays a central role in the defense to pathogens. Despite this, few studies have analyzed NF-κB activity in single cells during infection. Here, we investigated at the single cell level how NF-κB nuclear localization – a proxy for NF-κB activity – oscillates in infected and uninfected fibroblasts co-existing in cultures exposed to Salmonella enterica serovar Typhimurium. Fibroblasts were used due to the capacity of S. Typhimurium to persist in this cell type. Real-time dynamics of NF-κB was examined in microfluidics, which prevents cytokine accumulation. In this condition, infected (ST+) cells translocate NF-κB to the nucleus at higher rate than the uninfected (ST-) cells. Surprisingly, in non-flow (static) culture conditions, ST- fibroblasts exhibited higher NF-κB nuclear translocation than the ST+ population, with these latter cells turning refractory to external stimuli such as TNF-α or a second infection. Sorting of ST+ and ST- cell populations confirmed enhanced expression of NF-κB target genes such as IL1B, NFKBIA, TNFAIP3, and TRAF1 in uninfected (ST-) fibroblasts. These observations proved that S. Typhimurium dampens the NF-κB response in the infected fibroblast. Higher expression of SOCS3, encoding a “suppressor of cytokine signaling,” was also observed in the ST+ population. Intracellular S. Typhimurium subverts NF-κB activity using protein effectors translocated by the secretion systems encoded by pathogenicity islands 1 (T1) and 2 (T2). T1 is required for regulating expression of SOCS3 and all NF-κB target genes analyzed whereas T2 displayed no role in the control of SOCS3 and IL1B expression. Collectively, these data demonstrate that S. Typhimurium attenuates NF-κB signaling in fibroblasts, an effect only perceptible when ST+ and ST- populations are analyzed separately. This tune-down in a central host defense might be instrumental for S. Typhimurium to establish intracellular persistent infections.
KEYWORDS: attenuation, cell sorting, fibroblast, intracellular, live cell imaging, NF-κB response, Salmonella, single-cell analysis
Introduction
Salmonella enterica is an intracellular bacterial pathogen that causes gastrointestinal and systemic diseases in human and livestock.1 Studies in diverse animal models show the ability of this food-borne pathogen to interact with varied host cell types as the infection progresses including macrophages, dendritic cells, M cells, epithelial cells, and fibroblasts.2-4 The pathogen resolves the interaction with these distinct cell types following different strategies, ranging from induction of apoptosis to the establishment of long-lasting infections.5,6 The molecular bases of such diverse outcomes are though to rely on a distinct crosstalk occurring between the intracellular bacteria and the infected cell.7 Many of these unique host cell-specific processes remain to be characterized.
The interaction between host and the pathogen normally initiates via the recognition of pathogen-associated molecular patterns (PAMP) by PAMP-recognition receptors (PRR).8 Extensively studied PRRs include the Toll-like (TLR) and Nod-like (NLR) receptor families.9,10 Both types of PRR activate signaling pathways that converge to regulators of the NF-κB (Nuclear Factor κB) family, among others. The NF-κB family includes distinct transcription factors composed of 2 subunits, which can be homo- or heterodimers. Regardless of their exact subunit composition, the diverse NF-κB members share the control of genes related to inflammatory processes.11
S. enterica serovar Typhimurium (S. Typhimurium) activates NF-κB by different mechanisms. This pathogen activates PRR such as TLR4 or TLR5 by lipopolysaccharide (LPS) or flagellin, respectively; or NOD1 and NOD2 by peptidoglycan fragments.12,13 Protein effectors translocated by S. Typhimurium into the infected cell also modulate NF-κB activity. These proteins are substrates of 2 specialized type III protein secretion systems encoded in the Salmonella pathogenicity islands 1 and 2, SPI-1 and SPI-2,14 hereinafter refereed as T1 and T2, respectively. T1 is required for invasion of host cells whereas T2 is used by the pathogen to adapt to the intracellular environment of the infected cell. Contribution of secreted effector proteins to the stimulation of NF-κB activity was shown for the T1 effectors SopE, SopE2, SopB, and SipA.15-17 S. Typhimurium also uses protein effectors to inhibit NF-κB activity. This is the case of the T1 effectors AvrA and SptP,18,19 and the T2 effectors GogB, SseL and SspH1.20-22 Another study however described no effect of SseL on NFκB activity.23 The type-III effectors GogA, GtgA and PipA have been recently reported to dampen the NF-κB response in epithelial cells.24 Whether these effectors with opposite effects over NF-κB act coordinately during the infection process is at present unknown.
NF-κB functions as a transcriptional regulator in the form of a homo- or heterodimer built by any of the 5 subunit proteins known to fulfill this role: RelA (p65), cRel, RelB, p50 and p52.11 The most predominant heterodimer is formed by p65 and p50. In basal conditions, inhibitory IκB proteins (IκBα, IκBβ or IκBϵ) sequester the NF-κB dimers in the cell cytoplasm. In response to external stimuli, proper signaling pathways activate the IκB kinase complex that, in turn, phosphorylates and leads to ubiquitination and proteolysis of the inhibitory IκB protein. When IκB proteins are degraded the NF-κB dimers translocate to the nucleus where they function as transcription factors. Genes encoding IκBα and IκBϵ are themselves NF-κB targets.25 When activated, NF-κB shows a dynamic behavior of cytosolic-nuclear translocation that is influenced by several factors, including: i) different phosphorylation state in several residues of the heterodimer; ii) the cell type; and, iii) the NF-κB subunit to which IκB is bound. These distinct activation patterns lead to different oscillatory behaviors that influence transcriptional activity.26,27 Single-cell studies show that NF-κB presents a rich dynamics, including oscillations of the nuclear concentration.25,28-30 This type of dynamics has been observed for a number of transcription factors.31
Most in vitro studies involving host-pathogen interactions have been performed using pooled cell cultures. This approach does not take into account probable variable responses between infected and uninfected cells, and few studies have addressed this aspect at the single-cell level. An exception is a study in Legionella pneumophila that showed a biphasic activation of NF-κB by intracellular bacteria when looking at single cell level.32 Similarly, let-7 microRNA levels in infected and uninfected macrophages were reported to be different after exposure to S. Typhimurium.33 More recently, dual RNA-seq applied to S. Typhimurium-infected epithelial cells revealed higher expression of some immunity genes positively regulated by NF-κB in infected versus uninfected cells.34
Despite the evidence linking S. Typhimurium infection to NF-κB activation,34,35 no study has yet characterized the NF-κB response at the single-cell level. Considering NF-κB as a dynamic and oscillatory transcription factor, we used time-lapse microscopy to capture these properties in fibroblasts persistently infected with S. Typhimurium. Our data revealed distinct intensities of the NF-κB response in infected and bystander uninfected fibroblasts.
Results
Single-cell analysis of NF-κB dynamics in infected (ST+) and uninfected (ST-) fibroblasts in presence of S. Typhimurium
To analyze NF-κB activity at the single cell level in cultures challenged with S. Typhimurium, we combined live cell imaging and time-lapse microscopy with “automated” quantification of NF-κB dynamics. Mouse embryonic fibroblasts (MEF) obtained from GFP-p65 knock-in mice expressing physiological levels of GFP-p6536 were used to this aim. GFP-p65 MEF were incubated with DsRed-expressing S. Typhimurium for 10 min, a condition in which an average of ∼50% of fibroblasts harbor red intracellular bacteria. Nuclei of live cells were stained with a Hoechst derivative, which allowed automatic cell segmentation and tracking by our software, designed to quantify NF-κB nuclear translocation30,37 (Fig. 1A, upper panel). Fluorescence intensities in the GFP channel were used to quantify the NF-κB signal both inside the nuclei and in the cytoplasm (Fig. 1A, middle panel). Intracellular bacteria were visualized in the DsRed channel (Fig. 1A, lower panel). NF-κB dynamics was determined by the “Nuclear to Cytoplasmic ratio of the Intensities” (NCI). This NCI value has been used in a number of previous studies as direct measurement of NF-κB activation.28,30,37,38
Figure 1.
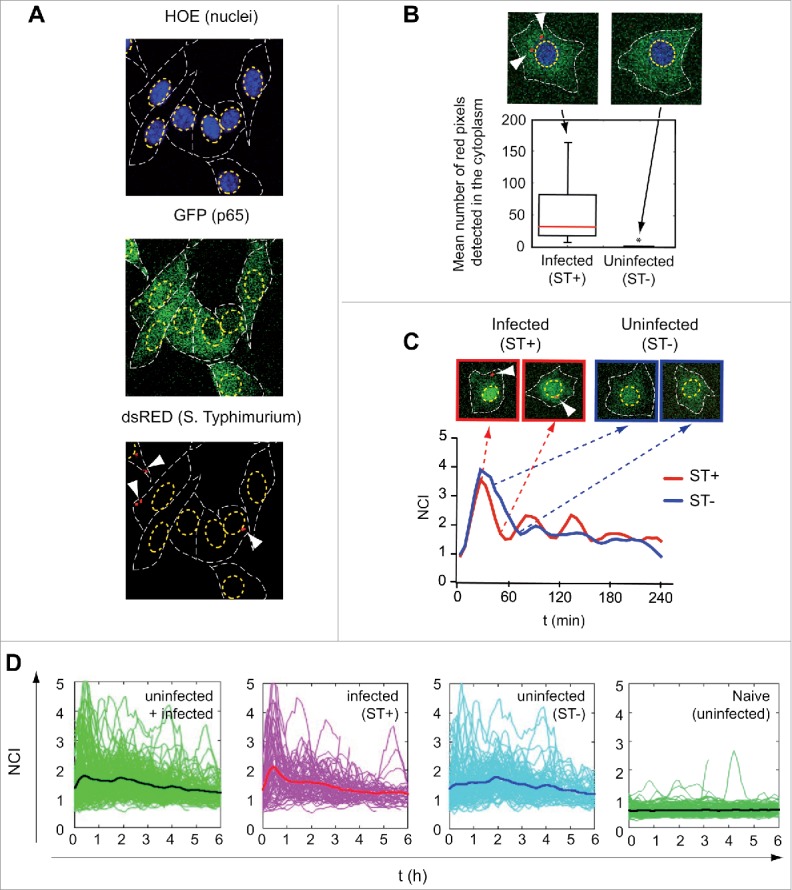
Single-cell analysis of the p65 nuclear/cytosol dynamics in S. Typhimurium-infected fibroblasts. (A) Mouse embryonic fibroblasts (MEF) isolated from knock-in GFP-p65 transgenic mice were infected with DsRed-expressing S. Typhimurium. Nuclei of live cells were stained with Hoechst (HOE) and visualized by confocal microscopy. GFP-p65 signal was quantified in the nucleus and cytoplasmic region of infected (ST+) and uninfected (ST-) fibroblasts. A representative snapshot of the different channels used is shown. Top panel: nuclei boundaries are highlighted with a yellow dashed line. Middle panel: cytoplasm boundaries (GFP channel) defined by a white dashed line. Bottom panel: DsRed signal; arrows indicate intracellular DsRed S. Typhimurium. (B) Snapshots showing examples of ST+ (white arrows pointing to intracellular bacteria) and ST- fibroblasts. The bottom panel represents average number of pixels quantified in the DsRed channel for individual cells (n = 257) up to 6 hpi. An average pixel value per cell higher than 7 discriminated ST+ from ST- fibroblasts (*, P < 0.05). (C) Example of a ST+ and a ST- fibroblast for which GFP-p65 nuclear to cytosolic ratio (NCI, on the Y-axis) was calculated along time (X-axis). Both, the ST+ and the ST- fibroblast show p65 nuclear translocation at the beginning of the experiment. At later post-infection times, oscillations in the NCI value occur with different intensities in the ST+ and ST- fibroblasts. (D) NCI values along time obtained for ST+ (n = 63), ST- (n = 90) and naïve uninfected (n = 125) cell populations. The left panel shows p65 dynamics in the total population of ST+ plus ST- MEF. Each green line corresponds to a single fibroblast cell. The black line indicates the average NCI value for the entire population. In the left-middle panel, pink lines represent individual ST+ fibroblasts discriminated using the 7-pixel threshold described in panel (B) and the thick red line the NCI average value for this population. In the right-middle panel, cyan lines represent NCI values of individual ST- fibroblasts and the thick dark blue line the NCI average value for this population. The right panels show the behavior of naïve uninfected fibroblasts with very few oscillations noted.
To distinguish infected (ST+) and uninfected (ST-) cells in our time-lapse experiment, we calibrated an automatic detection method. For each cell, we determined the number of red pixels in the DsRed channel located in the cytoplasmic region. By fixing a threshold for the average value of pixels detected for each cell in a period of 60 min (necessary to rule out transient contacts of cells with bacteria), we discriminated between infected and uninfected cells in subsequent experiments (Fig. 1B, see also Methods). The tool allowed us to determine NF-κB dynamics separately in ST+ and ST- fibroblasts. Figure 1C shows the NCI dynamics of 2 representative cells: one classified as infected (ST+) (Fig. 1C, top left panel) and the other as uninfected (ST-) (Fig. 1C, top right panel).
Time-lapse microscopy on live cells and the tracking system allowed to follow NF-κB dynamics for hundreds of cells during prolonged periods of time. Control assays discarded putative side effects in the fibroblast-bacteria interaction due to DsRed expression by the pathogen, nuclear staining in the host cell or the lasers used for excitation of fluorescent proteins in confocal microscopy (Fig. S1). The advantage of our tracking system is denoted in Fig. 1D, which shows an experiment in which MEFs were incubated with bacteria for 10 min, washed with fresh medium containing gentamicin and imaged from 1 to 7 h post infection (hpi). Single-cell dynamics presented complex oscillations that are damped at a population level (Fig 1D, left panel). NF-κB dynamics in ST+ and ST- fibroblasts (Fig. 1D, medium panels) clearly differentiate from that detected in naïve fibroblasts not exposed to bacteria, in which very few oscillations were observed (Fig. 1D, right panel). Taken together, these data indicated that our tool was suitable to: i) characterize NF-κB dynamics in both infected (ST+) and uninfected (ST-) cells to assess contribution of external and internal stimuli; and, ii) discern whether infection affects the response to external stimuli and how successive rounds of infection might alter the NF-κB response.
Intracellular S. typhimurium augments p65 nuclear translocation in infected (ST+) fibroblasts not exposed to extracellular signals
S. Typhimurium constantly release PAMPs like LPS and flagellin to the extracellular medium. These molecules activate NF-κB from outside the eukaryotic cell following their binding to TLR.12,13 NF-κB can be also activated from the “inside” by intracellular bacteria that secrete effector proteins or release peptidoglycan fragments.15-17 These latter studies examined NF-κB stimulation based on average read-outs obtained from infected and bystander uninfected cells that co-exist in the culture. Under these conditions, autocrine and paracrine signaling may occur.
To minimize the effect of paracrine signaling, we infected GFP-p65 MEF with DsRed-S. Typhimurium in a microfluidics device (see Methods). After 10 min of fibroblast-bacteria co-incubation, MEF were subjected to continuous flow with fresh medium containing gentamicin (Fig. 2A). This procedure ensured washout of the noninternalized bacteria and cytokines released to the culture medium (Movie S1). Our quantification software calculated NF-κB activation dynamics in ST+ and ST- fibroblasts (see Methods).37 Mean NCI values denoted high translocation rate of p65 during the first hour of the experiment (Fig. 2B). This early NF-κB activation wave was more pronounced in ST+ fibroblasts (Fig. 2B). The NF-κB activation detected in ST- fibroblasts was interpreted as a consequence of bacterial products such as LPS or flagellin stimulating TLR located in the fibroblast plasma membrane during the 10 min of fibroblast-bacteria incubation. The initial higher NF-κB activation found in the ST+ fibroblasts could result from both signaling due to intracellular S. Typhimurium and bacterial products present in the extracellular milieu. The contribution of extracellular signaling to NF-κB activity was confirmed by control assays showing decrease in the relative levels of the IκBα inhibitor in wild type but not in MYD88−/− MEF exposed to S. Typhimurium (Fig. S2).
Figure 2.
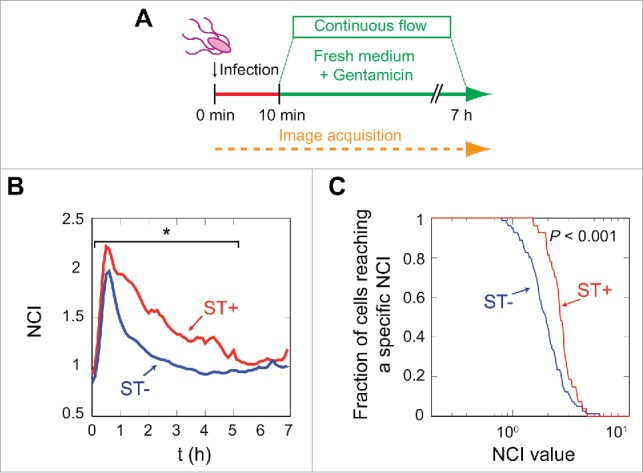
S. Typhimurium stimulates p65 nuclear translocation from inside the fibroblast. (A) Data were obtained in microfluidic cell culture chambers in which GFP-p65 expressing MEF were incubated for 10 min with DsRed-S. Typhimurium. This infection was followed by a continuous flow of medium containing 25 µg/ml gentamicin for 7 h. The continuous flow prevented extracellular signaling by cytokines secreted by the MEF and removes bacteria that could eventually be released from the host cells. (B) Average NCI values are plotted for the ST+ (n = 39, red line) and the ST- (n = 145, blue line) MEF populations. Data show a higher nuclear concentration of p65 in the infected MEF (red line) (*, P < 0.05, see also Fig. S3). (C) Fraction of cells that reached a specific NCI value at any post-infection time. This parameter was monitored for every single-cell during the experiment and the plot shows a significant (P < 0.001) higher proportion of ST+ cells reaching high NCI values.
Infection in the microfluidics device showed that after the initial NF-κB activation wave, the ST+ population maintained higher mean NCI values than the ST- fibroblasts (Fig. 2B). Differences in the mean NCI values were statistically significant up to 5 hpi (P < 0.05, Kolmogorov-Smirnov (KS) test, Fig. S3). The quantification of red pixels (bacterial DsRed signal) in individual cells along the experiment evidenced uniformity in both the ST+ and ST- populations (Fig. S4). Thus, although at early infection times some cells of the “ST+ population” had less than the 7 red pixels established as threshold, >95–99% of these ST+ cells showed a substantially higher number of pixels at later infection times, 4-6 hpi (Fig. S4). This analysis allowed us to contrast the dynamics of the NCI value in individual cells vs. the “mean” NCI values calculated for the entire ST+ and ST- populations (Figs. 1B, 2B). A distinct parameter, consisting in the fraction of cells of each population reaching a defined NCI value, further evidenced higher NCI values in ST+ than in ST- fibroblasts (Fig. 2C). Percentage of infected and uninfected cells reaching a defined NCI value at distinct post-infection times in the experiment also confirmed higher NF-κB activity in the ST+ fibroblasts (Fig. S5). Altogether, the data obtained at both the population and single cell level demonstrated that S. Typhimurium modulates positively the NF-κB response inside fibroblasts, independently of extracellular signaling.
Intracellular S. typhimurium attenuates p65 nuclear translocation in fibroblasts exposed to extracellular signals
Cytokines and chemokines are immunomodulatory molecules secreted in response to infection or inflammation. When these molecules are present in the tissue culture medium they can elicit paracrine and autocrine effects on cells irrespective of whether the cells are infected or not. We sought to determine the extent of these effects in the fibroblast culture exposed to S. Typhimurium. To this aim, we analyzed NF-κB activation in non-flow (static) infection conditions and following stimulation of the cells with TNF-α at 2 h post-infection. The initial experimental set-up consisted in a single replacement of the culture medium at 10 min post-infection, which allowed the accumulation of secreted molecules in the milieu. Image acquisition was performed from 1 to 8 hpi. At early times, 1 to 3 hpi, NF-κB activation was higher in the ST+ fibroblasts (Fig. 3A, middle panel), which agreed with the data obtained at early infection times in fibroblasts maintained in the microfluidics chamber (Fig. 2B). However, this trend, higher NF-κB activity in ST+ population, was not observed from 3 to 4 hpi regarding the fraction of cells reaching a defined NCI value at this window time (Fig. 3A, middle, right panels). Surprisingly, the uninfected (ST-) fibroblasts showed significantly more nuclear NF-κB than the ST+ cells at 4-5 hpi (Fig. 3A, middle panel; Fig. S6A). These results suggested that extracellular signaling due to soluble molecules could impact differently ST+ and ST- fibroblasts. This idea led us to hypothesize that S. Typhimurium could interfere NF-κB activation when the infected (ST+) fibroblast was exposed to extracellular stimuli.
Figure 3.

Intracellular S. Typhimurium impairs p65 nuclear translocation induced by extracellular signals. (A) p65 translocation analysis in MEF grown in standard static culture conditions (no continuous flow). In this condition, both paracrine and autocrine signaling occur. The experimental design, involving GFP-p65-expressing MEF and DsRed S. Typhimurium, is shown in left panel. The middle panel shows average NCI values along distinct post-infection times for ST+ (n = 189, red line) and ST- (n = 308, blue line) populations. ST- fibroblasts show a statistically significant increase in p65 nuclear translocation at 4-5 hpi (*, P < 0.05, KS test on the values of each population for each time point, see also Fig. S6A). Right panel indicates fractions of cells reaching a specific NCI value in the 1-8 hpi window time, with no statistically significant differences between ST+ and ST- cells (P = 0.18, KS test on the maximum values); (B) p65 translocation analysis in response to extracellular stimuli (10 ng/ml TNF-α). The cytokine was added at 2 hpi to a previously-infected culture of GFP-p65 expressing MEF. Average NCI values plotted in the middle panel show different behaviors in ST+ (n = 129) and ST- (n = 48) cells in response to the cytokine. TNF-α induces significantly higher nuclear localization of GFP-p65 in ST- fibroblasts (*, P < 0.05, see also Fig. S6B). Right panel shows fractions of cells reaching a specific NCI value in the 2-3.5 hpi time window. The difference of the maxima in this time period is statistically significant (P < 0.001, KS test); (C) p65 translocation analysis in response to a second S. Typhimurium infection. In these experiments, p65GFP expressing MEFs were seeded in microfluidic chambers and exposed to 2 rounds of infection at 0 and 3.5 h respectively. Average NCI values plotted in the lower left panel show an intense p65 nuclear localization in ST+ (n = 37) and ST- (n = 83) cells during the first hour. The second incubation with bacteria at 3.5 h has a stronger effect on p65 nuclear localization in the ST- population, which is statistically significant at 4 hpi (*, P < 0.05, see also Fig. S6C). Lower right panel shows the fraction of cells reaching specific NCI values after the second infection (time window 3.5-4.5 hpi), with statistically significant differences in the ST+ and ST- cells (P < 0.05, KS test on the NCI maxima computed in this time window for each population).
To test this hypothesis, we added TNF-α, a potent cytokine commonly used in p65 translocation assays, to a fibroblast culture previously infected with S. Typhimurium (Fig. 3B). Following TNF-α challenge at 2 hpi, the NF-κB response in the ST+ fibroblasts was significantly lower than that of ST- fibroblasts (Fig. 3B, middle panel; Fig. S6B). The difference between ST+ and ST- fibroblasts was statistically significant when analyzing the fraction of cells reaching a defined NCI value in the period of 2-3.5 hpi (Fig. 3B, medium and right panels). These data demonstrated that intracellular S. Typhimurium rendered the fibroblast refractory to the TNF-α treatment, probably associated to attenuation of the NF-κB response.
Considering this inhibitory effect, we next determined whether the infected (ST+) fibroblasts with attenuated NF-κB activity could react to other extracellular stimuli such as a second infection. To test this possibility, the fibroblast culture containing ST+ and ST-cells was challenged with DsRed-expressing S. Typhimurium (Fig. 3C). In this particular case, we used the microfluidics setup to exclude the autocrine/paracrine effect and to evaluate mainly the response to the second pathogen challenge. As noted before for TNF-α, the strong NF-κB activation wave following the initial infection was significantly higher in the ST+ fibroblasts (Fig. 3C). The time interval to determine which fibroblasts were infected or uninfected was restricted to the time before this second infection. Strikingly, the second bacterial infection induced a stronger NF-κB response in the ST- cells, which was statistically significant (Fig. 3C, Fig. S6). Additional parameters calculated in these types of experiments included the number of red pixels per individual cell along the experiment (Fig. S7A-C) and the NCI value estimated for ST+ and ST- fibroblasts at distinct post-infection times (Fig. S8A-C). Collectively, these data indicated that intracellular S. Typhimurium contributes to the unresponsiveness of the infected (ST+) fibroblast to extracellular stimuli.
Uninfected (ST-) fibroblasts respond to extracellular stimuli by expressing NF-κB target genes
So far, our data were consistent with a different behavior of ST+ and ST- fibroblasts regarding translocation of the NF-κB subunit p65 to the nucleus. We reasoned that these 2 cell populations could show different expression profiles of NF-κB target genes. To test this, we monitored genome-wide expression in sorted cell populations. Human BJ-5ta fibroblasts were infected with GFP-expressing S. Typhimurium and separated in ST+ and ST- populations by fluorescent activated cell sorting (FACS). A dual color gene expression microarray representing a total of 35,377 human genes, was used (see Materials and Methods). A total of 1,644 differentially expressed genes were detected using a 1.5 fold change threshold: 1,127 genes overexpressed in the ST+ fibroblasts and 517 genes displaying increased expression in the ST- fibroblasts. When the threshold was set to more stringent values (>1.9 or <−1.9 fold change), 29 genes displayed increased expression in ST+ fibroblasts and 16 in the ST- cells (Fig. 4A). Only seven out of the 29 (24.1%) genes induced in ST+ fibroblasts are known NF-κB targets whereas 10 out of 16 (62.5%) genes overexpressed in ST- cells are in this category.39,40 This supported the idea of S. Typhimurium down-regulating NF-κB activity upon infection. Genome-wide expression data were further analyzed for NF-κB target genes using Gene Set Enrichment Analysis (GSEA) (Fig. 4B).41,42 GSEA compared as input files a list of known NF-κB target genes 43,44 and our transcriptomic data. GSEA showed among the genes with altered expression in ST- fibroblasts an enrichment of NF-κB target genes. This enrichment was statistically significant (P < 0.001, FDR < 0.05). GSEA and GeneCodis were also used to determine which gene groups classified in GeneOntology (Biological Processes) were enriched in ST+ and ST- fibroblasts. Several gene groups were enriched with high statistical significance (P < 0.001 and FDR < 0.05) in each of the 2 cell populations (Tables S1, S2 and Fig. S9). ST+ fibroblasts showed increased expression of genes belonging to anti-apoptotic processes, including anti-apoptotic Bcl family members and apoptosis or cell proliferation inhibitory proteins (Tables S1, Fig. S9).45 Conversely, many of the genes highly expressed in ST- fibroblasts relate to pro-inflammatory response and immune defenses (Table S2, Fig. S9). Some examples include TNFA, IL1B, ICAM1, SOD2, and TNFAIP3 (see also microarray data deposited in GEO database, entry GSE71727).
Figure 4.
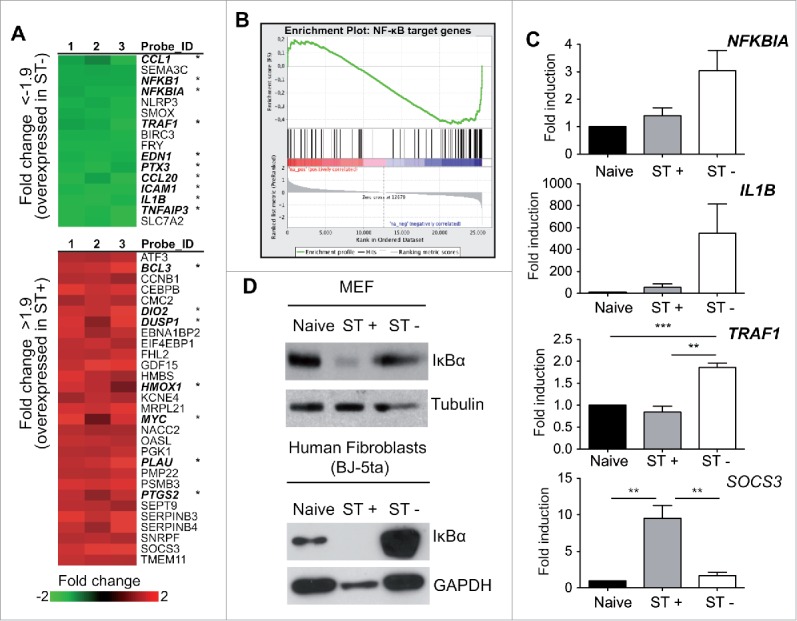
Genome-wide expression analysis in sorted ST+ and ST- populations shows up-regulation of NF-κB targets in ST- fibroblasts. (A) Human BJ-5ta fibroblasts were infected with GFP-expressing S. Typhimurium and sorted by FACS to obtain ST+ and ST- cells. Total RNA obtained from these populations at 6 hpi was used in microarray experiments to compare gene expression. Expression fold change is shown as the ST+ / ST- ratio. Genes in the upper panel (green) showed a fold change ratio lower than −1.9, therefore over-expressed in ST- fibroblasts. Genes in the lower panel (red) had a fold change higher than 1.9, therefore overexpressed in ST+ fibroblasts. Note the higher proportion of NF-κB targets (indicated with asterisk) within the genes upregulated in ST- fibroblasts. Numbers 1, 2 and 3 indicate biological replicates. (B) Gene Set Enrichment Analysis (GSEA) of known NF-κB targets in ST+ and ST- fibroblasts. NF-κB targets (vertical black lines) are more abundant in the blue side of the red-to-blue scale, which corresponds to genes upregulated in ST- fibroblasts. The red-to-blue scale denotes positive to negative log10 ratio values in the ST+ / ST- ratio. These GSEA data showed statistical significance (P < 0.001). (C) RT-qPCR data confirm different gene expression profiles in ST+ and ST- fibroblasts. Naive uninfected fibroblasts, also subjected to FACS, were used to relativize the values. Expression levels of NFKBIA, encoding IκBα, IL1B, and TRAF1 (NF-κB targets) were higher in ST- fibroblasts. SOCS3, which the microarray experiment showed upregulated in ST+ fibroblasts, displays the same behavior by RT-qPCR. Data correspond to average values and standard error of the mean (SEM) of a total of 3 independent experiments. (**, P < 0.01; ***, P < 0.001) (D) Relative levels of IκBα detected by Western blotting in naive, ST+ and ST- populations obtained from mouse (MEF) and human (BJ-5ta) fibroblasts. Tubulin and GAPDH were used as loading controls. Data are representative of a total of 3 independent experiments.
To validate the transcriptomic data, we monitored individually the expression of genes regulated by NF-κB in ST+ and ST- fibroblasts. Among these, we tested TNFAIP3, encoding the A20 protein, a TNF-induced protein; TRAF1, encoding an adaptor protein of the TNF-receptor; IL1B, encoding cytokine IL-1β; NFKBIA, which encodes the IκBα inhibitor; and, BCL3, encoding the B-cell lymphoma 3 protein (Fig. 4C, Fig. S10). As control genes non-regulated by NF-κB, we examined SOCS1 and SOCS3, encoding suppressors of cytokine signaling 1 and 3, respectively (Fig. 4C and Fig. S10).46 To exclude putative alterations in gene expression inherent to the sorting procedure to separate ST+ and ST- cells, naive fibroblasts—used as comparator in all assays—were also subjected to FACS. RT-qPCR assays confirmed altered expression of some NF-κB target genes in ST- fibroblasts when compared to both ST+ and naive cells (Fig. 4C). It is worth to note the augmented IL1B expression in ST- fibroblasts exposed to bacteria, ca. 150–400 fold, compared to naive cells (Fig. 4C). ST- fibroblasts also exhibited 3-10 fold-higher IL1B expression compared to infected (ST+) cells (Fig. 4C). This expression pattern was also reproduced in human fibroblasts (Fig. S10). Of interest, SOCS3 was induced exclusively in ST+ cells (Fig. 4C, Fig. S10), which agreed with the microarray data (Fig. 4A).
We next verified at the protein level the NF-κB response in ST+ and ST- cell populations. Western blot assays showed that the relative amount of IκBα was lower in ST+ than in ST- fibroblasts (Fig. 4D). These western data agreed with the relative transcript levels inferred from the microarray and RT-qPCR assays (Fig. 4C, D). The striking low levels observed for IκBα in ST+ fibroblasts (Fig. 4D) is reminiscent of the IκBα degradation that follows NF-κB activation. However, this phenomenon contrasts with the lower expression of NF-κB-positively regulated genes in ST+ compared to ST- fibroblasts (Fig. 4C, Fig. S10). The basis for this apparent discrepancy is difficult to infer due to the extreme cell heterogeneity in NF-κB activation found at 6 hpi (Fig. 1D). Such heterogeneity might affect both the average activation state and the transcription rates in the ST+ and ST- populations. We cannot exclude that a yet unknown post-transcriptional and/or post-translational regulation event occurring in ST+ fibroblasts might be responsible for both the low IκBα content and the deregulated transcription profile. Overall, our results suggest that S. Typhimurium hampers NF-κB-regulated transcription during a persistent infection making the colonized fibroblast unresponsive to external stimuli.
Intracellular S. typhimurium uses the type-III secretion systems encoded by SPI1 (T1) and SPI2 (T2) to attenuate NF-κB activity in the infected fibroblast
To determine how intracellular S. Typhimurium attenuates the NF-κB response in fibroblasts, we examined the chronology of the phenomenon along the infection. At early post-infection times, 1 hpi, the relative levels of IκBα inhibitory protein diminished at the same extent in ST+ and ST- cells relative to naïve fibroblasts (Fig. 5A), consistent with the early wave of NF-κB activation detected by real-time imaging microscopy (Fig. 2). At later infection times, 3-6 hpi, IκBα levels were more elevated in ST- than in ST+ cells (Fig. 5A). This variation could be consequence of the positive feedback on NFKBIA expression that follows NF-κB activation. Of interest, we also detected less p65 in the ST+ fibroblast population from 3 hpi (Fig. 5B). The lower p65 levels in the ST+ cells could also be responsible for the drop of IκBα levels in this cell population. Thus, IκBα stability is compromised if not bound to p65.47 RT-qPCR assays confirmed the variable expression of NFKBIA, IL1B, TRAF1 and SOCS3 along the infection, with the most prominent differences in NF-κB target genes noted at 6 hpi (Fig. 5C).
Figure 5.
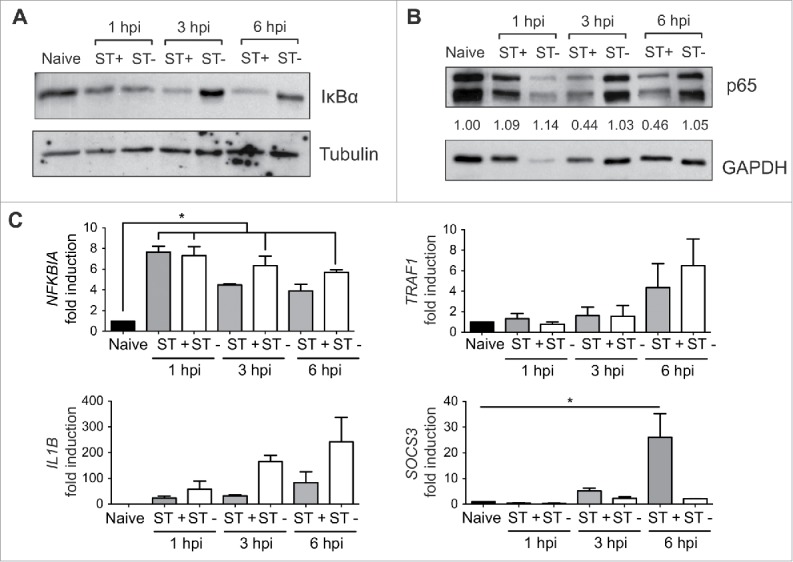
Sorting of ST- and ST+ fibroblasts uncovers distinct cellular responses from 3 h post-infection. MEF were infected with GFP-expressing S. Typhimurium using non-flow static culture conditions. ST+ and ST- cell populations were sorted by FACS at 1, 3, and 6 hpi. Naïve cells were subjected to the same sorting protocol. (A) IκBα relative levels in total protein extracts obtained from ST+ and ST- fibroblasts at the indicated post-infection times. Tubulin was used as loading control. Data are representative of a total of 2 independent experiments. (B) Relative levels of p65 (RelA) in total protein extracts obtained from ST+ and ST- fibroblasts at the indicated post-infection times. GAPDH was used as loading control. Data are representative of a total of 2 independent experiments. Numbers between the 2 blots indicate the p65:GAPDH ratios relative to the ration obtained in naive cells, which was normalized to one. Data are representative of a total of 2 independent experiments. (C) RT-qPCR was used to relativize transcript levels of NFKBIA, IL1B, TRAF1 and SOCS3 in ST+ and ST- cells respect naive fibroblasts. Compared to naive fibroblasts, NFKBIA, encoding the inhibitor IκBα, showed upregulation from 1 hpi whereas the rest of genes are expressed at higher levels at later infection times (3, 6 hpi). Note also the differences in expression of NFKBIA, IL1B, TRAF1 and SOCS3 between ST+ and ST- fibroblasts at late infection times (3, 6 hpi). Data correspond to average values and standard error of the mean (SEM) of 2 independent experiments (*, P < 0.05).
Based on these data, 6 hpi was used to decipher the mechanism(s) used by intracellular S. Typhimurium to subvert NF-κB activity. We measured NF-κB target gene expression in ST+ and ST- fibroblasts exposed to S. Typhimurium mutants having no functional type-III secretion systems encoded by pathogenicity islands SPI-1 and SPI-2, hereinafter referred as T1 and T2, respectively. Fibroblasts incubated with T1- and T2-defective mutants (ΔSPI1 and ΔssaV) were sorted by FACS to obtain ST+ and ST- populations, which were compared to those of fibroblasts exposed to wild type bacteria. Different gene expression profiles were observed between ST+ and ST- fibroblasts obtained from cultures exposed to wild type or ΔssaV bacteria (Fig. 6). The T1-defective mutant (ΔSPI1) did not attenuate expression of all NF-κB target genes tested (NFKBIA, IL1B and TRAF1), which was evident after comparing the respective ST+ populations (Fig. 6). SOCS3 induction by intracellular S. Typhimurium was also dependent on T1 (Fig. 6). Strikingly, we observed that the T2-defective mutant ΔssaV attenuated expression of some, but not all, NF-κB target genes. Thus, IL1B was strongly attenuated in the ST+ population of this T2-defective mutant (similar to the ST+ wild type population) whereas this was not the case for NFKBIA and TRAF1, which showed about 2-fold increased expression respect ST+ cells harboring wild-type bacteria (Fig. 6). SOCS3 was upregulated in the ST+ population of this T2 mutant (Fig. 6), inferring that SOCS3 expression is controlled exclusively by T1. Taken together, these data pointed to a concerted action of T1 and T2 effectors to attenuate NF-κB activity in the infected fibroblast.
Figure 6.
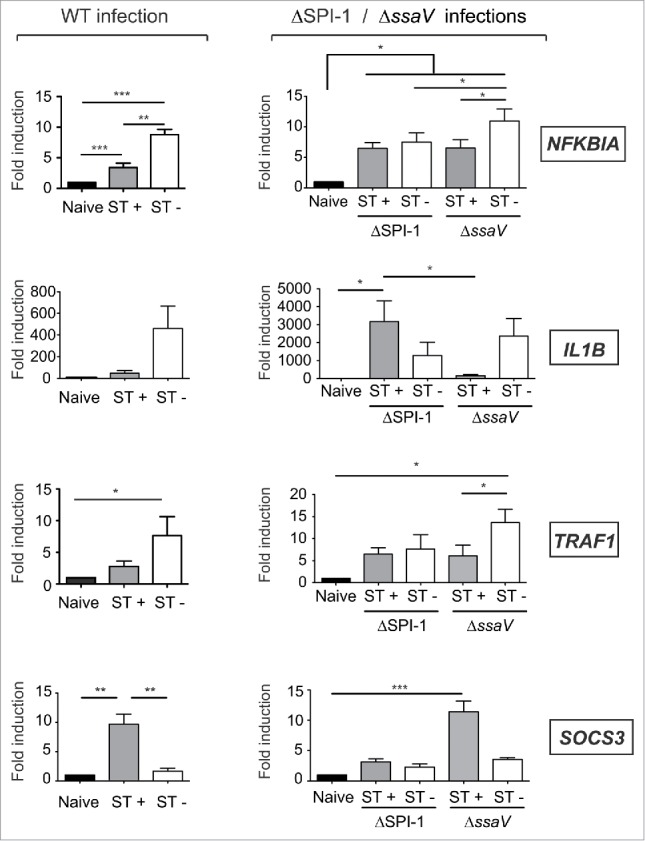
S. Typhimurium uses the type III secretion systems encoded in SPI1 (T1) and SPI2 (T2) to alter fibroblast gene expression. MEF were infected with GFP-expressing S. Typhimurium wild type (WT), ΔSPI1, or ΔssaV isogenic strains, these latter with no functional T1 and T2 type III-secretion systems, respectively. At 6 hpi, the infected cultures were sorted in ST+ and ST- cell populations. Control naive cells were also subjected to the same sorting protocol. Expression levels of NFKBIA, IL1B, TRAF1 and SOCS3 were monitored and normalized to the values detected in naive cells, which were set to one. Note the similar trends in IL1B and SOCS3 expression observed in fibroblasts infected with WT and the T2 null mutant (ΔssaV). Conversely, NFKBIA and TRAF1 expression was increased in the ST+ population of the T2 null mutant (ΔssaV) respect ST+ cells harboring wild type bacteria. Note that ST+ fibroblasts harboring the T1 null mutant (ΔSPI1) exhibited altered expression for all genes tested. Data correspond to average values and SEM of a total of 3 independent experiments. (*, P < 0.05; **, P < 0.01; *** P < 0.001).
Contribution of S. typhimurium T1 and T2 effectors to the attenuation of the NF-κB response in fibroblasts
Based on the data obtained in ST+ and ST- fibroblasts of cultures incubated with T1- and T2-defective mutants (Fig. 6), we reasoned that these 2 type-III systems could operate inside fibroblasts. Western blot assays of fibroblasts exposed to wild type bacteria demonstrated the presence in intracellular bacteria of the T1 effector protein SopB until 3 h post infection, time from which it was detectable a T2 translocon protein such as SseB (Fig. S11). Therefore, as reported in other cell types,48,49 S. Typhimurium might use the T1 system inside the fibroblast long after invasion. Our data also indicate that intracellular bacteria could use concomitantly T1 and T2.
Next, we developed a functional assay to screen NF-κB activity in fibroblasts infected with S. Typhimurium mutants lacking defined type III protein effectors. To this aim, we monitored surface levels of the immunoglobulin (Ig)-like cell adhesion molecule-1, ICAM-1.50 NF-κB regulates positively ICAM1 and our transcriptomic data showed increased expression of this gene in ST- fibroblasts (Fig. 4A). Cytometry assays with non-permeabilized cells, in which ST+ and ST- fibroblasts were differentiated using DsRed-expressing S. Typhimurium, showed higher ICAM-1 surface levels in ST+ and ST- fibroblasts compared to naive cells (Figs. 7A, B). The induction of surface ICAM-1 was also significantly higher in ST- cells, which was confirmed by epifluorescence microscopy of nonpermeabilized fibroblasts (Fig. 7C). Control assays involving quantification of surface and total ICAM-1 levels showed that S. Typhimurium alters ICAM1 expression but not the transport to the cell surface of this adhesion molecule (Fig. S12).
Figure 7.
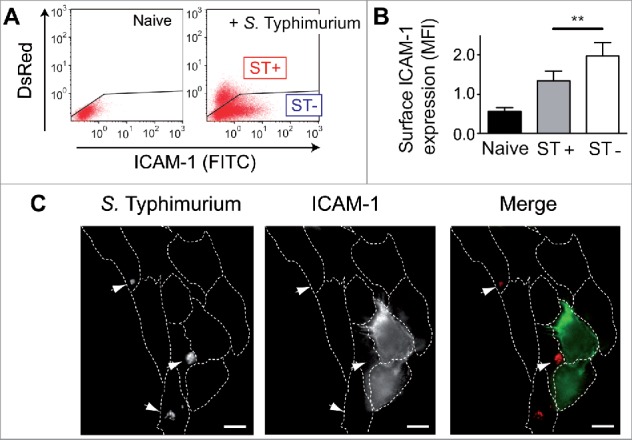
Intracellular S. Typhimurium reduces surface expression of the NF-κB target ICAM-1 in infected (ST+) fibroblasts. (A) Human BJ-5ta fibroblasts were infected with DsRed-expressing S. Typhimurium and analyzed by flow cytometry for surface ICAM-1 in non-permeabilized cells. Naive cells were used as control. Note the lower ICAM-1 signal in the ST+ cells (high DsRed signal). Black line in each plot shows the threshold established to differentiate ST+ and ST- cells. (B) Quantification of mean fluorescence intensity (MFI) obtained by flow cytometry. Data correspond to average values and SEM of 5 independent experiments. (**, P < 0.01). (C) Surface ICAM-1 protein in ST+ and ST- cells shown by epifluorescence microscopy of non-permeabilized cells. DsRed-expressing S. Typhimurium indicated by arrowheads. Right panel shows merged fluorescence signal from ICAM-1 (green) and DsRed-S. Typhimurium (red). Bar = 10 µm.
The cytometry assays provided a robust read-out for NF-κB activity, so we next examined ICAM-1 surface expression in fibroblasts infected with S. Typhimurium mutants lacking T1 and T2 effectors, including AvrA and SptP,18,19,21 and the T2 effectors GogB and SseL.20,22 We did not analyze SspH1 since the S. Typhimurium strain used in this study (SL1344 genetic background) lacks the sspH1 gene. T1- and T2-null mutants, ΔSPI-1 and ΔssaV, respectively, were also included. These cytometry assays demonstrated that S. Typhimurium uses the T1 secretion system to reduce ICAM-1 surface expression (Figs. 8A, B). However, none of the 2 T1 effectors tested, AvrA or SptP, were required for this effect (Fig. 8A).
Figure 8.

S. Typhimurium uses T1 effectors to reduce ICAM-1 surface levels in the ST+ fibroblast. MEF were infected with S. Typhimurium wild type (WT); isogenic null mutants lacking functional T1 or T2 secretion systems (ΔSPI-1, ΔssaV); or, mutants lacking defined T1 or T2 effectors involved in down-regulating NF-κB activity: AvrA, SptP (T1); GogB, SseL (T2); and, GtgA, GogA and PipA. These strains are listed in Table S3. At 6 hpi, the fibroblasts were stained for ICAM-1 and subsequently fixed. Double positive cells, ST+ cells expressing ICAM-1 in the membrane, were quantified and normalized to the total number of ST+ cells. (A) Percentage of ST+ cells positive for surface ICAM-1 versus total number of ST+ cells in MEF cultures incubated with T1, T2 null mutants and ΔavrA, ΔgogB, ΔsseL, ΔsptP strains. Whereas reduction of surface ICAM-1 requires a functional T1 system, the phenomenon is independent of the T1 effectors AvrA and SptP. The results discarded a contribution for T2 to this effect on surface ICAM-1. Data correspond to average values and SEM of a total of 3 independent experiments. (***, P < 0.001). (B) Representative dot plots showing the distribution of events in experiments involving MEF infected with wild type strain or ΔSPI-1 mutant strains. In this experiment, MEF were permeabilized and stained for LPS to discriminate between ST+ and ST- cells. Note the higher proportion of ICAM1-positive cells in ST+ cell harboring ΔSPI-1 [12.15 % vs. (12.15 + 8.18 %)] relative to ST+ cells harboring wild type bacteria [15.39 % versus (15.39 + 39.08 %)]. (C) Percentage of ST+ cells positive for surface ICAM-1 vs. total number of ST+ cells in MEF cultures incubated with ΔgtgA, ΔgogA, and ΔpipA single mutants. (D) Same as in (C) with the multiple mutants ΔavrAΔsptP and ΔgtgAΔgogAΔpipA. Note that all these mutants retain the capacity to down-regulate ICAM-1 expression in the ST+ fibroblast. Data correspond to average values and SEM of a total of 3 independent experiments. (*, P < 0.05).
A recent study by Sun et al.24 implicated a new set of S. Typhimurium type III effectors, GtgA, GogA and PipA, in the attenuation of NF-κB activity in epithelial cells. These authors claimed a redundant function of these 3 effectors in dampening NF-κB signaling via proteolysis of p65 (RelA) and RelB. Considering this study, we tested mutants lacking each of these effectors as well as the triple mutant ΔgtgAΔgogAΔpipA. All these mutants retained the capacity to reduce the surface levels of ICAM-1 (Figs. 8C, D). Likewise, we observed no effect when using a double mutant ΔavrAΔsptP (Fig. 8D), which confirmed the dispensability of these 2 T1 effectors for regulation of ICAM-1 surface expression.
Despite not observing effect on ICAM-1, we sought to determine whether the lack of GtgA, GogA and PipA could modify NF-κB activity regarding expression of other NFκB target genes. To this purpose, we sorted ST+ and ST- populations after incubation of MEF with the triple mutant ΔgtgAΔgogAΔpipA. Expression data showed that these effectors are required to attenuate expression of NFKBIA and TRAF1 by the ST+ cells (Fig. 9A, compare to wild type infection in Fig. 6). Of interest, the triple mutant ΔgtgAΔgogAΔpipA was capable of attenuating IL1B expression and up-regulating SOCS3 in the ST+ population (Fig. 9A) in a similar fashion as wild type bacteria did (see Fig. 6). We also tested whether p65 (RelA) levels in fibroblasts could be affected as a result of S. Typhimuirum infection, similarly to what has been reported in epithelial cells.24 Cytosol and nuclear cell fractionation of ST+ and ST- populations showed that GtgA, GogA and PipA could be required to decrease p65 levels in both the cytosol and the nucleus (Fig. 9B). Collectively, these data proved that S. Typhimurium uses T1 effectors to control certain processes regulated by NF-κB such as the expression of ICAM1 and IL1B. Modulation of NF-κB-independent genes, as SOCS3, could also require contribution of T1 effectors. On the other hand, attenuation of other NF-κB targets as TRAF1 and NFKBIA is apparently subjected to a more complex regulatory network in which T1 and T2 effectors could be involved, and in which GtgA, GogA and PipA might play a role.
Figure 9.
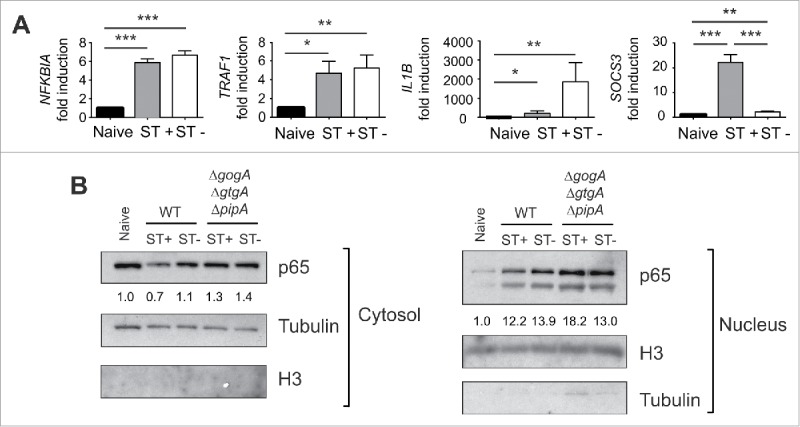
S. Typhimurium uses the type III effectors GtgA, GogA and PipA to attenuate expression of defined NF-κB targets such as NFKBIA and TRAF1. (A) MEF were infected with the S. Typhimurium triple mutant ΔgtgAΔgogAΔpipA and sorted at 6 hpi to obtain ST+ and ST- cell populations for expression analyses of NFKBIA, TRAF1, IL1B and SOCS3 by RT-qPCR using naive cells as control. Compared to ST+ cells harboring wild type bacteria (Fig. 6), ST+ cells harboring the ΔgtgAΔgogAΔpipA mutant displays increased expression of the NF-κB targets NFKBIA and TRAF1. No changes in the effects elicited by wild type bacteria (Fig. 6) were seen for IL1B and SOCS3. Data correspond to average values and SEM of a total of 3 independent experiments. (*, P < 0.05; **, P < 0.01; *** P < 0.001). (B) relative values of p65 (RelA) in cytosolic and nuclear fractions of MEF that were incubated with wild type or the ΔgtgAΔgogAΔpipA mutant. Numbers indicate the p65/Tubulin (cytosol) or p65/H3 (nuclear) ratios, which were normalized to those of naive cells. Note the lower ratio of p65 in both cytosol and nucleus of fibroblasts exposed to wild type, an effect not seen in those cells infected with the ΔgtgAΔgogAΔpipA triple mutant. Tubulin and the histone H3 were used as loading controls and markers of the cytosol and nuclear fractions, respectively. Data are representative of a total of 3 independent experiments.
Discussion
It is widely known that only a fraction of eukaryotic cells exposed to bacteria in in vitro infection models become infected. Here, we aimed to decipher how infected (ST+) and bystander uninfected (ST-) cell populations respond to S. Typhimurium using a fibroblast infection model. Single-cell studies performed by time-lapse video microscopy and analysis of sorted cell populations showed distinct phenotypes and variable gene expression in ST+ and ST- cells. These differences were noticeable in the susceptibility to external stimulatory molecules and the intensity of the NF-κB response. It is worth to note that such distinct NF-κB signaling registered in ST+ and ST- fibroblasts was not a generalized phenomenon affecting other host cell responses. Whereas GSEA analyses of our transcriptomic data showed that genes grouped in the response to interferon gamma (IFN-γ) were differentially expressed in ST+ and ST- cells, other gene groups such as those involved in the response to insulin, were not (Fig. S13). We also observed by annexin V labeling that ST+ and ST- cells trigger apoptosis at the same rate following a challenge with 1 M sorbitol (Fig. S14). These evidences support the idea of intracellular S. Typhimurium specifically attenuating NF-κB signaling as a strategy to hamper innate immune responses.
A critical parameter in the NF-κB response is the subcellular location of this transcriptional regulator. S. Typhimurium modulates the dynamics of NF-κB nuclear translocation in fibroblasts in well-defined modes, involving extracellular molecules and the action of intracellular bacteria. We observed a strong activating wave at early infection times (∼1 hpi), probably due to products such as flagellin or LPS, which signal TLR.9 This peak of NF-κB activity was followed by a progressive attenuation in the response. Similarly, it was reported that L. pneumophila activates NF-κB in 2 sequential phases using flagellin and proteins effectors of the Dot/Icm secretion system, respectively.32 Unlike S. Typhimurium, Neisseria gonorrhoeae induces mild activation of NF-κB at the initial contact with the host cell that subsequently increases over time.51 These studies in L. pneumophila and N. gonorrhoeae used fixed cells, which hindered the analysis of NF-κB dynamics at the single cell level. Single-cell analysis was reported in a study involving Helicobacter pylori, in which authors performed live-cell imaging to analyze NF-κB cytosol-nuclear oscillations during infection.52 However, this study examined only few cells and lacked a robust statistical analysis.
Our time-lapse microscopy performed in hundreds of cells uncovered a different behavior of ST+ and ST- fibroblasts in experimental settings that differed by the absence/presence of extracellular stimulatory molecules. In our opinion, a relevant discovery was the refractoriness shown by the ST+ cells to external stimuli such as a TNF-α challenge or a secondary infection. These results might challenge studies in non-flow (static) infection conditions, in which average data are obtained from culture extracts derived from mixtures of infected and uninfected cells. Based on our observations, it is tempting to speculate that some of the reported responses could not be directly attributable to the cells harboring the pathogen.
Our data revealing attenuation of the NF-κB response by S. Typhimurium are, however, difficult to reconcile with previous studies showing that defined T2 effectors, as SseL and GogB, inhibit IκBα degradation and as a result, impair NF-κB activation.20,22 We observed less IκBα protein in ST+ cells, which led us not to discard alternate mechanisms exploited by S. Typhimurium to attenuate NF-κB in fibroblasts. The data obtained with the ΔSPI-1 and ΔssaV mutants unequivocally demonstrated that effectors translocated by the T1 and T2 systems contributes to hamper the NF-κB response. We tested T1 effectors reported to be linked to subversion of NF-κB in macrophages and epithelial cells such as AvrA and SptP.18,19,21 However, none of these T1 effectors proved to be essential for this effect in fibroblasts, at least at the level of ICAM-1 surface expression. It is possible that a yet unknown T1 effector(s) is responsible for hampering NF-κB signaling in fibroblasts. Alternatively, we could speculate on AvrA and SptP playing partially redundant functions in the fibroblast, a phenomenon not reported or analyzed in other cell types. Studies with the double mutant ΔavrAΔsptP discarded this possibility.
The effects on host gene expression data obtained with the ΔssaV mutant pointed to a selective role of some T2 effectors, which could also contribute to “fine-tuning” of the NF-κB response. Remarkably, these T2 effectors seem to control expression of some NF-κB targets, such as NFKBIA and TRAF1, but not others, like IL1B or the non-target gene SOCS3, which conversely, are fully dependent on T1 (see Fig. 6). Of major interest is the fact that GtgA, GogA and PipA, recently shown to attenuate NF-κB signaling,24 also influence NFKBIA and TRAF1 expression but not that of IL1B or SOCS3 (Fig. 9). These findings could be consistent with translocation of these 3 effectors by the T2 system, which to our knowledge, it has not been yet shown. We cannot discard the possibility that other yet unknown T2 effectors, distinct from GogB and SseL, might also contribute to dampen NF-κB activity in fibroblasts. We could also speculate that this selective control by S. Typhimurium in the expression of some, but not all NF-κB target genes, could associate to distinct affinity of NF-κB for the target genes tested. Activation of NF-κB at different extent by a defined effector could potentially result in distinct degrees of saturation of the promoters normally recognized by this transcriptional regulator. This tempting idea could be tested in future investigations.
It is also important to recall in the capacity of S. Typhimurium to “activate” NF-κB using the same T1 and T2 secretion systems. Thus, the T1 effectors SopE, SopE2 and SopB signal positively to Rho-family GTPases, which leads to an enhanced NF-κB response.16,17 Another T1 effector, SipA, also activates NF-κB via NOD2.15 It is also known that peptidoglycan fragments signal in the host cell by activating NOD1 and NOD2 that, in turn, activate NF-κB.12 S. Typhimurium could release muropeptides that activate NOD1 and NOD2 from inside the host cell, a phenomenon not yet investigated. This putative mechanism could explain the positive NF-κB regulation coming from “inside” and observed when ST+ fibroblasts were maintained in the microfluidics device in the absence of stimulatory molecules. A challenge for future studies will be to understand how intracellular S. Typhimurium coordinates these opposing effects on NF-κB, on one side stimulatory and in the other down-regulating such activation. The fact that a plethora of T1 and T2 effectors converge in altering NF-κB activity in opposite directions is fascinating, since it demands temporal and/or spatial regulation regarding their translocation into the infected host cell as well as target accessibility.
The physiological state adopted by intracellular bacteria may also contribute to modulate NF-κB activity in different ways. For instance, S. Typhimurium enters into a state of limited proliferation inside fibroblasts,53 an infection model in which NF-κB dynamics was not known so far. L. pneumophila mutants that display low intracellular proliferation rates are impaired for NF-κB activation.32 Future studies could assess whether the limited growth exhibited by S. Typhimurium inside fibroblasts could explain the lower NF-κB activity observed in ST+ cells. Alternatively, it is possible that the pathogen dampen NF-κB signaling in this host cell type to establish a persistent infection, a condition that may require the impairment of signaling events attracting host immune defenses.
To our knowledge, the study reported here provides another novel concept not reported before: the enhanced expression of some genes responding to bacterial infection, like IL1B, TRAF1 or ICAM1,17 in the uninfected ST- cells. Other genes responding to infection, such as BCL3 or SOCS3, showed increased expression in the ST+ fibroblast population. Of much interest is the fact that SOCS3 inhibits the function of TRAF6 and TAK1,54 which are necessary for TLR and IL-1β signaling. SOCS3 induction is in line with our model involving refractoriness to extracellular stimuli in the ST+ fibroblast, shown in the experiments involving TNF-α or a second round of infection. Our gene expression data partly agree with recent RNA-seq data obtained from sorted ST+ and ST- epithelial cells incubated with S. Typhimuirum.34 This study showed up-regulation of SOCS3 in infected HeLa-S3 cells although it also claimed upregulation of NF-κB target genes in ST+ compared to ST- cells (see Fig. 1d of ref. 34). Intriguingly, the study did not report comparable enhanced expression in ST+ cells of bona fide NF-κB targets such as NFKBIA, TRAF1, or IL1B. In control assays, we analyzed in a comparative basis NFKBIA, TRAF1, and IL1B expression in fibroblasts and HeLa epithelial cells. These assays showed that these NF-κB target genes are expressed at higher level in the ST- than in the ST+ cell population (Fig. S15). Our assays also uncovered a slight induction IL1B in HeLa cells (maximum of ∼10 fold in ST- cells) relative to fibroblasts (∼150-400 fold in ST- cells). Altogether, our observations support responses to S. Typhimurium in the fibroblast that do not take place at the same extent in epithelial cells. Such difference in the pathogen-host cell crosstalk might sustain the distinct lifestyle reported for S. Typhimurium in these 2 non-phagocytic cell types.
In summary, this work sheds new insights into the anti-inflammatory effect of intracellular bacteria, showing that intracellular S. Typhimurium attenuates NF-κB signaling in fibroblasts. The transcriptional profile obtained in ST+ and ST- fibroblasts reveals a clear drift to anti-inflammatory pathways in the infected cell, whereas uninfected cells respond to cytokines and show a pro-inflammatory profile. Future studies should also determine whether the minimal reactiveness observed in the S. Typhimurium-infected fibroblast is accompanied by impaired production and release of immune-attracting molecules. Such scenario might certainly facilitate the establishment of long-lasting asymptomatic infections by this pathogen in this host cell type, which remains understudied in most infection models.
Materials and methods
Bacterial strains and eukaryotic cells lines
The S. Typhimurium strains used in this study are listed in Table S3. Mutant construction was carried out by one-step inactivation using PCR products55 and the oligonucleotide primers described in Table S4. Transduction of the mutant alleles to different genetic backgrounds was performed with P22 HT105/1 int201 phage,56 as described.57 Phage-free transductants were identified in green plates.58 Bacteria were grown routinely in Luria broth (LB) at 37°C. Ampicillin (50 μg/ml) or chloramphenicol (10 μg/ml) were added to the growth media to maintain plasmid expression. BJ-5ta human foreskin fibroblasts (ATCC CRL-1004) and mouse embryonic fibroblasts (MEF) from wild type C57BL/6 (Envigo S.A., Spain) and C57BL/6 MYD88−/− mice (supplied by Carlos Ardavin, Centro Nacional de Biotecnología-CSIC, Madrid, Spain), were cultured in Dulbecco's modified Eagle's medium (DMEM) supplemented with 10% (v/v) fetal bovine serum (FBS), as described.59 GFP-p65 knock-in MEFs (supplied by A. Agresti) were cultured in phenol-red free DMEM supplemented with 10% fetal calf serum (FCS), 50 μM β-mercaptoethanol, 1 % (w/v) L-glutamine, 1% (w/v) sodium pyruvate and 1% non-essential amino acids. Cells were propagated at 37°C with humidified 5% CO2 atmosphere.
Bacterial infection of eukaryotic cells
For infection, bacteria were grown overnight in LB at 37°C in nonshaking conditions to a final optical density at 600 nm [OD600] of ∼1.0. One ml of bacterial culture was centrifuged (4300 × g, 2 min, RT) and the bacteria resuspended in 1 ml of complete phosphate-buffered saline (PBS) pH 7.4. Fibroblast cultures were infected at a multiplicity of infection (MOI) of 10:1 (bacteria to eukaryotic cells). In the case of the T1- (ΔSPI-1) strain, MOI was increased to 50:1. Confluence of the fibroblast culture was maintained at 60-90% at the time of infection. Fibroblasts were exposed to bacteria for 10 min (GFP-p65 knock-in MEFs) or 30 min (wild type and MYD88−/− MEF and human BJ-5ta fibroblasts). Subsequent washing of infected cells was performed with complete PBS pH 7.4 followed by addition of fresh tissue culture medium containing 25 μg/ml gentamicin.
Time-lapse microscopy experiments
For live cell imaging, GFP-p65 knock-in MEF were seeded the day before the experiment either on chambered cover glasses (Thermo Scientific. Nunc LabTek) or on CellASIC ONIX M04S-03 Microfluidics Plates. In the microfluidics experiments, the flow rates used were as described.37 The volume of the chamber is approximately equal to 1 µl and the pressure applied in the device (1 psi) give flow rates of 10 µl / hr. Under these conditions, the volume of the chamber is completely replaced in less than 10 min. Nuclei were stained with 50 ng/ml Hoechst 33342 (NuclBlue Live ReadyProbes, cat. no. R37605 Life Technologies), which was added 1 h before the infection. When indicated, mouse recombinant TNF-α (R&D 535 Systems) was added to the cell culture medium to a final concentration 10 ng/ml. The CellASIC microfluidics system was used to perform transient exposure of fibroblasts to bacteria followed by continuous wash out to eliminate extracellular bacteria and cytokines. Visualization of live GFP-p65 knock-in MEF was performed in a Leica TCS SP5 confocal microscope with an incubation system where the cells were stably maintained at 37°C in humidified 5% CO2 atmosphere. Time-lapse images were acquired at 6 min intervals. Microscope setting was adjusted to obtain information on the whole cell thickness: low magnification objective (20 × 0.5 NA) with an open pinhole (Airy 3) and an image width of 10.7 μm. GFP-p65 signal was imaged at 488 nm, Hoechst-stained nuclei at 405 nm and DsRed-expressing S. Typhimurium at 543 nm. Images were acquired as 16 bit, 1024 × 1024 TIFF files.
Imaging and quantification of NF-κB dynamics
To evaluate NF-κB cytosol-nuclear oscillations in a large number of cells, we used our software 37 to calculate the nuclear to cytoplasmic ratio of the intensity (NCI) derived from GFP-p65 for hundreds of cells. This is an internally-normalized measure since it is a ratio of intensities calculated in different areas of the same cell and it is not affected by experimental distortions such as variations in cell focus or laser intensity. NCI does not require a perfect segmentation of the cytoplasm, as long as we are only interested in the average intensity that can be estimated from a smaller cytoplasmic area. The software used was written on GNU-Octave as previously described,37 and works as follows: from each time-lapse experiment we retrieve images of the Hoechst, GFP and DsRed channels. These images are 1024 × 1024 pixels. With our 20X amplification, cells can be enclosed in a box of 100 × 100 pixels. Nuclei were segmented and used for cell tracking using the Hoechst channel. To estimate the background for each cell, we take a box of 150 × 150 size around each cell nucleus, divide it in tiles of 10 × 10 pixels and take the average intensity for each of the tiles. The smaller average value is the estimation of the background for the cell considered. The size of the window, of the tiles, and the fact that we cultured cells quite sparsely, guarantee that this is a good estimation of the background as long as typically many of these tiles do not overlap with any cell. To estimate the “average cytoplasmic intensity,” a bounding box of size 1.5 L around each nucleus is taken, being L the largest side of the bounding box enclosing each nucleus (taken as the maximum width in the x and y directions). In this box, the cytoplasm is segmented considering that pixels above the background belong to the cell cytoplasm and the average cytoplasmic intensity is calculated. NCI is then computed as the average nuclear intensity divided by the average cytoplasmic intensity after subtracting the background. Dividing or apoptotic cells were identified by their geometrical features (abrupt changes in size of the nucleus and of the cytoplasmic ring) and were discarded automatically. Unless otherwise stated, the experiments were performed at least in 2 independent assays. The trends in the relative levels of NF-κB activation in ST+ and ST- cells was reproduced in all repetitions.
Sorting of cell populations
Fibroblasts were seeded in 15 cm tissue culture dishes. Infected cultured were rinsed twice with PBS and detached with trypsin for 5 min at 37°C. Cells were collected in ice cold sorting buffer (5 mM EDTA, 25 mM HEPES, 0.5 % (v/v) BSA in PBS pH 7.4), centrifuged at 200 × g, 5 min, 4°C, and suspended in the same buffer at a density of 5 × 10⁶ cells/ml. Separation was performed in either a SY3200 Cell Sorter system (Sony Biotechnology Inc.) or in a FACSARIA III Sorter system (Becton Dickinson). The cells were collected in PBS pH 7.4 containing 2 % BSA, further harvested by centrifugation (200 × g, 10 min, 4°C), washed once in ice cold PBS pH 7.4, centrifuged (200 x g, 10 min, 4°C), and finally resuspended in Trizol (Thermo Fisher Scientific) for RNA and protein purification at a density of 106 cells/ml. In experiments involving cell fractionation with non-anionic detergents (Triton X-100), the sorted cells were resupended in fractionation buffer [50 mM Tris-HCl pH8, 0.5 % Triton X-100, 137.5 mM NaCl, protease inhibitors (Roche), 1 mM sodium ortovanadate].
Flow cytometry
Human BJ-5ta fibroblasts were seeded the day before the experiment in 6-well tissue culture plates (Falcon). Fibroblasts were infected with DsRed-expressing S. Typhimurium for 25 min. Subsequently, the infected culture was rinsed 3 times with PBS pH 7.4 and the cells detached with 0.25 % (w/v) trypsin 1 mM EDTA for 30 s. Trypsin was then inactivated with complete medium and fibroblasts harvested by centrifugation (300 × g, 10 min, 4°C). Cells were stained with FITC-conjugated mouse anti-human CD54 (ICAM-1) (Immunotech) in PBS pH 7.4 supplemented with 2 % (v/v) FBS for 30 min at 4°C, washed in PBS pH 7.4, and fixed in 4% (w/v) paraformaldehyde. Cells were analyzed on a Beckman Coulter Cytomics FC500 fitted with a 488 nm Argon laser (Beckman Coulter) and further reviewed with Kaluza software (Beckman Coulter). For experiments involving MEF, the protocol was the same as for human fibroblasts with slight modifications. After staining of surface ICAM-1 with phycoerythrin (PE)-conjugated anti-mouse CD54 (Pharmigen), fibroblasts were fixed for 10 min in 3% (w/v) PFA. In experiments involving MEF infected with strains not producing fluorescent proteins, the fibroblasts, previously stained with PE-anti mouse CD54, were incubated with anti-S. Typhimuirum LPS mouse antibody (1:250; gift of J.M. Slauch, University of Illinois, IL) in permeabilizing conditions [PBS, 0.2% saponin, 5 % goat serum] and further incubated with goat anti-mouse antibody conjugated to Alexa647. This procedure allowed to differentiate ST+ and ST- populations. Cells were analyzed on a Beckman Coulter Gallios cytometer fitted with a 488 nm Argon and HE-NE 633 nm lasers. Results were further reviewed with Kaluza software (Beckman Coulter). Data were analyzed by one-way analysis of variance (ANOVA) with Bonferroni’s Multiple Comparison Test using Prism version 5.0 (GraphPad Software, Inc.). Differences in values with P < 0.05 were considered significant.
Annexin V assays in fibroblasts treated with 1 M sorbitol
MEF infected with DsRed-expressing S. Typhimurium were incubated at 3 hpi in tissue culture media containing 1 M sorbitol during 1 h. Following this incubation, fibroblasts were detached with 0.1 % (w/v) trypsin and labeled with fluorescein isothiocyanate (FITC)-annexin V (Southern, 10040-02). Annexin V binds to phosphatidyl serine (PS) on the plasma membrane allowing detection of membrane damage, which is characteristic of early apoptosis. Fibroblasts were further analyzed on a Beckman Coulter Gallios cytometer fitted with a 488 nm Argon and HE-NE 633 nm lasers. Results were further reviewed with Kaluza software (Beckman Coulter).
Epifluorescence microscopy
Human BJ-5ta fibroblasts were infected with DsRed-expressing S. Typhimurium and processed for epifluorescence microscopy of non-permeabilized cells as described.59 Antibody used to detect surface ICAM-1 was FITC-conjugated mouse anti-human CD54 (ICAM-1) (Immunotech). Images were acquired using an inverted Leica DMI 6000B microscope with an automated CTR/7000 HS controller (Leica Microsystems) and an Orca-R2 CCD camera (Hamamatsu Photonics).
RNA purification and protein extracts
Depending of the cell yield obtained in the sorting procedure, 105–106 fibroblasts were used to purify total RNA and protein extracts following Trizol manufacturer recommendations. Total RNA obtained was resuspended in RNase-free H2O. Samples were quantified with NanoDrop 1000 Spectrophotometer and the concentration adjusted to 100 µg/ml. RNA integrity was assessed visualizing 18S and 28S rRNAs in an agarose gel. For protein purification, samples were resuspended in 200 µl PBS- 1% (wt/vol) SDS, incubated overnight at 50°C and sonicated 3 × 5 min (47 kHz). An appropriate volume of Laemmli buffer was added to each sample.
Genome expression analyses
For microarray experiments, the concentration and integrity of RNA were assessed in an Agilent 2100 bioanalyzer (Agilent Technologies). Samples derived from ST+ and ST- fibroblasts were labeled with Cy3 and Cy5, respectively, and hybridized in a the commercially available SurePrint G3 Unrestricted Gene expression 8 × 60 K Microarray (Agilent Technologies, reference no. G4858A-02800), representing a total of 35,377 human genes. FIESTA viewer60 was used to graphically visualize the results applying different statistical filters to the values.
Gene set enrichment analysis (GSEA)
The GSEA software, version v2.1.0,41,42 was used to analyze gene expression profiles and to define gene sets that show significant differences in expression among samples in 2 experimental conditions. Gene identifiers in the microarray were unified (to avoid duplicity of probes in the array) and ranked by the highest absolute fold change value. GESA determines whether genes belonging to a gene set are randomly distributed in the ranked gene list or, by contrast, they accumulate on the top or the bottom of the ranked gene list. A negative GSEA enrichment score associates to those gene sets enriched in the ST- population whereas positive GSEA enrichment score was to gene sets enriched in the ST+ population. To determine NF-κB target gene enrichment, we used a published list of genes regulated by NF-κB.61 The GSEA algorithm compared the NF-κB target genes and the ranked gene list from the microarray, establishing the localization of the NF-κB target genes in the ranked list. The Gene Ontology (GO) database was used to determine which GO groups from the Biological Processes (BP) sub-set were enriched in infected or uninfected cell populations.
Antibodies and Western blotting
The following antibodies were used for Western blotting assays: rabbit polyclonal anti-IκBα (Cell Signaling Technology, #9242), 1:1,000 dilution; Rabbit monoclonal anti-histone H3 (Cell Signaling Technology, #4499), dilution 1:1,000; mouse monoclonal anti-GAPDH (clone 6c5; Abcam), 1:20,000 dilution; rabbit polyclonal anti-IgaA,62 1:10,000 dilution; mouse monoclonal anti-FLAG (clone M2; Sigma), 1:5,000 dilution; rabbit polyclonal anti-SseB, 1:40,000 dilution; and, mouse monoclonal anti-α-tubulin (clone DM1A; Sigma), 1:50,000 dilution. Goat polyclonal anti-mouse or anti-rabbit IgG conjugated to horseradish peroxidase (Bio-Rad) were used as secondary antibodies diluted 1:5000. ECL reagent (Bio-Rad) was used to visualize proteins.
RT-qPCR assays
One microgram of total RNA was reverse transcribed to cDNA using high capacity cDNA reverse transcription kit (Applied Biosystems) following manufacturer instructions. Oligonucleotides listed in Table S4 were designed using the Primer-BLAST tool,63 restricting PCR product size from 50 to 100 nt and spanning exon-exon regions when possible. Reactions were carried out in an ABI Prism 7500 instrument using the Power SYBR-green PCR master mix (Life Technologies) under standard reaction conditions and establishing a melting temperature of 60°C and an extension time of 1 min. Expression levels of each gene in each condition tested were normalized to the levels of hypoxanthine phosphoribosyl transferase (HPRT) transcript.
Gene expression accession number
Genome expression data obtained in the sorted infected and uninfected BJ-5ta fibroblast populations were deposited in the GEO database 64 under accession number GSE71727.
Phototoxicity test
Fibroblasts were incubated for 6 h in a 5% CO2 atmosphere either in a CO2 incubator or inside a thermostated microscope chamber. Photographs were taken every 6 min as described in section “Time lapse microscopy experiments.” Four conditions were tested: i) GFP-p65 MEF infected with DsRed-expressing S. Typhimurium in the presence of Hoechst 33342 derivative; ii) GFP-p65 MEF infected with DsRed-expressing S. Typhimurium without Hoechst 33342 derivative; iii) GFP-p65 MEF infected with wild type S. Typhimurium in the presence of Hoechst 3342 derivative; and, iv) wild type MEF infected with DsRed-expressing S. Typhimurium in the presence of Hoechst 3342 derivative. Fibroblasts seeded in 3 8-well plates (Ibidi) were infected as described in section “Bacterial infection of eukaryotic cells.” Viable intracellular bacteria were quantified at 1 and 6 hpi using PBS, pH 7.4, 1 % Triton X-100, 0.1 % SDS to lyse the cultures followed by plating appropriate dilutions of the lysates onto LB agar plates.
Statistical analyses
To analyze the statistical difference between maximum NCI values in infected and uninfected populations, or in their values in each time point of our time-lapse experiments, a 2-sided Kolmogorov Smirnov test was used. Gene expression data were analyzed by one-way analysis of variance (ANOVA) with Bonferroni’s Multiple Comparison Test using Prism version 5.0 (GraphPad Software, Inc.). Differences in values with P < 0.05 were considered significant.
Supplementary Material
Abbreviations
- GAPDH
glyceraldehyde 6-phosphate dehydrogenase
- GSEA
gene set enrichment analysis software
- ICAM-1
intracellular adhesion molecule-1
- IκBα
NF-κB inhibitor α (protein)
- IL1B
interleukin 1β (gene)
- NCI
nuclear to cytoplasmic ratio of the intensity
- NF-κB
nuclear factor kappa-B
- NFKBIA
NF-κB inhibitor α (gene)
- PAMP
pathogen-associated molecular patterns
- PRR
PAMP-recognition receptor
- SOCS3
suppressor of cytokine signaling 3
- SPI-1
Salmonella pathogenicity island 1
- SPI-2
Salmonella pathogenicity island 2
- T1
type III secretion system encoded by SPI-1
- T2
type III secretion system encoded by SPI-2
- TLR
Toll-like receptor
- TNFα
tumor necrosis factor α
- TRAF1
TNF-receptor-associated protein 1
Disclosure of potential conflicts of interest
No potential conflicts of interest were disclosed.
Acknowledgments
We thank Carlos Ardavín, (CNB-CSIC, Madrid) for the MYD88−/− mice; Michael Hensel (Osnabrück University, Germany) and Wolf-Dietrich Hardt (ETH Zurich, Switzerland) for strains and antibodies; Juan Carlos Oliveros (Bioinformatics Unit, CNB-CSIC, Madrid) for his assistance with bioinformatics analysis of microarray data using the GSEA software; José Manuel Ligos (Cellomics Unit, Centro Nacional de Investigaciones Cardiovasculares, CNIC) for his help in FACS experiments; and, Sylvia Gutierrez-Erlandsson for technical assistance at the CNB Confocal Microscopy Unit. We are also grateful to Pablo García (CNB-CSIC) for the technical assistance in the cytometry assays.
Funding
This work was supported by grants BIO2013-46281-P and IPT-2012-0213-060000 (to FGdP) from Spanish Ministry of Economy and Competitiveness; and, Marie Curie Grant 2011-298447NonLinKB (to SZ and AA). ERM was recipient of a fellowship from the ‘Formación de Personal Investigador’ (FPI) Program of the Spanish Ministry of Economy and Competitiveness, which also supported a short stay in AA's laboratory.
References
- [1].Thiennimitr P, Winter SE, Baumler AJ. Salmonella, the host and its microbiota. Curr Opin Microbiol 2012; 15:108-14; PMID:22030447; http://dx.doi.org/ 10.1016/j.mib.2011.10.002 [DOI] [PMC free article] [PubMed] [Google Scholar]
- [2].Watson KG, Holden DW. Dynamics of growth and dissemination of Salmonella in vivo. Cell Microbiol 2010; 12:1389-97; PMID:20731667; http://dx.doi.org/ 10.1111/j.1462-5822.2010.01511.x [DOI] [PubMed] [Google Scholar]
- [3].Tierrez A, García-del Portillo F. New concepts in Salmonella virulence: the importance of reducing the intracellular growth rate in the host. Cell Microbiol 2005; 7:901-9; PMID:15953023; http://dx.doi.org/ 10.1111/j.1462-5822.2005.00540.x [DOI] [PubMed] [Google Scholar]
- [4].Gog JR, Murcia A, Osterman N, Restif O, McKinley TJ, Sheppard M, Achouri S, Wei B, Mastroeni P, Wood JL, et al.. Dynamics of Salmonella infection of macrophages at the single cell level. J R Soc Interface 2012; 9:2696-707; PMID:22552918; http://dx.doi.org/ 10.1098/rsif.2012.0163 [DOI] [PMC free article] [PubMed] [Google Scholar]
- [5].García-del Portillo F, Nuñez-Hernández C, Eisman B, Ramos-Vivas J. Growth control in the Salmonella-containing vacuole. Curr Opin Microbiol 2008; 11:46-52; PMID:18282735; http://dx.doi.org/ 10.1016/j.mib.2008.01.001 [DOI] [PubMed] [Google Scholar]
- [6].Monack DM. Salmonella persistence and transmission strategies. Curr Opin Microbiol 2012; 15:100-7; PMID:22137596; http://dx.doi.org/ 10.1016/j.mib.2011.10.013 [DOI] [PubMed] [Google Scholar]
- [7].Núñez-Hernández C, Alonso A, Pucciarelli MG, Casadesús J, García-del Portillo F. Dormant intracellular Salmonella enterica serovar Typhimurium discriminates among Salmonella pathogenicity island 2 effectors to persist inside fibroblasts. Infect Immun 2014; 82:221-32; http://dx.doi.org/ 10.1128/IAI.01304-13 [DOI] [PMC free article] [PubMed] [Google Scholar]
- [8].Broz P, Ohlson MB, Monack DM. Innate immune response to Salmonella typhimurium, a model enteric pathogen. Gut Microb 2012; 3:62-70; http://dx.doi.org/ 10.4161/gmic.19141 [DOI] [PMC free article] [PubMed] [Google Scholar]
- [9].Gerold G, Zychlinsky A, de Diego JL. What is the role of Toll-like receptors in bacterial infections? Sem Immunol 2007; 19:41-7; http://dx.doi.org/ 10.1016/j.smim.2006.12.003 [DOI] [PubMed] [Google Scholar]
- [10].Elinav E, Strowig T, Henao-Mejia J, Flavell RA. Regulation of the antimicrobial response by NLR proteins. Immunity 2011; 34:665-79; PMID:21616436; http://dx.doi.org/ 10.1016/j.immuni.2011.05.007 [DOI] [PubMed] [Google Scholar]
- [11].Ghosh S, Hayden MS. New regulators of NF-kappaB in inflammation. Nature Rev Immunol 2008; 8:837-48; http://dx.doi.org/ 10.1038/nri2423 [DOI] [PubMed] [Google Scholar]
- [12].Philpott DJ, Sorbara MT, Robertson SJ, Croitoru K, Girardin SE. NOD proteins: regulators of inflammation in health and disease. Nature Rev Immunol 2014; 14:9-23; http://dx.doi.org/ 10.1038/nri3565 [DOI] [PubMed] [Google Scholar]
- [13].Caruso R, Warner N, Inohara N, Nunez G. NOD1 and NOD2: signaling, host defense, and inflammatory disease. Immunity 2014; 41:898-908; PMID:25526305; http://dx.doi.org/ 10.1016/j.immuni.2014.12.010 [DOI] [PMC free article] [PubMed] [Google Scholar]
- [14].Ramos-Morales F. Impact of Salmonella enterica Type III secretion system effectors on the eukaryotic host cell. ISRN Cell Biol 2012; 2012:1-36; http://dx.doi.org/ 10.5402/2012/787934 [DOI] [Google Scholar]
- [15].Keestra AM, Winter MG, Klein-Douwel D, Xavier MN, Winter SE, Kim A, Tsolis RM, Bäumler AJ. A Salmonella virulence factor activates the NOD1/NOD2 signaling pathway. mBio 2011; 2:pii: e00266-11; PMID:22186610; http://dx.doi.org/ 10.1128/mBio.00266-11 [DOI] [PMC free article] [PubMed] [Google Scholar]
- [16].Keestra AM, Winter MG, Auburger JJ, Frassle SP, Xavier MN, Winter SE, Kim A, Poon V, Ravesloot MM, Waldenmaier JF, et al.. Manipulation of small Rho GTPases is a pathogen-induced process detected by NOD1. Nature 2013; 496:233-7; PMID:23542589; http://dx.doi.org/ 10.1038/nature12025 [DOI] [PMC free article] [PubMed] [Google Scholar]
- [17].Bruno VM, Hannemann S, Lara-Tejero M, Flavell RA, Kleinstein SH, Galán JE. Salmonella Typhimurium type III secretion effectors stimulate innate immune responses in cultured epithelial cells. PLoS Pathog 2009; 5:e1000538; PMID:19662166; http://dx.doi.org/ 10.1371/journal.ppat.1000538 [DOI] [PMC free article] [PubMed] [Google Scholar]
- [18].Ye Z, Petrof EO, Boone D, Claud EC, Sun J. Salmonella effector AvrA regulation of colonic epithelial cell inflammation by deubiquitination. Am J Pathol 2007; 171:882-92; PMID:17690189; http://dx.doi.org/ 10.2353/ajpath.2007.070220 [DOI] [PMC free article] [PubMed] [Google Scholar]
- [19].Haraga A, Miller SI. A Salmonella enterica serovar typhimurium translocated leucine-rich repeat effector protein inhibits NF-kappa B-dependent gene expression. Infect Immun 2003; 71:4052-8; PMID:12819095; http://dx.doi.org/ 10.1128/IAI.71.7.4052-4058.2003 [DOI] [PMC free article] [PubMed] [Google Scholar]
- [20].Le Negrate G, Faustin B, Welsh K, Loeffler M, Krajewska M, Hasegawa P, Mukherjee S, Orth K, Krajewski S, Godzik A, et al.. Salmonella secreted factor L deubiquitinase of Salmonella typhimurium inhibits NF-kappaB, suppresses IkappaBalpha ubiquitination and modulates innate immune responses. J Immunol 2008; 180:5045-56; PMID:18354230; http://dx.doi.org/ 10.4049/jimmunol.180.7.5045 [DOI] [PubMed] [Google Scholar]
- [21].Haraga A, Miller SI. A Salmonella type III secretion effector interacts with the mammalian serine/threonine protein kinase PKN1. Cell Microbiol 2006; 8:837-46; PMID:16611232; http://dx.doi.org/ 10.1111/j.1462-5822.2005.00670.x [DOI] [PubMed] [Google Scholar]
- [22].Pilar AV, Reid-Yu SA, Cooper CA, Mulder DT, Coombes BK. GogB is an anti-inflammatory effector that limits tissue damage during Salmonella infection through interaction with human FBXO22 and Skp1. PLoS Pathog 2012; 8:e1002773; PMID:22761574; http://dx.doi.org/ 10.1371/journal.ppat.1002773 [DOI] [PMC free article] [PubMed] [Google Scholar]
- [23].Mesquita FS, Holden DW, Rolhion N. Lack of effect of the Salmonella deubiquitinase SseL on the NF-kappaB pathway. PLoS One 2013; 8:e53064; PMID:23308136; http://dx.doi.org/ 10.1371/journal.pone.0053064 [DOI] [PMC free article] [PubMed] [Google Scholar]
- [24].Sun H, Kamanova J, Lara-Tejero M, Galan JE. A family of Salmonella Type III secretion effector proteins selectively targets the NF-kappaB signaling pathway to preserve host homeostasis. PLoS Pathog 2016; 12:e1005484; PMID:26933955; http://dx.doi.org/ 10.1371/journal.ppat.1005484 [DOI] [PMC free article] [PubMed] [Google Scholar]
- [25].Hoffmann A, Levchenko A, Scott ML, Baltimore D. The IkappaB-NF-kappaB signaling module: temporal control and selective gene activation. Science 2002; 298:1241-5; PMID:12424381; http://dx.doi.org/ 10.1126/science.1071914 [DOI] [PubMed] [Google Scholar]
- [26].Bosisio D, Marazzi I, Agresti A, Shimizu N, Bianchi ME, Natoli G. A hyper-dynamic equilibrium between promoter-bound and nucleoplasmic dimers controls NF-kappaB-dependent gene activity. EMBO J 2006; 25:798-810; PMID:16467852; http://dx.doi.org/ 10.1038/sj.emboj.7600977 [DOI] [PMC free article] [PubMed] [Google Scholar]
- [27].Sung MH, Salvatore L, De Lorenzi R, Indrawan A, Pasparakis M, Hager GL, Bianchi ME, Agresti A. Sustained oscillations of NF-kappaB produce distinct genome scanning and gene expression profiles. PLoS One 2009; 4:e7163; PMID:19787057; http://dx.doi.org/ 10.1371/journal.pone.0007163 [DOI] [PMC free article] [PubMed] [Google Scholar]
- [28].Nelson DE, Ihekwaba AE, Elliott M, Johnson JR, Gibney CA, Foreman BE, Nelson G, See V, Horton CA, Spiller DG, et al.. Oscillations in NF-kappaB signaling control the dynamics of gene expression. Science 2004; 306:704-8; PMID:15499023; http://dx.doi.org/ 10.1126/science.1099962 [DOI] [PubMed] [Google Scholar]
- [29].Tay S, Hughey JJ, Lee TK, Lipniacki T, Quake SR, Covert MW. Single-cell NF-kappaB dynamics reveal digital activation and analogue information processing. Nature 2010; 466:267-71; PMID:20581820; http://dx.doi.org/ 10.1038/nature09145 [DOI] [PMC free article] [PubMed] [Google Scholar]
- [30].Zambrano S, Bianchi ME, Agresti A. High-throughput analysis of NF-kappaB dynamics in single cells reveals basal nuclear localization of NF-kappaB and spontaneous activation of oscillations. PLoS One 2014; 9:e90104; PMID:24595030; http://dx.doi.org/ 10.1371/journal.pone.0090104 [DOI] [PMC free article] [PubMed] [Google Scholar]
- [31].Levine JH, Lin Y, Elowitz MB. Functional roles of pulsing in genetic circuits. Science 2013; 342:1193-200; PMID:24311681; http://dx.doi.org/ 10.1126/science.1239999 [DOI] [PMC free article] [PubMed] [Google Scholar]
- [32].Bartfeld S, Engels C, Bauer B, Aurass P, Flieger A, Brüggemann H, Meyer TF. Temporal resolution of two-tracked NF-kappaB activation by Legionella pneumophila. Cell Microbiol 2009; 11:1638-51; PMID:19573161; http://dx.doi.org/ 10.1111/j.1462-5822.2009.01354.x [DOI] [PubMed] [Google Scholar]
- [33].Schulte LN, Eulalio A, Mollenkopf HJ, Reinhardt R, Vogel J. Analysis of the host microRNA response to Salmonella uncovers the control of major cytokines by the let-7 family. EMBO J 2011; 30:1977-89; PMID:21468030; http://dx.doi.org/ 10.1038/emboj.2011.94 [DOI] [PMC free article] [PubMed] [Google Scholar]
- [34].Westermann AJ, Forstner KU, Amman F, Barquist L, Chao Y, Schulte LN, Müller L, Reinhardt R, Stadler PF, Vogel J. Dual RNA-seq unveils noncoding RNA functions in host-pathogen interactions. Nature 2016; 529:496-501; PMID:26789254; http://dx.doi.org/ 10.1038/nature16547 [DOI] [PubMed] [Google Scholar]
- [35].Pilar AV, Reid-Yu SA, Cooper CA, Mulder DT, Coombes BK. Active modification of host inflammation by Salmonella. Gut Microb 2013; 4:140-5; http://dx.doi.org/ 10.4161/gmic.23361 [DOI] [PMC free article] [PubMed] [Google Scholar]
- [36].de Lorenzi R, Gareus R, Fengler S, Pasparakis M. GFP-p65 knock-in mice as a tool to study NF-kappaB dynamics in vivo. Genesis 2009; 75:323-9; http://dx.doi.org/ 10.1002/dvg.20468 [DOI] [PubMed] [Google Scholar]
- [37].Zambrano S, De Toma I, Piffer A, Bianchi ME, Agresti A. NF-kappaB oscillations translate into functionally related patterns of gene expression. Elife 2016; 5:e09100; PMID:26765569; http://dx.doi.org/ 10.7554/eLife.09100 [DOI] [PMC free article] [PubMed] [Google Scholar]
- [38].Ashall L, Horton CA, Nelson DE, Paszek P, Harper CV, Sillitoe K, Ryan S, Spiller DG, Unitt JF, Broomhead DS, et al.. Pulsatile stimulation determines timing and specificity of NF-kappaB-dependent transcription. Science 2009; 324:242-6; PMID:19359585; http://dx.doi.org/ 10.1126/science.1164860 [DOI] [PMC free article] [PubMed] [Google Scholar]
- [39]. The Gilmore Lab. NF-kB Transcription Factors. Biology Department. Boston University. Boston, MA. United States. http://www.bu.edu/nf-kb/ [Google Scholar]
- [40].Li X, Zhao Y, Tian B, Jamaluddin M, Mitra A, Yang J, Rowicka M, Brasier AR, Kudlicki A. Modulation of gene expression regulated by the transcription factor NF-kappaB/RelA. J Biol Chem 2014; 289:11927-44; http://dx.doi.org/ 10.1074/jbc.M113.539965 [DOI] [PMC free article] [PubMed] [Google Scholar]
- [41].Subramanian A, Tamayo P, Mootha VK, Mukherjee S, Ebert BL, Gillette MA, Paulovich A, Pomeroy SL, Golub TR, Lander ES, et al.. Gene set enrichment analysis: a knowledge-based approach for interpreting genome-wide expression profiles. Proc Natl Acad Sci USA 2005; 102:15545-50; PMID:16199517; http://dx.doi.org/ 10.1073/pnas.0506580102 [DOI] [PMC free article] [PubMed] [Google Scholar]
- [42].Mootha VK, Lindgren CM, Eriksson KF, Subramanian A, Sihag S, Lehar J, Puigserver P, Carlsson E, Ridderstråle M, Laurila E, et al.. PGC-1alpha-responsive genes involved in oxidative phosphorylation are coordinately downregulated in human diabetes. Nature Gen 2003; 34:267-73; http://dx.doi.org/ 10.1038/ng1180 [DOI] [PubMed] [Google Scholar]
- [43]. NF-κB signalling pathway (human). National Cancer Institute. U.S. National Institutes of Health. Cancer Genome Anatomy Project (CGAP). http://cgap.nci.nih.gov/Pathways/BioCarta/h_nfkbPathway. [Google Scholar]
- [44]. NF-κB signalling pathway (mouse). National Cancer Institute. U.S. National Institutes of Health. Cancer Genome Anatomy Project (CGAP). http://cgap.nci.nih.gov/Pathways/BioCarta/m_nfkbPathway. [Google Scholar]
- [45].Oeckinghaus A, Ghosh S. The NF-kappaB family of transcription factors and its regulation. Cold Spring Harb Perspect Biol 2009; 1:a000034; PMID:20066092; http://dx.doi.org/ 10.1101/cshperspect.a000034 [DOI] [PMC free article] [PubMed] [Google Scholar]
- [46].Porritt RA, Hertzog PJ. Dynamic control of type I IFN signalling by an integrated network of negative regulators. Trends Immunol 2015; 36:150-60; PMID:25725583; http://dx.doi.org/ 10.1016/j.it.2015.02.002 [DOI] [PubMed] [Google Scholar]
- [47].O'Dea EL, Barken D, Peralta RQ, Tran KT, Werner SL, Kearns JD, Levchenko A, Hoffmann A. A homeostatic model of IkappaB metabolism to control constitutive NF-kappaB activity. Mol Syst Biol 2007; 3:111; PMID:17486138; http://dx.doi.org/ 10.1038/msb4100148 [DOI] [PMC free article] [PubMed] [Google Scholar]
- [48].Drecktrah D, Knodler LA, Galbraith K, Steele-Mortimer O. The Salmonella SPI1 effector SopB stimulates nitric oxide production long after invasion. Cell Microbiol 2005; 7:105-13; PMID:15617527; http://dx.doi.org/ 10.1111/j.1462-5822.2004.00436.x [DOI] [PubMed] [Google Scholar]
- [49].Knodler LA, Finlay BB, Steele-Mortimer O. The Salmonella effector protein SopB protects epithelial cells from apoptosis by sustained activation of Akt. J Biol Chem 2005; 280:9058-64; PMID:15642738; http://dx.doi.org/ 10.1074/jbc.M412588200 [DOI] [PubMed] [Google Scholar]
- [50].Lawson C, Wolf S. ICAM-1 signaling in endothelial cells. Pharmacol Rep 2009; 61:22-32; PMID:19307690; http://dx.doi.org/ 10.1016/S1734-1140(09)70004-0 [DOI] [PubMed] [Google Scholar]
- [51].Dietrich M, Bartfeld S, Munke R, Lange C, Ogilvie LA, Friedrich A, Meyer TF. Activation of NF-kappaB by Neisseria gonorrhoeae is associated with microcolony formation and type IV pilus retraction. Cell Microbiol 2011; 13:1168-82; PMID:21615661; http://dx.doi.org/ 10.1111/j.1462-5822.2011.01607.x [DOI] [PubMed] [Google Scholar]
- [52].Bartfeld S, Hess S, Bauer B, Machuy N, Ogilvie LA, Schuchhardt J, Meyer TF. High-throughput and single-cell imaging of NF-kappaB oscillations using monoclonal cell lines. BMC Cell Biol 2010; 11:21; PMID:20233427; http://dx.doi.org/ 10.1186/1471-2121-11-21 [DOI] [PMC free article] [PubMed] [Google Scholar]
- [53].Cano DA, Martinez-Moya M, Pucciarelli MG, Groisman EA, Casadesus J, García-del Portillo F. Salmonella enterica serovar Typhimurium response involved in attenuation of pathogen intracellular proliferation. Infect Immun 2001; 69:6463-74; PMID:11553591; http://dx.doi.org/ 10.1128/IAI.69.10.6463-6474.2001 [DOI] [PMC free article] [PubMed] [Google Scholar]
- [54].Frobose H, Ronn SG, Heding PE, Mendoza H, Cohen P, Mandrup-Poulsen T, Billestrup N. Suppressor of cytokine Signaling-3 inhibits interleukin-1 signaling by targeting the TRAF-6/TAK1 complex. Mol Endocrinol 2006; 20:1587-96; PMID:16543409; http://dx.doi.org/ 10.1210/me.2005-0301 [DOI] [PubMed] [Google Scholar]
- [55].Datsenko KA, Wanner BL. One-step inactivation of chromosomal genes in Escherichia coli K-12 using PCR products. Proc Natl Acad Sci USA 2000; 97:6640-5; PMID:10829079; http://dx.doi.org/ 10.1073/pnas.120163297 [DOI] [PMC free article] [PubMed] [Google Scholar]
- [56].Schmieger H. Phage P22-mutants with increased or decreased transduction abilities. Mol Gen Genet 1972; 119:75-88; PMID:4564719; http://dx.doi.org/ 10.1007/BF00270447 [DOI] [PubMed] [Google Scholar]
- [57].Maloy SR. In: Maloy SR, ed. Experimental tecnhiques in bacterial genetics. Boston, MA: Jones & Barlett, 1990. [Google Scholar]
- [58].Chan RK, Botstein D, Watanabe T, Ogata Y. Specialized transduction of tetracycline resistance by phage P22 in Salmonella typhimurium. II. Properties of a high-frequency-transducing lysate. Virology 1972; 50:883-98; PMID:4565618; http://dx.doi.org/ 10.1016/0042-6822(72)90442-4 [DOI] [PubMed] [Google Scholar]
- [59].Aiastui A, Pucciarelli MG, García-del Portillo F. Salmonella enterica serovar typhimurium invades fibroblasts by multiple routes differing from the entry into epithelial cells. Infect Immun 2010; 78:2700-13; PMID:20368348; http://dx.doi.org/ 10.1128/IAI.01389-09 [DOI] [PMC free article] [PubMed] [Google Scholar]
- [60]. BioinfoGP. Bioinformatics for Genomics and Proteomics. Centro Nacional de Biotecnología. CSIC. Madrid. Spain. FIESTA viewer. http://bioinfogp.cnb.csic.es/tools/FIESTA/index.php. [Google Scholar]
- [61]. Rel/NF-kappaB target genes. Institut de Biologie de Lille et LIFL, France. Feb 2004. K. Gosselin, H. Touzet, C. Abbadie. http://bioinfo.lifl.fr/NF-KB/ [Google Scholar]
- [62].Cano DA, Dominguez-Bernal G, Tierrez A, García-del Portillo F, Casadesús J. Regulation of capsule synthesis and cell motility in Salmonella enterica by the essential gene igaA. Genetics 2002; 162:1513-23; PMID:12524328 [DOI] [PMC free article] [PubMed] [Google Scholar]
- [63].Ye J, Coulouris G, Zaretskaya I, Cutcutache I, Rozen S, Madden TL. Primer-BLAST: a tool to design target-specific primers for polymerase chain reaction. BMC Bioinformatics 2012; 13:134; PMID:22708584; http://dx.doi.org/ 10.1186/1471-2105-13-134 [DOI] [PMC free article] [PubMed] [Google Scholar]
- [64]. National Center for Biotechnology Information (NCBI). U.S. National Library of Medicine. Bethesda MD, USA. Gene Expression Omnibus (GEO). http://www.ncbi.nlm.nih.gov/geo/ [Google Scholar]
Associated Data
This section collects any data citations, data availability statements, or supplementary materials included in this article.