Abstract
The incidence of diabetes mellitus is rising worldwide, and prediabetic screening for insulin resistance (IR) has become ever more essential. This study aimed to investigate whether body mass index (BMI), waist circumference (WC), or body fat percentage (BF%) could be a better predictor of IR in a middle-aged and elderly population. In this cross-sectional, community-based study, 394 individuals (97 with IR and 297 without IR) were enrolled in the analysis. IR was measured by homeostasis model assessment (HOMA-IR), and subjects with HOMA-IR value ≧75th percentile were defined as being IR. Associations between IR and BMI, WC and BF% were evaluated by t test, chi square, Pearson correlation, logistic regression, and receiver operating characteristic (ROC) curves. A total of 394 community-dwelling, middle-aged, and elderly persons were enrolled; 138 (35%) were male, and 256 were female (65%). The mean age was 64.41 ± 8.46 years. A significant association was identified between BMI, WC, BF%, and IR, with Pearson correlation coefficients of 0.437 (P < .001), 0.412 (P < .001), and 0.361 (P < .001), respectively. Multivariate logistic regression revealed BMI (OR = 1.31; 95% CI = 1.20–1.42), WC (OR = 1.13; 95% CI = 1.08–1.17), and BF% (OR = 1.17; 95% CI = 1.11–1.23) to be independent predictors of IR. The area under curves of BMI and WC, 0.749 and 0.745 respectively, are greater than that of BF% 0.687. BMI and WC were more strongly associated with IR than was BF%. Excess body weight and body fat distribution were more important than total body fat in predicting IR.
Keywords: body fat distribution, body mass index, diabetes mellitus, insulin resistance, obesity, waist circumference
1. Introduction
The incidence of diabetes mellitus (DM) is increasing rapidly worldwide, threatening to reduce life expectancy around the globe. The International Diabetes Federation (IDF) has estimated that, by 2040, 642 million people will be living with the disease, in addition to some 320 million who will have undiagnosed DM.[1] Thus, pre-DM screening is a critical issue.
Insulin resistance (IR) has emerged as a major pathophysiological factor in the development and progression of DM and metabolic disease.[2] Numerous studies have shown that the incidence of IR in the elderly ranges from 35% to 50%.[3] Many of the current methods for quantifying the extension of IR, the gold standard of these quantification methods is respected as the hyperinsulinemic normal blood glucose clamp. Although the hyperinsulinemic normal blood glucose clamp provides the benefits of IR for clinical practice (ie, dynamic and accurate assessment), the drawbacks show that procedures are expensive, aggressive, and also time-consuming to bring nonconformity for clinical convenience or large-scale researches.[4] These reasons also trigger to the development of the homeostasis model assessment of IR (HOMA-IR) which to provide alternatively a convenient, trusted, and cost-effective clamp.[5,6]
Although the cause of IR is still unknown, it has a close correlation with obesity.[7] Obesity can be defined by measuring the individual's body mass index (BMI) by dividing his or her weight by the square of height (kg/m2). There is increasing evidence that fat distribution, especially in the abdominal area, is correlated with the most severe state of IR.[8–11] Waist circumference (WC) is defined by the IDF worldwide consensus as the criteria for abdominal obesity.[12] Additionally, as an endocrine organ, adipose tissue can secrete free fatty acids and adipocytokines such as tumor necrosis factor-alpha (TNF-α) and leptin, which can interfere with the insulin-signaling system and induce IR.[2] Therefore, the amount of total body fat percentage (BF%) may also play an important role in pathogenesis of IR.
The aim of this study was to investigate the association between 3 common obesity indices, BMI, WC, and BF%, to identify a simple diagnostic indicator for predicting IR among middle-aged and elderly populations.
2. Methods
2.1. Study design and study subjects
This was a cross-sectional, community-based study. Data for this study were collected from a community health promotion project of Linkou Chang Gung Memorial Hospital, Taiwan, between March and August 2014. The 400 participants were 50 to 90 year-olds and enrolled from the residents of Guishan district, Taoyuan City, Taiwan through a poster promotion or through notification from the community office. Such enrolled data through project stored and managed solely to Chang Gung Memorial Hospital in Linkou. Note that data cannot be publicly deposited. Each participant completed a questionnaire during a face-to-face interview. The questionnaire included the individual's personal information and medical history. Anthropometric measurements were taken, and blood sampling was performed by trained research assistants or nurses, under the supervision of a medical doctor. The project was approved by the Institutional Review Board of Linkou Chang Gung Memorial Hospital, and all participants provided written informed consent before enrolling in the study. Participants whose data were missing or incomplete were excluded from the study. The final group enrolled in the analysis included 394 participants.
2.2. Anthropometric and laboratory measurements
Anthropometric data, such as height, weight, BMI, WC, and blood pressures (BP), were measured. Height was measured using calibrated height meters while the participant stood erect and in bare feet, with the feet placed together and pointing forward. The weight scale was calibrated daily using two 20-kg standard weights. BMI was calculated as weight divided by the square of height (kg/m2). WC was measured at a level midway between the iliac crest and the lower border of the 12th rib while the participant stood with his or her feet 25 to 30 cm apart. BF% was measured using an 8-contact electrode bioelectrical impedance analysis (BIA) device (Tanita BC-418 Body Composition Analyzer, Tanita, Tokyo, Japan). Blood pressure was measured after a 10-minute rest, with the participant seated, using an automated sphygmomanometer placed on the participant's right arm. The lowest of 3 readings was recorded. Prior to blood samples being taken, participants were asked to fast for at least 12 hours and to avoid consuming high-fat meals or alcohol for at least 24 hours prior to blood samples being taken. Venous blood samples were obtained between 7 and 10 AM, and were stored in a refrigerator at 4 °C prior to analysis in the hospital laboratory. The clinical biochemistry workup included measurement of fasting plasma glucose (FPG), high-density lipoprotein cholesterol (HDL-C), low-density lipoprotein cholesterol, total cholesterol, and triglyceride (TG) levels. The tests were performed in a hospital laboratory accredited by the College of American Pathologists.
2.3. Definition of IR
IR was determined by HOMA and calculated using FPG and fasting insulin levels for each participant, using the following formula: HOMA-IR = fasting glucose (mmol/L) × fasting insulin (mU/mL)/22.5. A HOMA value ≧75th percentile was used as the cutoff for defining the main outcome variable of IR. In our study, the cutoff value for IR was 2.3.
2.4. Statistical analysis
All continuous variables were expressed as the mean and standard deviation; categorical variables were expressed as numbers and percentages. In univariate analysis, the independent t test and chi-square test were used to compare variables between IR and non-IR groups. Pearson correlation coefficient was used to assess correlations between different obesity indices and IR. In multivariate analysis, binary logistic regression was used to adjust covariates. Receiver operating characteristic (ROC) curves were generated for WC, BMI, and BF% as predictors of IR. The area under the ROC curve (AUC) and the optimal cut-off points for IR prediction of BMI, WC, and BF% were determined by the largest sum of specificity and sensitivity. All tests were 2-sided, and the level of significance was established at P < .05. Data were analyzed using SPSS Statistics Version 22 (IBM, SPSS, Armonk, NY, IBM Corp).
3. Results
This study recruited 400 participants through poster promotion or notification from the community office. Four people with incomplete data and 2 people with extreme data, such as HOMA-IR: 440.94, 28.99, were excluded; the remaining 394 participants were enrolled in the study for analysis. The flow diagram is shown in Fig. 1.
Figure 1.
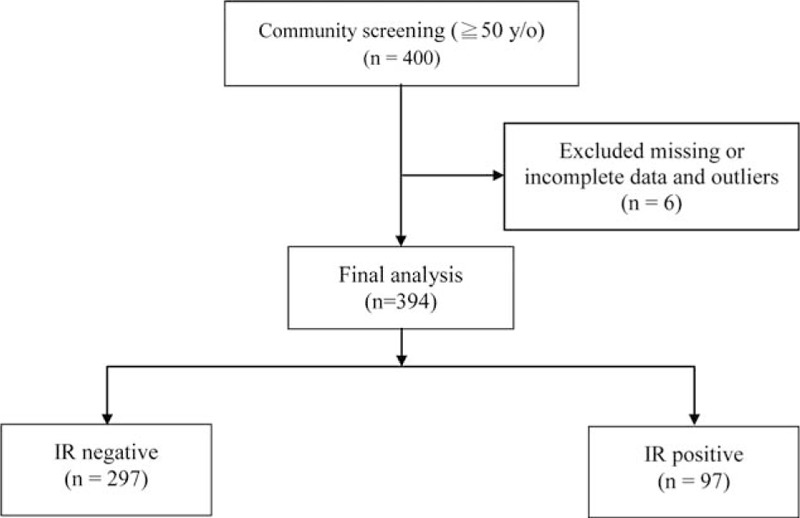
Flow diagram.
The general characteristics of the study participants are shown in Table 1. Among the 394 subjects, 97 (24.6%) developed IR. The final study group included 138 males (35%) and 256 females (65%), with a mean age of 64.41 ± 8.46 years. The overall percentage of participants reporting current smoking was 10.6%, while 19.5%, 50.3%, and 65.7% had DM, hypertension, and dyslipidemia, respectively. The average BMI, WC, and BF% were 24.55 ± 3.51(kg/m2), 85.04 ± 9.6 cm, and 30.02 ± 8.41%, respectively. The mean systolic (SBP) and diastolic BP measurements were 129.68 ± 16.7 and 77.11 ± 11.27 mm Hg, respectively. Overall, the mean FPG, HDL-C, low-density lipoprotein cholesterol, total cholesterol, and TG levels were 95.61 ± 22.4, 54.37 ± 13.79, 118.65 ± 32.23, 197.34 ± 35.79, and 121.81 ± 62.95 mg/dL, respectively. In those with IR, BMI, WC, and BF% were significantly higher than those without IR. In addition, SBP, FPG, HDL-C, and TG were also significantly different between the 2 groups.
Table 1.
General characteristics of participants in the IR and non-IR groups.
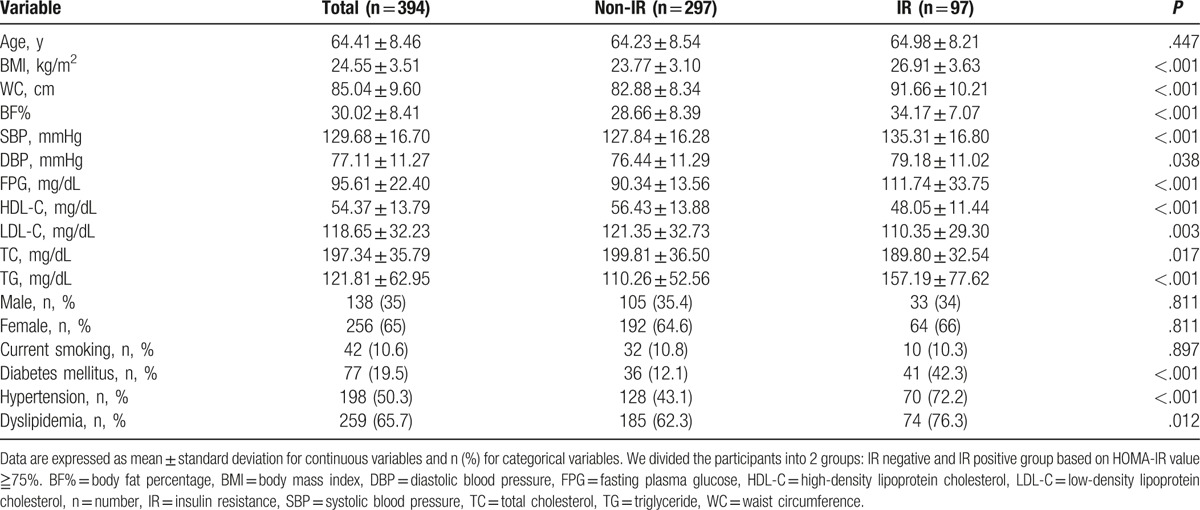
Table 2 demonstrates the correlations between different obesity indices and IR. All 3 obesity indices were positively associated with IR. Pearson correlation coefficients were 0.437, 0.412, and 0.361 for BMI, WC, and BF%, respectively. BMI and WC showed a stronger correlation with IR compared to BF%. Figures 2–4 demonstrate the associations of BMI, WC, BF%, and IR. There was a trend toward a positive correlation between all obesity indices and IR.
Table 2.
Correlations of IR with different obesity indices.

Figure 2.
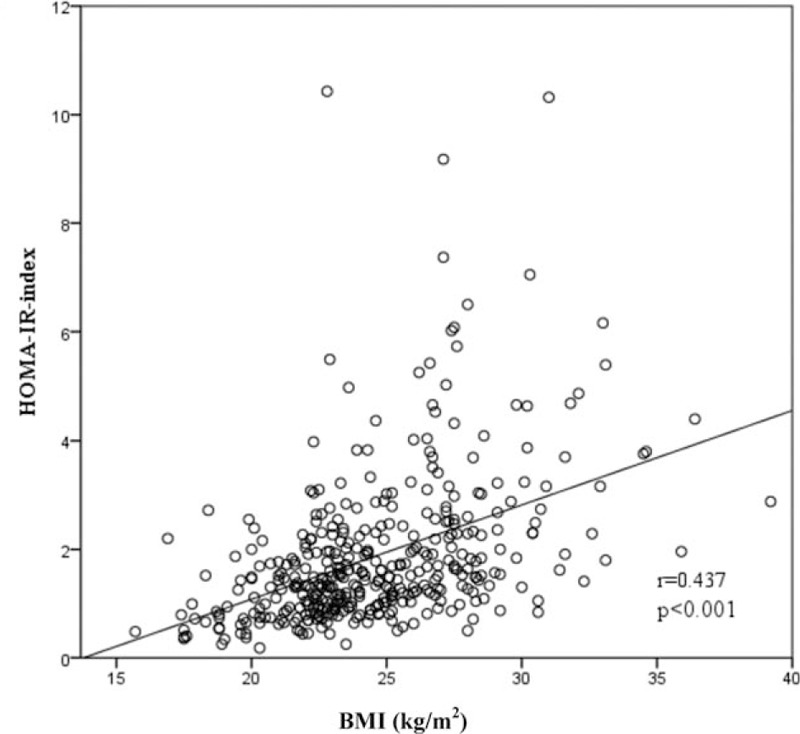
The correlation between BMI and IR. BMI = body mass index, IR = insulin resistance.
Figure 4.
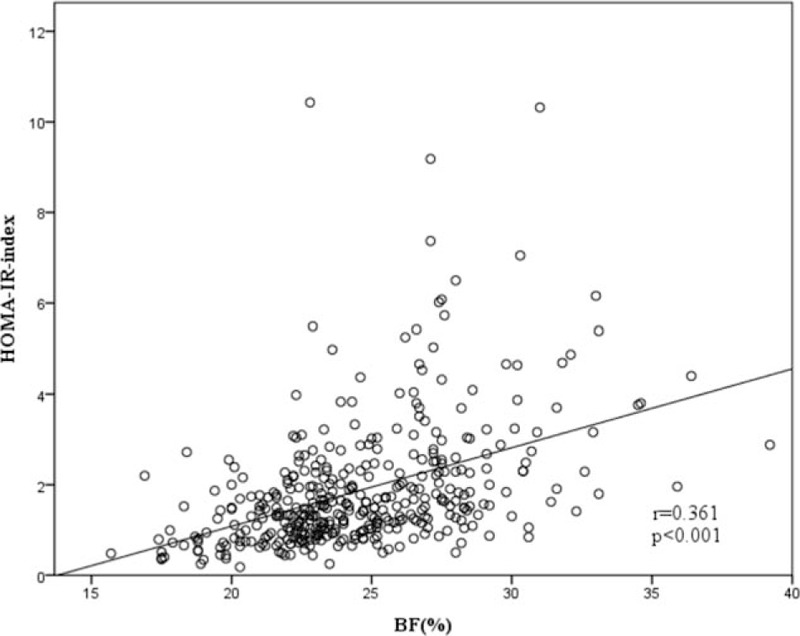
The correlation between BF% and IR. BF% = body fat percentage, IR = insulin resistance.
Figure 3.
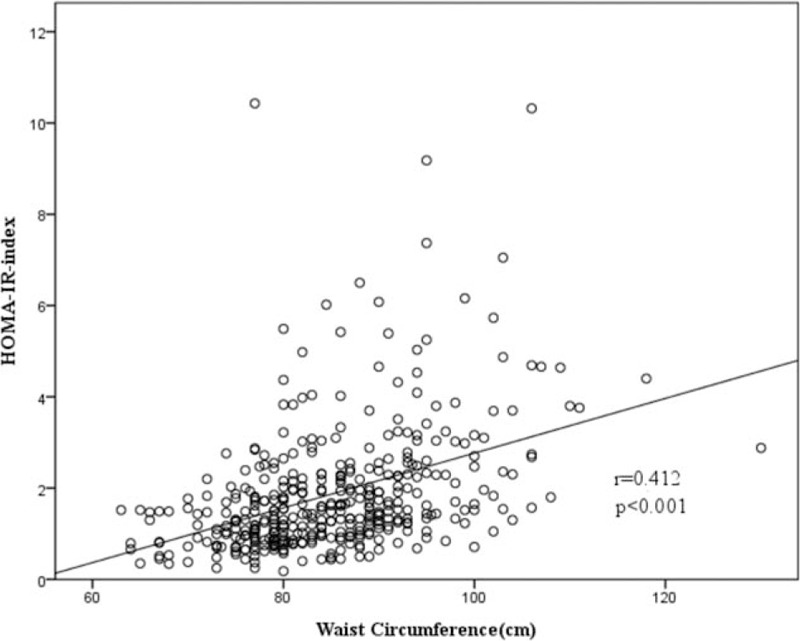
The correlation between WC and IR. IR = insulin resistance, WC = waist circumference.
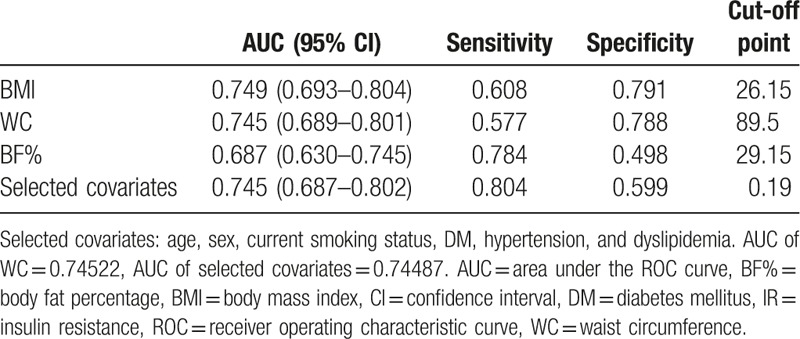
Table 3 displays the results of the binary logistic regression analyses, in which IR was the dependent variable, and obesity indices were the independent variables. Model 1 is a univariate binary logistic regression model, whereas models 2 and 3 are multivariate models that are adjusted for different covariates. In model 2, obesity indices were adjusted for age and sex. In model 3, obesity indices were adjusted for age, sex, current smoking status, DM, hypertension, and dyslipidemia. In all 3 models, BMI, WC, and BF% were significantly associated with IR. In model 3, BMI (odds ratio [OR]: 1.31; 95% confidence interval [CI]: 1.20–1.43; P < .001), WC (OR: 1.13; 95% CI: 1.08–1.17; P < .001), and BF% (OR: 1.17; 95% CI: 1.11–1.23; P < .001) were all significantly associated with IR. A 1-unit increase in BMI, WC, and BF% was, respectively, associated with a 30.6%, 12.5%, and 16.9% increase in risk of IR. Figure 5 shows the ROC curve of BMI, WC, BF%, and selected covariates as predictors of IR. In Table 4, the AUC of BMI, WC, and BF% were 0.749, 0.745, and 0.687, respectively. The AUC of selected covariates was 0.74487. BMI and WC had a better predictive performance for IR than BF% and selected covariates. The optimal cut-off point (for predicting IR) for BMI was 26.15 kg/m2 (sensitivity 0.608, specificity 0.791), for WC was 89.5 cm (sensitivity 0.577, specificity 0.788), and for BF% was 29.15% (sensitivity 0.784, specificity 0.498).
Table 3.
Binary logistic regression of obesity indices and IR.
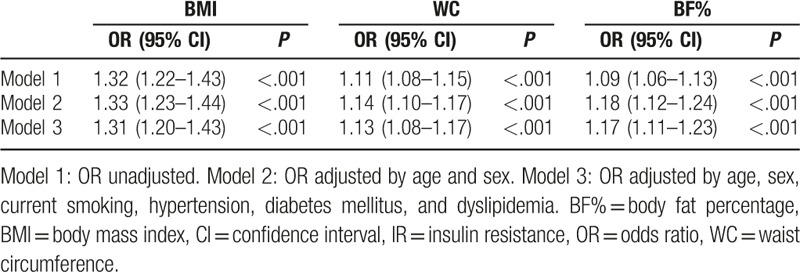
Figure 5.
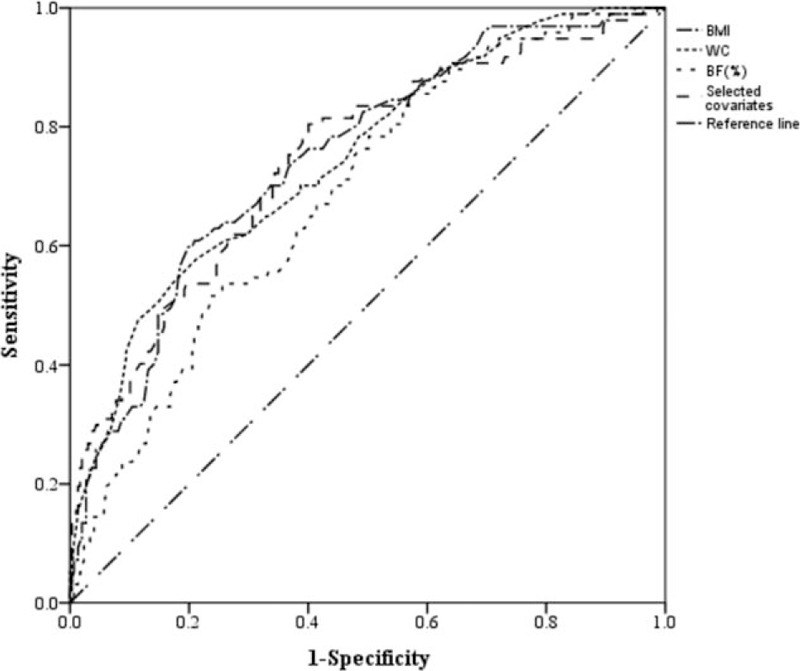
ROC curves for WC, BMI, BF%, and selected covariates as predictors of IR. BF% = body fat percentage, BMI = body mass index, IR = insulin resistance, ROC = receiver operating characteristic curve, WC = waist circumference.
Table 4.
The AUC, sensitivity, and specificity by the optimized cut-off point of different obesity indices in predicting IR.
4. Discussion
In this study of middle-aged and elderly Taiwanese subjects, the cut-off value of HOMA-IR was 2.3, which approximates the 2.29 established in an earlier 1156-person Caucasian population study.[1,13] The results of our study show that 3 obesity indices – BMI, WC, and BF% – are all significantly associated with IR in univariate analysis, while BMI and WC had higher correlation coefficients compared with BF%. After adjusting for covariates such as age, sex, current cigarette smoking status, hypertension, DM, and dyslipidemia, BMI, WC, and BF% remained significantly associated with IR. Further, the AUCs of BMI and WC were larger than that of BF%. In addition, we selected age, sex, current smoking status, DM, hypertension, and dyslipidemia as covariates to predict IR (ROC curve plotted in Fig. 5). The AUCs of BMI and WC were larger than that of selected covariates. We may use BMI and WC to predict IR rather than selected covariates. It means that BMI and WC may be more representative than selected covariates of prediction of IR. Similar result was observed in a Japanese employee general health checkup study, which demonstrated that BMI was more important in predicting IR than hypertension and hypertriglyceridemia.[14] Moreover, based on the findings from a study of 2746 healthy volunteers, WC was suggested to be used as the stronger predictor of IR than dyslipidemia and SBP.[15] The cutoff values of BMI and WC to predict IR were 26.15 kg/m2 and 89.5 cm, respectively, which nearly meet the obesity criteria (BMI: 27 kg/m2, WC: 90 cm in males and 80 cm in females) set by the Taiwan Ministry of Health and Welfare-Health Promotion Administration. These results reinforce the relationship between IR and obesity, and we suggest that overweight and obese persons should be made aware of the risk of IR and standardly screened for cardiovascular and metabolic disease in advance of symptoms.
Previous studies have reported the correlation between the obesity index and IR, but some results have been inconsistent.[16–19] Samouda et al[16] demonstrated that adding the body fat distribution score to the BMI can improve the prediction of cardiometabolic, inflammatory, and adipokines profiles. This underscores the importance of BMI and WC for predicting IR and is in accordance with our study results. Results of a cross-sectional study led by González-Jiménez et al showed that subjects with abnormal HOMA-IR values had significantly higher BMI, body fat content, and WC, and multivariate logistic regression analysis showed the highest OR for BMI,[19] which is consistent with our study results. Results from a study of Korean high school students showed that HOMA-IR was significantly associated with BMI and WC in both sexes. However, this was true for BF% in male students only,[20] a fact that revealed the more generalized applicability of BMI and WC in predicting IR. In contrast, in a Hispanic and African American adolescent population study, Wedin et al[21] found that instead of BMI, WC combined with BF% was the best predictor of IR. Sasaki et al[8] also disclosed that in a Japanese male population with normal BMIs, BF(%) was associated with increased IR, while WC was not. Taken together, the results showed that predictions about IR may be influenced by ethnic background, age, and gender-related body composition. To the best of our knowledge, our study is one of the very few to study the correlation between 3 obesity indices and IR in Asian middle-aged and elderly adults.
To summarize, our study results revealed that obesity indices like BMI and WC are better predictors of IR than BF%, that is, excess body weight and body fat distribution are more important than total body fat for predicting IR. In addition, Ganpule-Rao et al[22] demonstrated that some complex measurements, such as magnetic resonance imaging, dual-energy X-ray absorptiometry, and computed tomography contribute only a small amount to the prediction of IR. Anthropometric measurements are better predictors of IR than other advanced tools, which also highlight the importance of these simple, traditional measures.
Our study had a few limitations. First, this was a cross-sectional study; thus, the causal relationship between obesity indices (like BMI, WC, and BF%) and IR could not be evaluated and determined. Second, the number of participants in this study was relatively small, and they were recruited from a single community, so selection bias should be considered.
5. Conclusion
The results of this study demonstrate that obesity indices like BMI and WC are stronger surrogate markers than BF% for predicting IR. Individuals with high BMI or WC require more aggressive lifestyle modifications and primary prevention of diabetes, cardiovascular disease, and metabolic disease. BMI and WC are 2 obesity indices that are effective, inexpensive, and noninvasive. They are also easily measurable, which can help the primary care physician in primary prevention and earlier intervention against diabetes and metabolic diseases among middle-aged and elderly populations.
Acknowledgments
The authors thank Chang Gung Memorial Hospital (CORPG3C0171-CORPG3C0172, CZRPG3C0053) for the support.
Footnotes
Abbreviations: AUC = area under the ROC curve, BF% = body fat percentage, BMI = body mass index, FPG = fasting plasma glucose, HDL-C = high-density lipoprotein cholesterol, HOMA-IR = homeostasis model assessment, IR = insulin resistance, SBP = systolic blood pressure, TG = triglyceride, WC = waist circumference.
Authorship: YHC was involved in writing of the manuscript and analyzed the data. YCT, HHC, and WCL conceived and supervised the study. IST provided statistical advice. THT provided statistical advice and analyzed the data. JYC contributed conceived, designed and performed the experiments, collected and analyzed the data, and revised it critically for important intellectual content and final approval of the version to be submitted.
Funding/support: This work was supported by Chang Gung Memorial Hospital (CORPG3C0171-CORPG3C0172, CZRPG3C0053).
The authors have no conflicts of interest to disclose.
References
- [1].Tang Q, Li X, Song P, et al. Optimal cut-off values for the homeostasis model assessment of insulin resistance (HOMA-IR) and pre-diabetes screening: developments in research and prospects for the future. Drug Discov Ther 2015;9:380–5. [DOI] [PubMed] [Google Scholar]
- [2].Xia C, Li R, Zhang S, et al. Lipid accumulation product is a powerful index for recognizing insulin resistance in non-diabetic individuals. Eur J Clin Nutr 2012;66:1035–8. [DOI] [PubMed] [Google Scholar]
- [3].Dwimartutie N, Setiati S, Oemardi M. The correlation between body fat distribution and insulin resistance in elderly. Acta Med Indones 2010;42:66–73. [PubMed] [Google Scholar]
- [4].Keskin M, Kurtoglu S, Kendirci M, et al. Homeostasis model assessment is more reliable than the fasting glucose/insulin ratio and quantitative insulin sensitivity check index for assessing insulin resistance among obese children and adolescents. Pediatrics 2005;115:e500–3. [DOI] [PubMed] [Google Scholar]
- [5].DeFronzo RA, Tobin JD, Andres R. Glucose clamp technique: a method for quantifying insulin secretion and resistance. Am J Physiol 1979;237:G214–23. [DOI] [PubMed] [Google Scholar]
- [6].Bonora E, Targher G, Alberiche M, et al. Homeostasis model assessment closely mirrors the glucose clamp technique in the assessment of insulin sensitivity: studies in subjects with various degrees of glucose tolerance and insulin sensitivity. Diabetes Care 2000;23:57–63. [DOI] [PubMed] [Google Scholar]
- [7].Balsan GA, Vieira JL, Oliveira AM, et al. Relationship between adiponectin, obesity and insulin resistance. Rev Assoc Méd Bras 2015;61:72–80. [DOI] [PubMed] [Google Scholar]
- [8].Sasaki R, Yano Y, Yasuma T, et al. Association of waist circumference and body fat weight with insulin resistance in male subjects with normal body mass index and normal glucose tolerance. Intern Med 2016;55:1425–32. [DOI] [PubMed] [Google Scholar]
- [9].Premanath M, Basavanagowdappa H, Mahesh M, et al. Correlation of abdominal adiposity with components of metabolic syndrome, anthropometric parameters and Insulin resistance, in obese and non obese, diabetics and non diabetics: a cross sectional observational study. (Mysore Visceral Adiposity in Diabetes Study). Indian J Endocrinol Metab 2014;18:676–82. [DOI] [PMC free article] [PubMed] [Google Scholar]
- [10].Patel P, Abate N. Body fat distribution and insulin resistance. Nutrients 2013;5:2019–27. [DOI] [PMC free article] [PubMed] [Google Scholar]
- [11].Garg A. Regional adiposity and insulin resistance. J Clin Endocrinol Metab 2004;89:4206–10. [DOI] [PubMed] [Google Scholar]
- [12].Alberti KG, Eckel RH, Grundy SM, et al. Harmonizing the Metabolic Syndrome A Joint Interim Statement of the International Diabetes Federation Task Force on Epidemiology and Prevention; National Heart, Lung, and Blood Institute; American Heart Association; World Heart Federation; International Atherosclerosis Society; and International Association for the Study of Obesity. Circulation 2009;120:1640–5. [DOI] [PubMed] [Google Scholar]
- [13].Radikova Z, Koska J, Huckova M, et al. Insulin sensitivity indices: a proposal of cut-off points for simple identification of insulin-resistant subjects. Exp Clin Endocrinol Diabetes 2006;114:249–56. [DOI] [PubMed] [Google Scholar]
- [14].Takahara M, Katakami N, Kaneto H, et al. Prediction of the presence of insulin resistance using general health checkup data in japanese employees with metabolic risk factors. J Atheroscler Thromb 2014;21:38–48. [DOI] [PubMed] [Google Scholar]
- [15].Wahrenberg H, Hertel K, Leijonhufvud BM, et al. Use of waist circumference to predict insulin resistance: retrospective study. BMJ 2005;330:1363–4. [DOI] [PMC free article] [PubMed] [Google Scholar]
- [16].Samouda H, de Beaufort C, Stranges S, et al. Adding anthropometric measures of regional adiposity to BMI improves prediction of cardiometabolic, inflammatory and adipokines profiles in youths: a cross-sectional study. BMC Pediatr 2015;15:168. [DOI] [PMC free article] [PubMed] [Google Scholar]
- [17].Keswell D, Tootla M, Goedecke JH. Associations between body fat distribution, insulin resistance and dyslipidaemia in black and white South African women. Cardiovasc J Afr 2016;27:1–7. [DOI] [PMC free article] [PubMed] [Google Scholar]
- [18].Telford RD, Cunningham RB, Telford RM, et al. Effects of changes in adiposity and physical activity on preadolescent insulin resistance: The Australian LOOK longitudinal study. PLoS One 2012;7:e47438. [DOI] [PMC free article] [PubMed] [Google Scholar]
- [19].González-Jiménez E, Schmidt-RioValle J, Montero-Alonso MA, et al. Influence of biochemical and anthropometric factors on the presence of insulin resistance in adolescents. Biol Res Nurs 2016;18:541–8. [DOI] [PubMed] [Google Scholar]
- [20].Lim SM, Choi DP, Rhee Y, et al. Association between obesity indices and insulin resistance among Healthy Korean Adolescents: The JS High School Study. PLoS One 2015;10:e0125238. [DOI] [PMC free article] [PubMed] [Google Scholar]
- [21].Wedin WK, Diaz-Gimenez L, Convit AJ. Prediction of insulin resistance with anthropometric measures: lessons from a large adolescent population. Diabetes Metab Syndr Obes 2012;5:219–25. [DOI] [PMC free article] [PubMed] [Google Scholar]
- [22].Ganpule-Rao A, Joglekar C, Patkar D, et al. Associations of trunk fat depots with insulin resistance, β cell function and glycaemia – a multiple technique study. PLoS One 2013;8:e75391. [DOI] [PMC free article] [PubMed] [Google Scholar]


