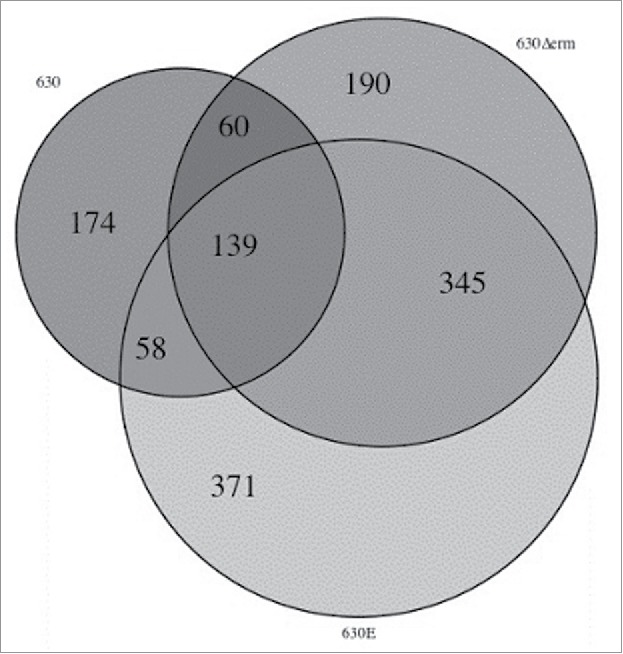
Figure 7.

Venn Diagram representing differentially expressed genes in the 3 different strains. The diagram summarizes the output from the RNAseq data, comparing strains 630, 630Δerm and 630E. It depicts all differentially expressed genes and shows how many genes are differentially expressed in all strains, in 2 of the strains or are unique to just one strain.
