Abstract
The effects of a single oral dose of liothyronine (L-T3) on thyroid stimulating hormone (TSH) and other related thyroid system parameters are partly understood despite therapeutic use of this hormone over many decades. We characterize individualized responses of the hypothalamus-pituitary-thyroid (HPT) axis and its related temporal hormonal profile using an electrical network model. Based on thyroid hormone responses from blood samples using a single 50 μg oral dose of liothyronine in healthy persons with a normal operating euthyroid feedback HPT system, we derived an equivalent electrical circuit model for the system's responses. The mathematical model was tested with a circuit simulator and validated with individualized clinical data. This signal processing technique makes the evaluation of bioequivalence and bioavailability of various preparations of liothyronine at an individualized level a feasible endeavor for clinical application.
Keywords: Signaling, Modeling, Characterization, Network, Simulation, Nonlinear
1. Introduction
A healthy thyroid produces mainly tetraiodothyronine (thyroxine or T4) which is largely considered a prohormone at a rate of about 75–100 μg daily and some triiodothyronine (T3) which is the main active thyroid hormone at a rate of 3–4 μg daily. Compared to a half-life of 21 h for triiodothyronine, the prolonged half-life of thyroxine (T4) of about seven days is largely due to its binding to the plasma thyroid hormone-binding proteins thyroxine-binding globulin (TBG), transthyretin (TTR), and albumin.1 These proteins, which shield the hydrophobic thyroid hormones from their aqueous environment, buffer a stable circulating free T4 (FT4) pool, which is available for cellular uptake. This free fraction of T4 (FT4) is subject to homeostatic control by the hypothalamic-pituitary-thyroid (HPT) axis where T4 is 99.98% bound and FT4 constitutes only 0.02% of the entire circulating T4 pool. It is estimated that less than 20% of circulating T3 is produced by the thyroid gland, while the majority of circulating T3 is generated by peripheral conversion of T4 at a rate of 20–30 μg per 24 h.2 The physiological availability of thyroid hormones is reflected by FT4 and FT3. In the following, we will denote the concentrations of the HPT hormones between [ ] brackets. The relationship between [FT4] and [T4] remains constant because of protein binding equilibrium mechanisms, which is similar for [FT3] and [T3].1 Upon release of T3 into the bloodstream, almost immediate binding to transport proteins results in a miniscule bioavailable concentration of physiologically active [FT3]. Normally, [FT4] is kept to a constant basal level by means of a negative feedback homeostatic control.3 This is accomplished by the sensitive, logarithmic-fold response of thyroid stimulating hormone concentrations [TSH] produced by the thyrotrophs in the anterior pituitary.3 A negative feedback mechanism over the HPT loop ensures a homeostatic equilibrium between [FT4] and [TSH]. A rising level of [FT4] triggers an increase in intracellular free T3 via 5′-deiodination and produces a decrement in [TSH] and vice versa. The values of these concentrations when the HPT system is in homeostatic equilibrium are defined as the homeostatic set point values of [FT4] and [TSH]4 and in both healthy people and patients with hypothyroidism also represents the euthyroid homeostatic set point.
Persons with hypothyroidism are normally treated with synthetic T4 or levothyroxine (L-T4), a pro-drug. Synthetic T3 or liothyronine (L-T3) is not routinely used to treat hypothyroidism due to its short half-life and perceived cardiovascular risks.1 The effects of chronic administration of L-T4 on the HPT axis have been well studied in hypothyroid individuals,5 but the effects of single doses L-T3 are not well known. Recent studies have been performed in healthy individuals in the context of pharmacokinetic effects or bioequivalence testing, usually over a period of 24 h.6 In a recent study,7 the effects on the HPT system of a single sustained release dose of 50 μg L-T3 (TriThroid®) in 12 healthy persons were investigated. During this study, the responses of [T3], [FT3], [TSH], [T4], and [FT4], respectively were measured at time intervals of 15 min during the 1st hour, 30 min till the 4th hour, 60 min thereafter to the 8th hour and larger intervals to the 96th hour. In every person, a different set of responses to the L-T3 oral bolus of 50 μg was recorded. Close inspection of the data plots revealed that the appearance and decay temporal profiles manifested serendipitous resemblance to the output characteristics observed in integrating electrical circuits.8 This motivated us to investigate the analysis of blood concentrations of the relevant analytes according to the methods of signal processing. The behavior of biological signals, analogous to the responses by the body upon exposure to a drug stimulus, can be modeled with an electrical circuit equivalent. The success of such an approach was demonstrated earlier in nerve impulse conduction9,10 and in glucose control modeling.11,12 The influence of the gastrointestinal tract (GIT) is thought to have a prominent effect on the dissolution behavior and release to the blood compartment of an ingested drug. This effect is demonstrated in the modeling results of our present treatise. Basically, the electrical network properties guided the mathematical formulation of the model and the verification of the results.8 The interaction analysis of more complex configurations in the endocrine system can be facilitated by the use of characterizable physiologic elements translated to electrical network elements.
The L-T3 response in 12 euthyroid participants from the Jonklaas study7 confirmed the expected normal regulatory constraints of the HPT control system.3,4 Our modeling approach is focused on individual responses to a 50 μg L-T3 stimulus. The advantage of this proposed modeling strategy is its tractability in deducing personalized model parameters guiding therapeutic solutions targeted to the specific individual.4 The validity of the model provides a set of future network element libraries that can be used in the analysis of more complex endocrine configurations with a circuit simulator. In this paper, we focus on the dynamic effects of [FT3] and [TSH].
2. Clinical Protocol
Healthy participants without thyroid disease were recruited for the study. Volunteers taking steroids, or any medications known to affect thyroid hormone metabolism, thyroid hormone absorption, or thyroxine-binding globulin were excluded. Women who were pregnant, lactating, or taking oral contraceptives were ineligible. All participants were in general good health based on the results of medical history, physical examination, and 12-lead electrocardiogram (ECG). Participants were eligible if clinical laboratory testing showed that they had a normal serum TSH (0.4–4.5 mIU/L). Eligible participants were consented for the study and signed a written informed consent form. This study was ethically approved by the IRB of Georgetown University. Participants were studied for five days following ingestion of a single dose of liothyronine or synthetic T3 (TriThroid®). On the first day of the study, the participants reported to the research center after not having eaten since 10:00 pm the previous day. Vital signs (heart rate, systolic blood pressure, diastolic blood pressure, respiratory rate, and weight) were obtained together with ECG tracings. An intravenous catheter was inserted into a forearm vein and was left in situ for 12 h for subsequent blood sampling. Baseline thyroid function tests (TSH, total T4, FT4, total T3, FT3) were obtained at 7:30 am, 7:45 am, and 8:00 am, with 8:00 am being designated as time 0. One 50 μg tablet of L-T3 was administered orally at approximately 8:00 am with a glass of water. Thyroid function tests (T3, FT3, T4, FT4, TSH) were obtained at 15-min intervals after ingestion of the L-T3 for 4 samples, then at 30 min intervals for 6 additional samples, at hourly intervals for 2 samples, and then at 6 h, 8 h, 12 h, 24 h, 48 h, 72 h, and 96 h following T3 ingestion. Once the 12 one-hourly blood samples were obtained at approximately 8.00 pm, the participant was asked to return in a fasting state at 8.00 am the following 4 days for additional sets of thyroid function tests at 24 h, 48 h, 72 h, and 96 h after T3 administration. All samples for one participant were assayed in a single batch. The reference range for the thyroid assays were TSH 0.4-4.5 mIU/L (immunometric assay), free thyroxine (FT4) 0.8–1.8 ng/dL, thyroxine (T4) 4.7–13.3 μg/dL, FT3 2.18–3.98 pg/mL, and total T3 76–181 ng/dL (all immunoassays).
3. Model Construction
3.1. Overview of the measured [FT3] and related [TSH] responses
In Fig. 1, we present the measured results of all 12 investigated cases from the earlier published paper on this subject.7 The variations in [T4] and [FT4] were negligible and confirm the normal half-life behavior as a response to the given dose of 50 μg L-T3. Because the response of [FT3] was a scaled result of the measured values of [T3],2 we present the observed temporal responses of [FT3] in combination with the associated [TSH] response.
Fig. 1.
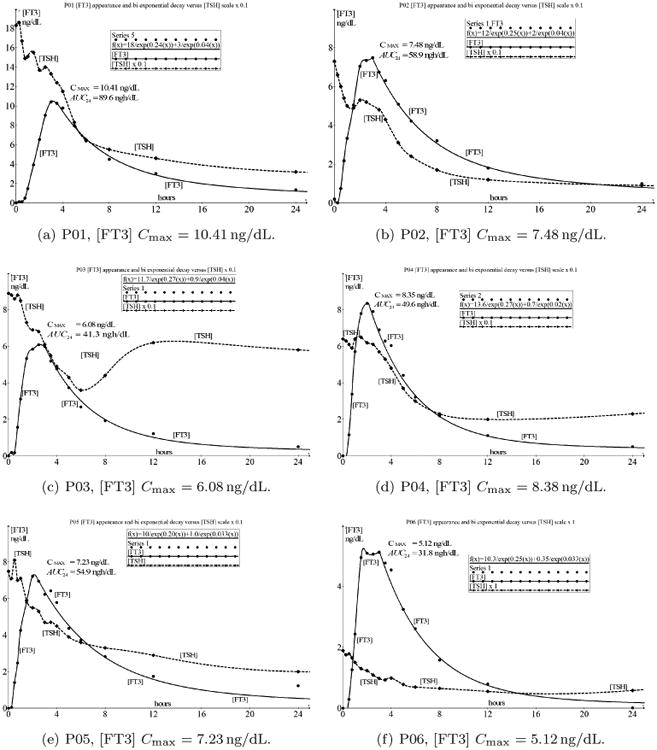
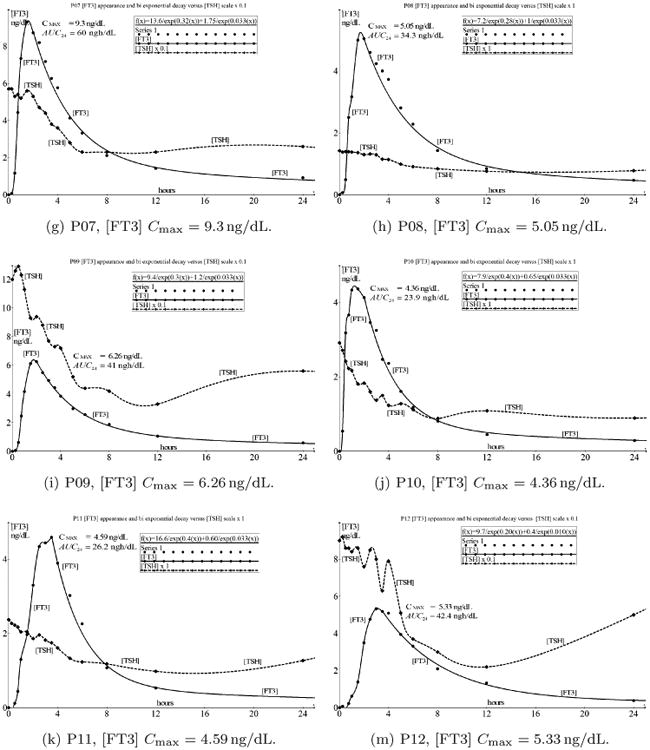
An overview of the 12 cases (a)–(m) (m instead of l) with indicated values of Cmax. The solid line indicates the time-dependent concentration of FT3 and the dashed line represents the time-dependent concentration of TSH. There are significant individual differences in Cmax and AUC but the most important commonality is the unexpected sustained decay of [TSH] after attaining Cmax mirroring the decay of [FT3] for several hours.
From the data presented in Fig. 1, we appreciate that the first part of the [FT3] appearance has a strong resemblance to a double integrating function with saturation at the top level.
After reaching Cmax, [FT3] decays according to a two compartment pharmacokinetic behavior.13 In the following, this phenomenon will be analyzed as is the case for the coincident decay curves of [FT3] and [TSH] because normally, it is expected that [TSH] will rise when [FT3] is declining and vice versa.
3.2. Response of FT3 concentrations as a function of time
At first we observe the concentration variable [FT3] as a function of time from an oral tablet bolus of 50 μg L-T3 in the blood compartment. The human body is a system in which drugs can be absorbed, transported, stored, metabolized, and excreted. The GIT acts as a processing system governing the entry of drugs in a specific, individually determined, time-dependent fashion to the blood compartment that serves as a generalized transport and storage system. The [FT3] profile in the blood plasma depends on the dissolution, pH, absorption rate, hydrophobicity, protein binding, partitioning in tissue compartments, storage, utilization, and excretion.1 [FT3] as a function of time will be regarded as a signal. Because of the signal conformity of [T3] and [FT3], we will focus on the behavior of [FT3]. The capillary blood compartment acts as a primary storage capacitor with a defined capacitance and responds on a time-dependent driving function in units of ng/dL/s. The signal path from oral ingestion to distribution and elimination is depicted in Fig. 2.
Fig. 2.

[FT3] signal processing compartment, tracing the path of [FT3] from the digestion of a single bolus of 50 μg L-T3 in the GIT indicated with a step function Bε(t) with a start concentration B and Laplace transformed to B/s. After the integrating action of the GIT, it presents a ramp function B/s2 to the blood compartment. The result from the blood compartment is the appearance time function of [FT3], f(t)output, with Laplace transform B/s2H(s) and is processed further in the two compartmental decay in its trajectory of the secondary distribution in the circulation according to [FT3] responses. Each time-function pictogram and its associated Laplace transformed signal is illustrated at every stage.
From Fig. 2, we appreciate that the liothyronine bolus is approximated by a step function Bε(t) where B represents the start concentration, ε(t) = 0 for t < 0 and ε(t) = 1 for t > 0, resulting in a Laplace-transformed presentation, B/s. The GIT operates as a one directional integrating converter of which the f(t)D signal, as a driving function of time, is represented by a ramp function, resulting in the definition ranges for f(t)D as
The Laplace-transformed presentation for f(t)D is then B/s2 where B represents the maximum concentration level of FT3 in ng/dL. The value of t1 will be derived from the measured appearance data. This generalized signal is the input of the capillary blood compartment capacitor C (L) via an input resistance equivalent of R (s/L), which is represented by the physiological process of time necessary to transport a defined amount of molecules from one location to another.
For the graphical presentations, we use the open source mathematical graphical analysis tool Graph 4.4.2 of Johansen.14 The general driving function in the time domain f(t)D is depicted in Fig. 3 as a straight line from the points (0, 0) to (t1, B) and shows the maximum FT3 concentration level B after t1 hours, corresponding with the maximum equivalent amount of the ingested L-T3 bolus of 50 μg. The signal is presented without the level of the baseline [FT3], as is showed later in the appearance and decay signal presentations and with interval operating constraints 0 < t < t1 for the linear rising part. The maximum value B of the input signal is maintained over the interval of t1 < t < t2.
Fig. 3.
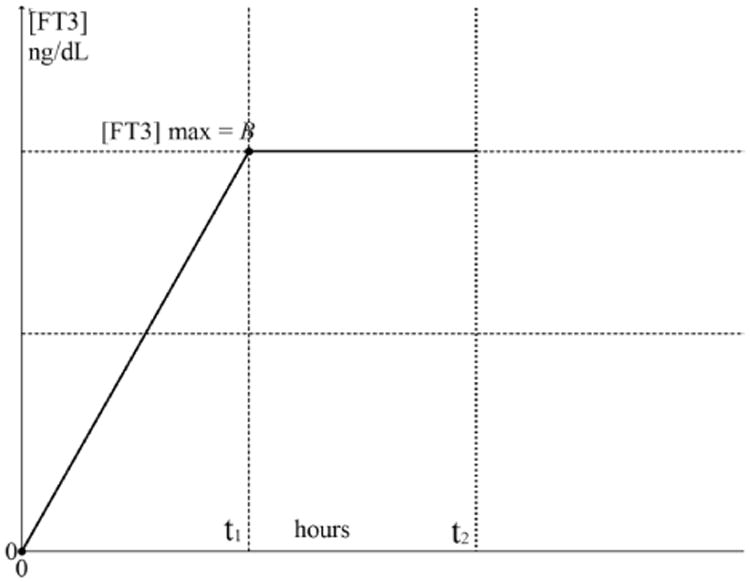
f(t)D output from the gastrointestinal process as a driving function for the transport equivalent resistance to the capillary blood compartment capacitor with a maximum at [FT3] max = B ng/dL over the interval 0 < t < t1 and sustains this value at during t1 < t < t2.
Figure 3 shows the signal output of the GIT which is approximated as a linearly increasing signal during a defined period t1. This signal is consistent with the way the L-T3 tablet is digested, followed by a gradual FT3 absorption from the GIT surface and transferred across into the circulation during bolus processing. [FT3] rises as L-T3 is absorbed from the GIT and behaves approximately as an integration of the L-T3 bolus step function Bε(t) with
ε(t) = 0 for t < 0 and ε(t) = 1 for t > 0. We thus formulate the output signal as driving function:
| (3.1) |
At the final moment of the dissolution process, the rise of [FT3] is terminated, resulting in a second part of the driving function which is described over the interval t1 < t < t2 where the maximum value is maintained until t2.
The driving function f(t)D with the end value should be distinguished from the later derived appearance responses of [FT3] of which the maximum value is indicated as CMAX < B depicted in Fig. 4. Here, the general structure of [FT3] appearance and decay is presented with the time functions related to the designated time intervals.
Fig. 4.
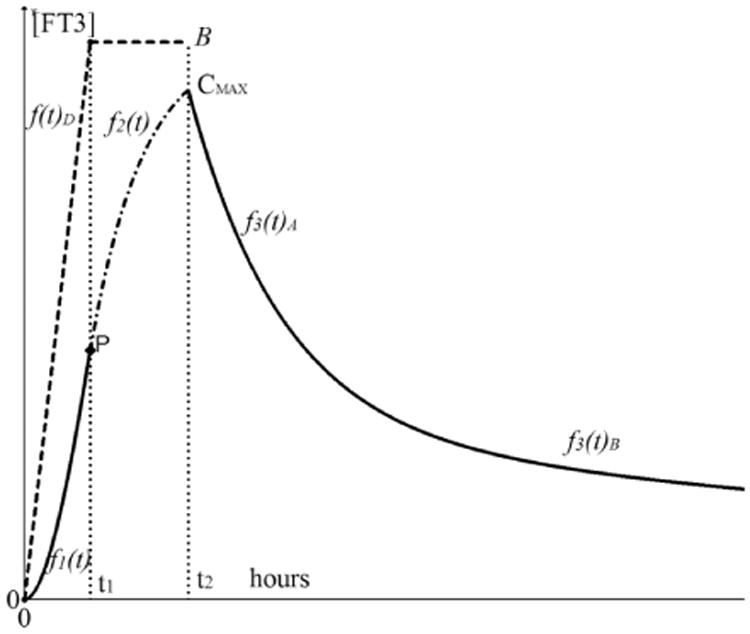
The appearance and decay functions of [FT3] with driving function f(t)D. The driving function f(t)D is indicated as the dashed line from 0 to t1 with a maximum at [FT3] = B. The appearance part of [FT3] is divided in f1(t)0 < t < t1 indicated as a solid line from 0 to t1 and f2(t)t1 < t < t2 indicated as a dash-dot line. The second part of the appearance function f2(t) continues seamlessly from f1(t) in point P. The decay phase starts at t > t2 indicated with the solid line and is divided in a distribution phase f3(t)A and some time later in an elimination phase f3(t)B. The elimination phase represents the half-life behavior.
At time t = t1, the maximum level of f(t)D has been reached, the integration operation on f1(t) will end and the rise of the appearance function continues while the driving function remains constant at f(t)D = B over the interval t1 < t < t2 resulting in a differentiation operation on f1(t) written as
| (3.2) |
Because at t = t2 the uptake process of the L-T3 bolus has ended, the level of is B no longer sustained. Then the decay process will start directly after the maximum has been reached. This function of the distribution phase f3(t) is indicated with a solid line as the output signal measured of the blood compartment. The [FT3] decay profile is subdivided into a distinct distribution phase occurring directly after CMAX as f3(t)A for about 8–10 h, followed by an elimination phase f3(t)B consistent with a bi-exponential decay function.13 The specific details will be discussed under Sec. 3.5.
3.3. [FT3] appearance and decay model as a single compartment
From measurements of the [FT3] appearance shown in the overview of Fig. 1, it becomes intuitively obvious that every stage of this process chain has an integrating character. Because the transport of material [FT3] follows a physiological equivalent of a physiological series resistor, R in s/L and fills a primary capillary blood compartmental capacitor C(L) we can model this behavior with an electrical circuit equivalent consisting of a series resistor and a capacitor driven by a ramp function. The [FT3] signal appearance and utilization can therefore be subjected to the fundamental laws of physics of electricity and hence be modeled as a signal integrating electrical circuit from which the input and output signals can be verified either by conventional calculation, or with possibilities to investigate variations in real time by means of a circuit simulator.15
For the derivation of the first part of the appearance function, we will use this first-order integrator model. The modeling approach of the bi-exponential decay will be discussed later with an extra integrating section representing the larger general blood compartment. The analysis of an electrical network facilitates the modeling and simulation with open available tools.14,15 The endocrine dynamics and associated signal behavior can now be described and analyzed with the Laplace transform. The time domain functions are transformed to the jω domain or complex frequencyaccording to s = jω where
j2 = −1 and ω = 2πf with f representing the frequency. The analyzed results can subsequently be inversely transformed back to the time domain. After this mathematical procedure, the analysis will be continued with time functions.
In Fig. 5, the electrical circuit represents the physiological model equivalent of the capillary blood compartment. When we follow the FT3 concentration as a result of absorption from the GIT, [FT3] ng/dL, we can define this as equivalent to an electrical voltage source U. Diode D prevents back flow because the metabolic conversion processes resulting from the L-T3 bolus are essentially irreversible. Resistor R1 represents the equivalent physiologic resistance from the GIT to the capillary blood compartment. Capacitor C represents the volume of this blood compartment while R2 stands for all integrated peripheral [FT3] level-dependent metabolism. A high value of R2 indicates a low discharge current and thus a slow decay of [FT3]. A small value of R2 has the opposite effect. In this single compartment model, the first-order decay is manifested as a single negative exponential coefficient which represents the half-life behavior.
Fig. 5.
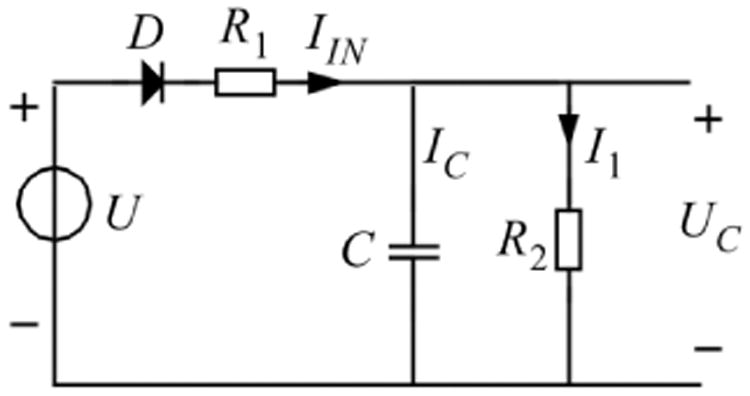
Electrical circuit equivalent of the capillary blood compartment with driving source U. This causes an [FT3] transport current IIN (ng/s) during the resolution process via the tissue-related equivalent resistor R1_(s/L) in a charge for the capillary blood compartment capacitor (Liters) resulting in a capacitor voltage UC. The diode D represents the unidirectional flow of the resolved amount of T3 and resulting FT3 concentrations. The metabolic-related resistor R2 represents the discharge of the capacitor by means of I1 and the belonging metabolic single compartmental decay process.
Generally, a physiological resistance is defined as the time it takes to pass a defined amount of material, from one place to another, with the dimension of s/L and is equivalent to all physiological effects resulting in transport of material and represented by the electrical resistor element R in Ohms. The [FT3] charging current for the capacitor C is defined as IIN and is the amount of transported material per second with the dimension ng/s equivalent to the current strength unit in ampere. We use the following equations in analogy from electrodynamics theory.
The amount of [FT3], l, in the circulation following oral absorption is written as:
| (3.3) |
The transported amount of FT3 per unit of time
| (3.4) |
This results in a relationship between the capacitor current and capacitor voltage
| (3.5) |
The FT3 concentration level [FT3] is equivalent to a voltage value U ng/dL.
The expression of (3.3) forms the basis of all related differential equations describing the dynamics of the [FT3] behavior. The differential equations will be presented as Laplace transformed expressions in the, or domain, with as the complex frequency s = jω
where j2 = −1 and ω = 2πf and f represents the frequency.8
With the Laplace transform of the capacitor impedance results in
| (3.6) |
The resistor is defined as
| (3.7) |
We will define the capacitor value proportionally to the individual body weight according to C = 4.5 mL/kg representing the volume in litres of the blood compartment. Based on the capacitor value, we can derive the values for the belonging resistors R1 and R2. With these relationships, we translate the physiological parameters to electrical network elements and vice versa. The electrical network elements R1, R2, and C have fixed unique values for any given individual and represent the model parameters for the appearance phase. In the time domain, U represents the time domain input signal in the form U(t) = (B/t1)t for the time interval 0 < t < t1 and U(t) = B for the time interval
t1 < t < t2 as shown in Fig. 3. Because we are only interested in the dynamics of the signal behavior, we can write the transfer of the electrical network of Fig. 5 as a Laplace-transformed time function.
The parallel impedance of R2 and C, noted as Z(R2//C), can be written as
| (3.8) |
which forms a series impedance with R1 written as
| (3.9) |
In Fig. 5, we make a distinction between the currents IIN, IC, and I1.
Applying Ohm's law, the current IIN, as a result from the driving voltage U and neglecting the voltage across the diode D equals
| (3.10) |
Then we find for the voltage across Z(R2//C)IIN = UC
| (3.11) |
The output to input transfer UC/U can the be written as
| (3.12) |
the appearance time constant is denoted τ = τ1 as
| (3.13) |
The decay time constant τD for a single compartment decay is then
| (3.14) |
A refinement of the decay description is given in Sec. 3.5.
Going back to the R/C model depicted in Fig. 5, we can derive the appearance characteristic for a single bolus of 50 μg L-T3. The [FT3] output in the blood compartment after oral ingestion of L-T3 is presented as a linear function of time. This can be described according to Fig. 6.
Fig. 6.

Laplace-transformed signal transfer. The driving signal indicated as the ramp function from the GIT, B/s2, is the input for the single blood compartment model consisting of K/(sτ + 1) with K = R2/(R1 + R2) resulting in the appearance of [FT3]: BK/(s2{sτ + 1}).
We use the following basic Laplace transform for the output of the GIT.
Under the condition that R2 ≫ R1, which is valid for most cases, we can approximate
| (3.15) |
For the Laplace transformed signal U, we find:
| (3.16) |
The output signal Uc(s) represents the measured values of the FT3 concentration in the blood compartment.
| (3.17) |
When Uc(s), as resolved above into partial fractions, the total expression is inverse transformed to the time domain and when we apply the substitution:
| (3.18) |
we obtain the piecewise continuous function Uc(t) which is composed of two partial functions.
For K ≈ 1, we have the first part of the [FT3] appearance with an output range defined by
| (3.19) |
as was indicated in Fig. 4.
3.4. Construction of the appearance characteristic with measured data
The appearance function can be constructed from measurements in the appearance part of the dataset. With an estimation of the data points in the time frame about the position of point P, the data points from P to the maximum values are used for the fitting procedure of f2(t). With the result of f2(t) we find the parameter a = 1/τ, the maximum saturation level B and the intersection of f2(t) with the base line in point t = b. The parameter a = 1/τ will be used in the second part of the fitting procedure to find f1(t).
From Fig 7 we appreciate the construction details of the appearance curve.
Fig. 7.
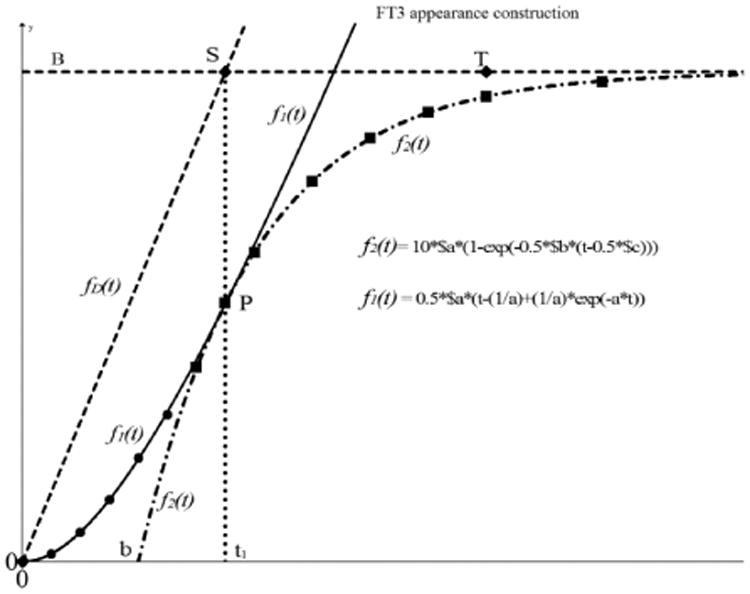
Construction of the [FT3] appearance based on measured data points. The first phase of the construction is based on the estimated data points from t > t1 (squares) This results in the fitting for f2(t) indicated as dash - dot line which intersects with y = 0 in t = b. We use the obtained value of τ of f2(t) to find a fit over the first series of measured points (round) f1(t) from which we obtain the amplitude factor A. With the extracted parameters B, a, and b from f2(t) and the amplitude factor A of f1(t) we calculate the time t1 to find the point P where f2(t) is taking over from f1(t). Furthermore, we find point S(t1, B). The driving function f(t)D is then indicated as the dashed line from (0,0) to S. Point T marks the end of the appearance process also known as tmax.
For the fitting procedure of the first stage we use the differentiated form of (3.20)
| (3.20) |
For a correct position, the form of f2(t) has to include the offset over t = b and then results in
| (3.21) |
and is fitted over the measured points t > t1 until the maximum values of the measurements.
From the fitted curve we find the values of B, a, and b where a = 1/τ.
The fitting procedure in Graph 4.4.2 is performed with the parameterized form written in the format for user defined functions where in Graph 4.4.2 the parameter t has to be replaced by parameter x
| (3.22) |
where 10*$a = B and represents the saturation level of f2(t) with 10 as suitable scaling factor, 0.5*$b = a with 0.5 as scaling factor and 0.5*$c = b also with 0.5 as scaling factor.
With the extracted value of a = 1/τ substituted in the parameterizable form of f1(t)
| (3.23) |
where A represents the amplitude of f1(t). We write the fitting function for f1(t) in Graph 4.4.2 as
| (3.24) |
After the fitting procedure over the points 0 < t < t1 we obtain the solid drawn curve as depicted in Fig. 7 which has one common point with f2(t) in P, of which we find the value for A = 0.5*$a.
In order to find the value of t1 the following condition has to be met.
| (3.25) |
in t = t1
| (3.26) |
then
| (3.27) |
for the first derivative of f1(t) we find
| (3.28) |
When we apply the condition of Eq. (3.25) we find
| (3.29) |
resulting in
| (3.30) |
Then,
| (3.31) |
and thus, for t = t1
| (3.32) |
3.5. Model construction and validation with clinical data
The earlier described clinical study7 resulted in values for [T3], [FT3], [TSH], [T4], and [FT4]. The study procedures described the test conditions and the types of test data. In general, we can conclude that the [FT3] profiles are basically conformal mappings of the [T3] profiles and comply with the same modeling principles.
As an example, we will apply the model construction with the described fitting procedure to the [FT3] appearance data of participant P01. The details of the decay function f3(t) as indicated earlier in Fig. 4, will be discussed in Sec. 3.5. From the data of the other participants, similar model parameters can be derived of which an overview is provided in Sec. 5. Serum [TSH] levels were significantly influenced during the first 10 h, but had little to no effect on the initial levels of [T4] and [FT4].
In Fig. 1, the overview of the combined [FT3] - [TSH] dynamics shows that the most significant variations in [FT3] are observed during the first 10 h after the administration of 50 μg L-T3.
We show the [FT3] profile of participant P01 which is depicted in Fig. 8.
Fig. 8.
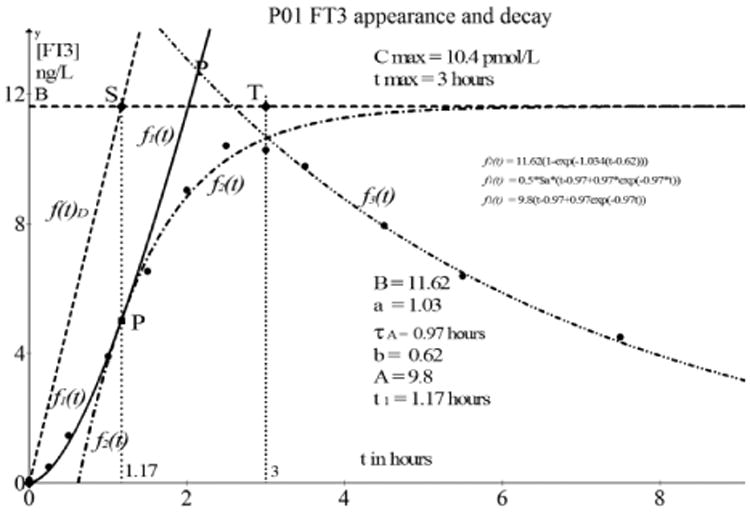
[FT3] appearance and decay as observed in participant P01. The solid line of f1(t) starting at (0, 0) has a fitting quality of R2 > 0.95. Similarly, we find a fitting quality of R2 > 0.95 for the continuation of the appearance function f2(t) indicated with the dot dash line.
The model construction is based on the measured data given in Table 1. The [FT3] values are baseline and delay corrected.
Table 1.
Participant 01 test data [FT3] baseline and time delay corrected.
| P01 [FT3] | ||||||||||
|---|---|---|---|---|---|---|---|---|---|---|
| Time h | 0 | 0.25 | 0.5 | 1 | 1.5 | 2 | 2.5 | 3 | 3.5 | 4.5 |
| [FT3] ngl/dL | 0.1 | 0.5 | 1.47 | 3.91 | 6.54 | 9.04 | 10.41 | 10.27 | 9.77 | 7.95 |
| Time hours | 5.5 | 7.5 | 11.5 | 23.5 | 47.5 | 71.5 | ||||
| [FT3] ngl/dL | 6.39 | 4.5 | 3.01 | 1.33 | 0.35 | 0.16 | ||||
The following functions are data fitting results from Graph 4.4.2 and define the behavior of [FT3]. The driving function is then
| (3.33) |
The first part of the [FT3] appearance function, according to the procedure is f2(t) and has a goodness of fit of R2 = 0.97.
which was fitted with the generalized fitting function in Graph 4.4.2
| (3.34) |
The variables indicated as $a, $b, and $c represent the model parameters to be calculated by the fitting algorithm where * has to be used for the multiplication sign. Here we find 10*$a representing the saturating level B, 0.5*$b represents the value of a, where a =1/τ and 0.5*$c represents the intersection point b with the base line f(t) = 0.
The first four values from Table 1 of the appearance will be used to find a fit in the second stage of the fitting procedure. This results in f1(t) = 9.8(t – 0.97 + 0.97 exp(−0.97t)) which is found with the generalized fitting function applied in Graph 4.4.2
| (3.35) |
Here we find the value of the amplitude of f1(t), 0, 5*$a = A = 9.8.
With the values of B, a, τ, b, and A we can calculate the value of t1 according to (3.32).
3.6. Model refinement for a detailed decay analysis
After the moment Cmax has been reached, a typical two-phase decay profile can be observed. This type of decay is modeled with two compartments.13 The initial part (the alpha phase) is the rapid decrease with a relatively low time constant and is indicated by the distribution phase where the drug distributes from the capillary blood compartment across the other tissue compartments. The second part (beta phase) appearing after the distribution phase, is a redistribution of [FT3] from other tissue compartments back into the blood and to general metabolism which is associated with the normal 21-h half-life of the drug. This type of two-compartmental decay is observed for all [FT3] decay profiles. The case of P01 serves as an illustrative and representative example for all 12 cases of which the [FT3] dynamics is depicted in Fig. 9.
Fig. 9.
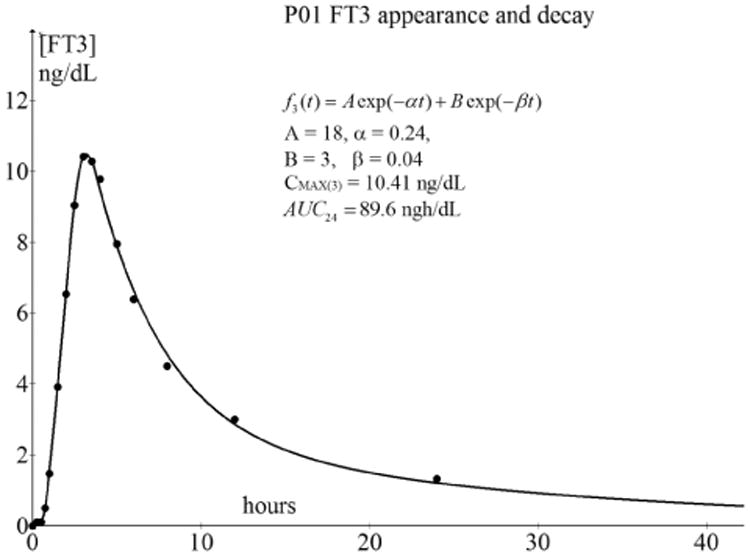
Bi-exponential decay after Cmax of the [FT3] profile of P01. The maximum Cmax occurs after 3 h at tmax, after which the bi-exponential decay will start. For a practical comparison of the AUC values, we truncated the time scale at 24 h because the measurement density is the highest over that period.
The data points of the decay after Cmax from Fig. 9 were fitted with the following parameterized bi-exponential function.
| (3.36) |
The fitting function in Graph 4.4.2 for the bi-exponential decay, noted in the format of the tool was
| (3.37) |
We find A = $a*5, other A than the amplitude of f1(t), where 5 is a convenient scaling constant, α = $b*0.2, with 0.2 as scaling constant, B = $c*0.2 with 0.2 as scaling constant and β = $d*0.1 with 0.1 as scaling constant.
In all cases, a close fit was achieved with nonlinear curve fitting methods performed with the open tool, Graph 4.4.2, of Johansen.14 We obtained the belonging values A, B, α, and β of from the fitting results, with a goodness-of-fit of 0.95 < R2 < 0.99.
In more than 50% of the [FT3] profiles, we found the value of β = 0.033, resulting in a time constant τ1/2 = 1/β = 30.3 from which we calculate τ1/2 = τ1/2 In 2 = 21 h well known as the half-life value of [FT3].
The observed behavior as modeled and fitted according to (3.36) can be modeled with an extension of the electrical network of Fig. 5 with an extra degree of freedom as depicted in Fig. 10.
Fig. 10.
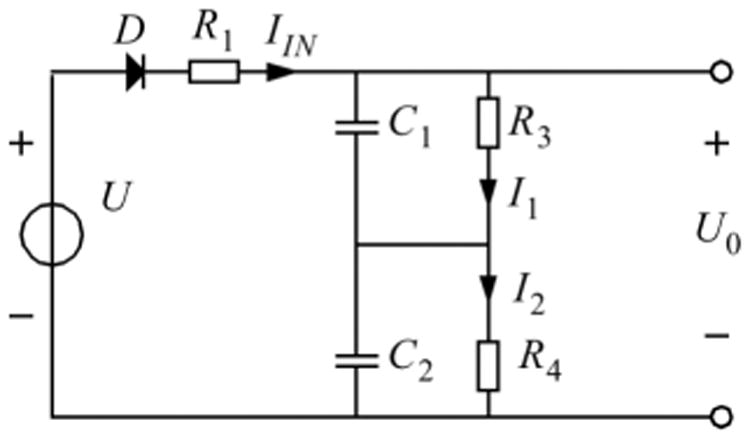
Extension of the network order of Fig. 4 with C2 and R4. Here the combination of C2 and R4 represents the general blood compartment indicated with larger values of C2 and R4 for a higher value of time constant. The product C1R3 = τα and C2R4 = τβ.
In Fig. 10, the capacitors C1 and C2 form a series capacitance equal to the original value C of Fig. 4. Then the following equation will be applied.
| (3.38) |
then
| (3.39) |
Similarly, the resistor R2 from Fig. 4 equals to the summation of R3 and R4.
With the configuration of Fig. 10, we can derive the signal transfer from input signal U to the capacitor output voltage which is the summation of two different decay processes.
The original appearance time constant τ = R1C is maintained. The decay behavior is now described with a bi-exponential function as described with Eq. (3.36) for which we have now the relative small distribution time constant τα = R3C1 and the larger elimination time constant τβ = R4C2.
| (3.40) |
where
| (3.41) |
The second or β phase of the decay is defined by
| (3.42) |
where
| (3.43) |
The serial impedance of the load circuit formed by C1, R3, C2, and R4 is expressed as
| (3.44) |
from which we can find the bi-exponential function of (3.36) with the inverse Laplace transform.
This result can be synthesized by means of a simulation of the circuit configuration of Fig. 10 which is depicted in Fig. 11.
Fig. 11.
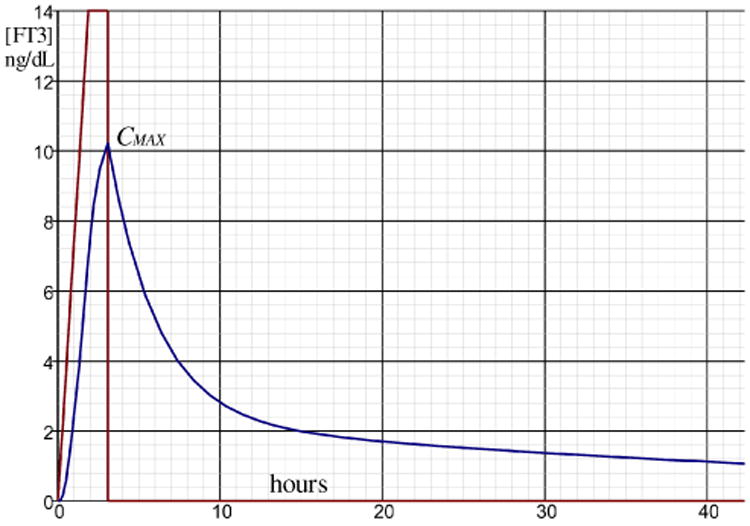
Simulated result of the configuration of Fig. 9 with R1 = 1k, C1 = 1000 μF, R3 =3k, R4 = 10k, C2 = 5000 μF. The vertical scale of [FT3] is in ng/dL while the time scale in the horizontal axis is in hours. This simulation is performed in the “seconds” time scale for convenience using the electrical circuit simulator and the time scale can be transformed to the hours scale by multiplying C1R3 = τα and C2R4 = τβ with a factor 3600.
The 12 analyzed cases gave different unique individual results in their specific [FT3] appearance and decay profiles.
τ1 represents the time constant in the appearance functions
represents the exponential coefficient of the distribution phase
represents the exponential coefficient of the elimination phase
tmax represents the time that CMAX occurs.
Cmax represents the max value in the appearance of [FT3]
AUC24 represents the area under curve of the [FT3] functions over the time interval of 24 h and is formally defined as
| (3.45) |
With the derived expressions for f1(t), f2(t), f3(t), the AUC can analytically be calculated.
4. Unexpected HPT Feedback Effects
We found a distinct occurrence that the [TSH] level gradually stabilizes to a new equilibrium level when the level of [FT3] has dropped below 3.5 ng/dL after 8 h.
As a representative example, we plotted the [TSH] measurements (magnified 10×) of participant P01 together with a fitted decay of [FT3] over a period of 40 h which is depicted in Fig. 12.
Fig. 12.
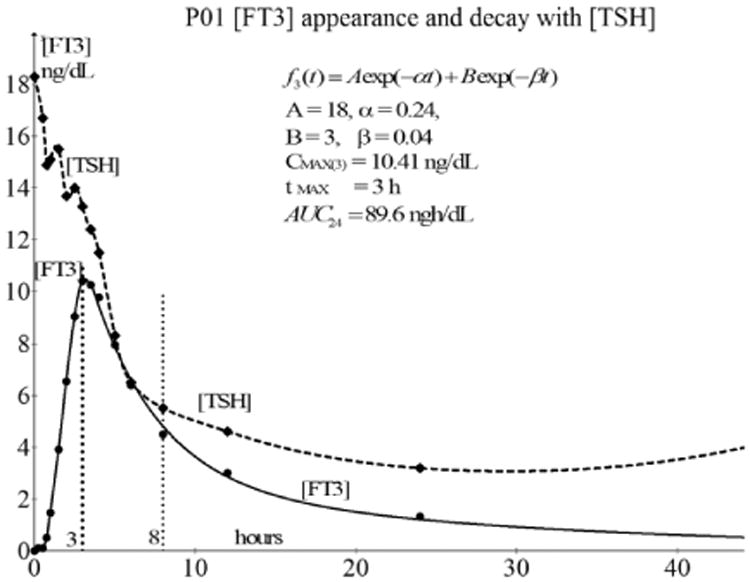
The decline in [TSH] (factor 10× magnified and dashed line) to a new equilibrium level at about 8 h after the oral dose of L-T3 compared with the [FT3] profile of P01. A similar behavior of [TSH] in combination with [FT3] profiles can be observed from the general overview of Fig. 1. The drop of [TSH] continues, even after the beginning of the decay at tmax = 3 h of [FT3], which is contrary to the feedback behavior, will be further discussed.
In Fig. 12, we observe that the [TSH] plot is magnified with a factor of 10 in contrast with the real value plot of [FT3]. When we compare the course of [FT3] with the course of the [TSH], the [TSH] level continues to decrease after 3.5 h, even during the phase when the [FT3] level is simultaneously declining as well. This is observed for all 12 cases in this dataset and is remarkable because it is generally assumed that only a rising [FT3] has a negative feedback effect in the HPT axis, normally resulting in a reduction of [TSH]. Now, we encounter the surprising phenomenon that even when [FT3] decreases after tmax, between 3.5 and 8 h, [TSH] decreases as well. This phenomenon is probably due to the following. In Sec. 3.5, we discussed the response properties of the decay phases as observed for [FT3]. We noted that the decay of [FT3] is characterized by two phases. The first phase is the rapid decrease of [FT3] designated as the distribution phase where the present amount of [FT3] is responsible for the [TSH] inhibition in the hypothalamus-pituitary system. The time course of the [TSH] is consistent with negative feedback inhibition of thyrotrophic secretion because we observe the [TSH] secretion as inhibited because of the relatively high present concentration of FT3 during the distribution phase. The [TSH] inhibition will gradually be abrogated when the [FT3] distribution process has ended, ushering in the second phase of the [FT3] decay and the normal well-known half-life behavior of L-T3. During the phase, when inhibitory [FT3] concentrations had declined below a critical threshold, the temporary equilibrium of [TSH] at a lower level will be followed later on by the restoration level of [TSH] in the normal regulatory range.
5. Results
Table 2 gives an overview of the derived [FT3] parameters of all 12 cases using the highest measurement density over a period from 0 to 24 h. τ1 represents the time constant model parameter for the appearance curve with the belonging goodness of fit represented by R2(τ1). Parameter α represents the distribution time constant during the decay of [FT3] and β stands for the elimination time constant.
Table 2.
[FT3] appearance, decay parameters, tmax, Cmax and goodness of fit R2.
| P# FT3 | τ1 FT3 | R2(τ1) | α FT3 | β FT3 | R2(α, β) | tmax FT3 | Cmax FT3 | AUC24FT3 |
|---|---|---|---|---|---|---|---|---|
| P01 | 0.83 | 0.98 | 0.28 | 0.04 | 0.99 | 3 | 10.4 | 89.6 |
| P02 | 0.66 | 0.97 | 0.22 | 0.007 | 0.98 | 3 | 7.5 | 58.9 |
| P03 | 0.38 | 0.96 | 0.27 | 0.04 | 0.99 | 2.5 | 6.1 | 41.3 |
| P04 | 0.38 | 0.97 | 0.27 | 0.02 | 0.99 | 2 | 8.4 | 49.6 |
| P05 | 0.83 | 0.96 | 0.2 | 0.03 | 0.99 | 2 | 7.2 | 54.9 |
| P06 | 0.17 | 0.98 | 0.25 | 0.03 | 0.99 | 3 | 5.1 | 31.8 |
| P07 | 0.32 | 0.95 | 0.32 | 0.03 | 0.99 | 1.5 | 9.3 | 60 |
| P08 | 0.73 | 0.98 | 0.28 | 0.03 | 0.99 | 2 | 5.1 | 34.3 |
| P09 | 0.65 | 0.98 | 0.3 | 0.03 | 0.99 | 2 | 6.3 | 41 |
| P10 | 0.22 | 0.96 | 0.4 | 0.03 | 0.99 | 1.5 | 4.4 | 23.9 |
| P11 | 0.84 | 0.97 | 0.4 | 0.03 | 0.99 | 3.5 | 4.6 | 26.2 |
| P12 | 0.84 | 0.96 | 0.2 | 0.01 | 0.99 | 3 | 5.3 | 42.4 |
Note: P#: participant number
τ1: appearance time constant
R2(τ1): goodness of fit of appearance characteristic
α: distribution time constant of the decay phase
β: elimination time constant of the decay phase
R2(α, β): goodness of fit of the decay characteristic
tmax: time that the maximum value of [FT3] is reached
Cmax: maximum level of [FT3] at tmax
AUC24: area under curve value of the [FT3] profile over a period of 24 h
All fitting results according to the discussed model indicate a close fit with the measured data, both for the appearance phase as well as for the distribution and elimination model.
With the base line corrected [FT3] measurements of P01 the appearance and decay behavior can be verified.
6. Discussion
The publication of Jonklaas et al.7 that provided richly resolved data with relatively short time intervals opened the possibility to construct and verify an electrical network model for [FT3] appearance and decay based on the behavior of equivalent electronic network elements. The electrical circuit model for the appearance functions has three parameters determining [FT3] response events as described. The appearance model is described as a single compartment approximation of the thyroid hormone logistical processes in the human body.
The electrical network properties offer a feasible and physiologically translatable approach for this modeling because a real network reflects this physiological reality. Our endeavor was to demonstrate the validity and feasibility of using an electrical circuit model approach for practical simulation of the physiological responses to a single dose L-T3 of 50 μg of an individual. We wanted to understand the details of the appearance mechanism via the oral ingestion to the GIT and the time behavior of the dissolved [FT3] linear concentration rise as a driving function for the blood compartments. From the integrating properties of the proposed network, we could identify the possible shape of the driving function f(t)D. The GIT plays a distinct role during the resolution and dispersion of the drug intake and the properties of the resulting rise of [FT3] which is reflected in the S-shaped appearance curve.
A remarkable observation, valid for all 12 cases, was the [TSH], which started to decline almost immediately on the appearance (rise) of [FT3] in the capillary blood compartment which is normally expected as negative feedback effect in the HPT axis. However, the [TSH] level continued to decline even when the [FT3] level started to fall. This behavior indicates a saturation effect of [FT3] during which the expected negative feedback behavior is not noticeable. Because of this temporary hypothalamus pituitary saturation effect, known as a nonlinearity, shutting down the normal negative feedback action, this will not lead to an instable situation.
The phase that [TSH] has reached the nadir and temporarily equilibrated to a new steady state is determined by the phase when the distribution in [FT3] is ending and when the elimination phase is taking over. This turn-over point is marked by the point of maximum curvature4 of the distribution decay characteristic and can be found around the area where the first derivative of [FT3] equals −0.707.
Looking at the individual data analysis, we found a distinct difference between the appearance profile of participant P01 (AUC = 89.6, Cmax = 10.4) and participant P10 (AUC = 23.9, Cmax = 4.4), thereby indicating the possible necessity to factor individualization in thyroid hormone dosing. This result is not surprising in light of the observed participant variability in management of hypothyroidism. Use of this model for management of hypothyroid patients will therefore require patient-specific assignment with respect to values for R1, C1, R3, R4, and C2 as depicted in Fig. 10.
This observation could also initiate a timely new debate about the definition of bioequivalence and bioavailability of drugs like liothyronine and possibly other drugs such as levothyroxine as well. The demonstrated differences between P01 and P10 in the [FT3] appearance profiles following a single dose of 50 μg L-T3 also raise valid concerns about bioequivalent drug issues due to erroneous assumptions on bioavailability related to the narrow therapeutic range for an optimal individual set point.4
7. Conclusion
With the validated electrical circuit model of L-T3 response effects of the HPT axis, we have a theoretical framework for further, more complex, analysis in this field with the aid of a general accessible simulation tool.15 In particular, the characterized gastrointestinal effects on absorption of the L-T3 dose and the appearance of [FT3] were demonstrated as similarly was shown for the bi-exponential decay process. Furthermore, the model can function as a data filter to identify outliers and verify the quality of comparable measurement procedures. This filter function helps to distinguish a measured response from possible noise effects. The area under the curve (AUC) can now analytically be calculated when the time interval of interest has been defined. The presented results can easily be verified with the availability of the free downloadable tool SIMetrix from the internet.15
The bolus of 50 μg L-T3 has obviously a measurable influence on [TSH] inhibition caused by the distribution processes of [FT3] in the decay phase. However, the differences in the analyzed [FT3] profiles between P01 and P10 indicate the individuality of the way this drug is absorbed and metabolized. This also entertains further examination about the definitions and methods to establish the bioequivalence and bioavailabilty of various drugs apart from L-T3.
Acknowledgments
JJ is partially supported by National Institutes of Health grants # R01AG033867 and UL1TR001409. “TriThroid®, the Liothyronine containing product and associated Intellectual Property referenced in these studies are owned and sponsored by ITL Pharma, Inc., Kingsport, TN 37660.” The authors are indebted to the editorial assistance offered by Jane Sim-Joo Tan throughout the preparation of this manuscript and the critical comments of Kiek Zwolsman.
Footnotes
Competing Interests: SLG and MKL are listed as two of the three co-inventors of a filed patent on the HPT axis set point algorithm Thyroid-SPOT, owned by Exploit Technologies Pvt Ltd (ETPL) in Singapore, A*STAR' s tech-transfer arm and is registered under Application Number 201208940-5, WIPO number WO/2014/088516. Regular patent application no: PCT/SG2013/000515.
Contributor Information
Simon L. Goede, Systems Research, Oterlekerweg 4, 1841, GP Stompetoren, The Netherlands
Keith R. Latham, ITL Pharma, 100 Coley Street, LIAS Campus, Bldg. B Kingsport, TN 37660
Melvin Khee-Shing Leow, Department of Endocrinology, Tan Tock Seng Hospital, Singapore, Yong Loo Lin School of Medicine, National University of Singapore, Lee Kong Chian School of Medicine, Nanyang, Technological University, Singapore.
Jacqueline Jonklaas, Division of Endocrinology, Georgetown University, Washington, DC 20007.
References
- 1.Colucci P, Yue CS, Ducharme M, Benvenga S. A review of the pharmacokinetics of levothyroxine for the treatment of hypothyroidism; thyroid disorders hypothyroidism. J Eur Endocrinol. 2013;9(1):40–47. doi: 10.17925/EE.2013.09.01.40. [DOI] [PMC free article] [PubMed] [Google Scholar]
- 2.Bianco AC, Gereben B, Berry MJ, Larsen PR. Roles of the iodothyronine selenodeio-dinases biochemistry, cellular and molecular biology. Physiol Endocrine Rev. 2002;23(1):38–89. doi: 10.1210/edrv.23.1.0455. [DOI] [PubMed] [Google Scholar]
- 3.Goede SL, Leow MK, Smit JWA, Klein HH, Dietrich JW. Hypothalamus-pituitary-thyroid feedback control: Implications of mathematical modeling and consequences for thyrotropin (TSH) and free thyroxine (FT4) reference ranges. Bull Math Biol. 2014;76(6):1270–1287. doi: 10.1007/s11538-014-9955-5. [DOI] [PubMed] [Google Scholar]
- 4.Leow MK, Goede SL. The homeostatic set point of the hypothalamus-pituitary-thyroid axis — maximum curvature theory for personalized euthyroid targets. Theor Biol Med Model. 2014;11:3. doi: 10.1186/1742-4682-11-35. [DOI] [PMC free article] [PubMed] [Google Scholar]
- 5.Peterson SJ, McAninch EA, Bianco AC. Is a normal TSH synonymous with “euthy-roidism” in levothyroxine monotherapy? J Clin Endocrinol Metab. 2016;101(12):4964–4973. doi: 10.1210/jc.2016-2660. [DOI] [PMC free article] [PubMed] [Google Scholar]
- 6.Saravanan P, Siddique H, Simmons DJ, Greenwood R, Dayan CM. Twenty-four hour hormone profiles of TSH, Free T3 and free T4 in hypothyroid patients on combined T3/T4 therapy. Exp Clin Endocrinol Diabetes. 2007;115(4):261–267. doi: 10.1055/s-2007-973071. [DOI] [PubMed] [Google Scholar]
- 7.Jonklaas J, Burman KD, Wang H, Latham KR. Single-dose T3 administration: Kinetics and effects on biochemical and physiological parameters. Ther Drug Monit. 2015;37(1):110–118. doi: 10.1097/FTD.0000000000000113. [DOI] [PMC free article] [PubMed] [Google Scholar]
- 8.Schenkman AL. Transient Analysis of Electrical Power Circuits Handbook. Springer; USA: 2005. https://download.e-bookshelf.de/download/0000/0008/76/L-G. [DOI] [Google Scholar]
- 9.Hodgkin A, Huxley A, Katz B. Measurement of current – voltage relations in the membrane of loligo. J Physiol. 1952;116:424–448. doi: 10.1113/jphysiol.1952.sp004716. [DOI] [PMC free article] [PubMed] [Google Scholar]
- 10.Hodgkin AL, Huxley AF. A quantitative description of membrane current and is application to conduction and excitation in nerve. J Physiol. 1952;117:500–544. doi: 10.1113/jphysiol.1952.sp004764. [DOI] [PMC free article] [PubMed] [Google Scholar]
- 11.Min BG, Woo EJ, Lee HK, Min KH. Separation of physiological factors influencing kinetics in diabetic patients using computer simulation method. J Kor Med Assoc. 1984;27(1):55–64. [Google Scholar]
- 12.Min GB, Woo EJ. An electrical equivalent circuit model of glucose-insulin kinetics during intravenous glucose tolerance test in dogs and man. Math Model. 1986;7(9–12):1187–1193. [Google Scholar]
- 13.Bauer LA. Applied Pharmacokinetics. 2nd. McGraw Hill Medical; 2008. [DOI] [Google Scholar]
- 14.Johansen J. Graph 4.4.2, A graphical mathematical tool. 2013 Last updated: August 2013, Available at http://www.padowan.dk/graph.
- 15.SIMetrix Technologies Ltd. Thatcham, Berkshire: 2014. Circuit Simulation, 78 Chapel Street. RG18 4QN United Kingdom, Available at http:/www.simetrix.co.uk. [Google Scholar]


