

Abstract
Objective
Severe obesity in adolescents is increasing and few effective treatments exist. Bariatric surgery is one option, but the extent to which surgery influences cardiovascular risk factors over time in youth is not clear. We hypothesized that Roux-en Y gastric bypass (RYGB) would be associated with sustained improvements in lipids over time (>5 years).
Participants/Methods
Youth who underwent RYGB from 2001–2007 were recruited for the Follow-up of Adolescent Bariatric Surgery-5+ (FABS-5+) in 2011–2014. Baseline BMI and lipids were abstracted from medical records. Follow-up data were obtained at a research visit. Analyses included paired t-tests to assess changes in BMI and lipids over time. General linear models were used to evaluate predictors of HDL and non-HDL-cholesterol at follow-up. A non-operative group was recruited for comparison.
Results
Surgical participants (n=58) were a mean ± SD age of 17±2 years at baseline and 25±2 years at long term follow-up. 86% were Caucasian and 64% were female. At long-term follow-up BMI decreased by 29% and all lipids (except total cholesterol) significantly improved (p<0.01). Female sex was a significant predictor of non-HDL cholesterol level at one year, while change in BMI from one year to long-term follow-up was a significant predictor of non-HDL cholesterol and HDL cholesterol during the same interval (p<0.05). In the non-operative group, BMI increased by 8% and lipid parameters were unchanged.
Conclusions
This is the longest and most complete follow-up of youth following RYGB. Weight loss maintenance over time was significantly associated with improvements in lipid profile over 5 years.
Keywords: severe pediatric obesity, bariatric surgery, adolescents, lipids
Introduction
Severe obesity in adolescents, defined as an absolute body mass index (BMI) of ≥35 kg/m2 or a BMI ≥120% of the 95th percentile for age and sex is the fastest growing category of obesity among US adolescents and currently affects 6% of all youth, or approximately 4.4 million adolescents 1. Severe obesity in youth is associated with marked metabolic dysfunction including a higher number of cardiovascular risk factors 2, higher blood pressure 3, more inflammation 4 and greater number of lipid abnormalities 4, 5 compared to adolescents with normal weight or less severe obesity. The presence of these cardiovascular risk factors, specifically obesity and lipid abnormalities, in adolescents portends significant public health consequences as both track from childhood into adulthood and increase the risk for adult cardiovascular disease and mortality 6–13.
Unfortunately, effective treatments for severe obesity in youth are lacking and lifestyle intervention, the mainstay of therapy, is often ineffective 14, 15. As a result, bariatric surgery has emerged as a potential treatment option in adolescents with severe obesity, not only because it effectively causes weight reduction 16, 17 but it has a favorable benefit to risk profile 18 and is associated with improved lipids, at least in short term follow-up studies 16, 17.
Long term studies after bariatric surgery in adolescents are lacking. It is currently unclear whether improvements in lipids that occur early after surgery are sustained over time, and importantly, it is also unknown how weight change over time may influence lipid concentrations. The aims of this study were to: 1) describe the long term lipid changes (>5 years beyond surgery) in individuals who had previously undergone Roux-en-Y gastric bypass (RYGB) in adolescence, 2) establish the frequency of sustained remission of dyslipidemia after RYGB, and 3) identify the predictors of lipid levels at long term follow-up. Comparisons were made to a non-operative comparison group who were similarly obese and sought obesity treatment as adolescents, but who did not undergo RYGB.
Methods
Surgical participants
Details of the cohort have been previously published 19. Briefly, seventy-four participants underwent RYGB at Cincinnati Children’s Hospital Medical Center between 2001 and 2007. Two were ineligible as one was unable to complete questionnaires independently due to developmental delays and one died prior to reaching 5 years postoperative RYGB (details published previously 20). Between 2011 and 2014, attempts were made to recruit the remaining 72 eligible participants using last known contact information for patient or parent and other publically available records (i.e. social networking and Lexis-Nexis Accurint). Fourteen were not enrolled (8 were located but declined to participate; 6 were not located and were considered lost to follow-up). Thus, 58 (80.5%) of this surgical cohort participated in the Follow-up of Adolescent Bariatric Surgery 5+ (FABS-5+) study.
Baseline preoperative data (anthropometric, clinical features, and biochemical measures) were obtained from other research databases or abstracted from medical records. Two individuals underwent RYGB by open laparotomy while 56 underwent laparoscopic RYGB, with all cases performed by two pediatric surgeons.
Non-operative participants
To discern differences in long-term BMI and lipid outcomes, a non-surgical comparison group was created using data from the multi-component, family-based pediatric weight management program at Cincinnati Children’s Hospital Medical Center. Records of 232 individuals (with BMI in the range of the surgical cohort) who had sought weight management services at Cincinnati Children’s Hospital Medical Center from 2001 and 2007 were screened. Thirty were deemed ineligible by chart review demonstrating that the individual had either obtained bariatric surgery during the follow up period (n=22), died (n=2, per parent report and personal communication with a physician), were developmentally delayed (n=2), or had no baseline data available (n=2). Attempts (mailings, phone calls) were made to contact the remaining 212 and offer participation. There were 192 who did not participate, 180 were never reached, 6 were reached but did not enroll, 3 reported having had surgery at another facility, 2 formally declined participation, and the parent of 1 reported he had died within the prior year (cause of death unknown) leaving 30 who ultimately agreed to participate. Of these 30 participants, 16 (60%) completed a follow-up visit at 6 months, 8 (27%) at 12 months and 14 (40%) receiving no follow-up care for weight management during the 12-months post-baseline evaluation.
Study visits and data collection
Long term follow-up data collection was performed identically for both cohorts by trained clinical research coordinators either in person at Cincinnati Children’s Hospital Medical Center or in the participant’s home. For participants who chose to have a home visit, a research contract agency (Examination Management Services, Inc. [EMSI; www.emsinet.com]) sent an examiner familiar with the study protocol to the home. This method ensured that a participant’s inability to travel long distances to the medical center was no barrier to participation.
Height was measured to the closest 1 mm in standing position. Weight was measured in light clothing to the nearest 100 grams on an electronic scale (Tanita model TBF-310, Tokyo, Japan). BMI (kg/m2) was calculated as weight (kilograms) by height (meters) squared. Blood pressure was obtained using a Welch Allen Spot Vital Monitor 4200B. Physical activity, calculated as the total summation of in minutes and frequency (days) of walking, moderate-intensity and vigorous-intensity activity was quantified by using the self-report International Physical Activity Questionnaire. Phlebotomy was performed by trained personnel using standard procedures to obtain a fasting lipid blood sample. Measurements of total cholesterol (TC), HDL-C, and triglycerides were performed enzymatically using a Roche Modular P analyzer. Determination of HDL-C was performed after precipitation of apolipoprotein (apo) B containing particles by dextran sulfate magnesium. Low density lipoprotein cholesterol (LDL-C) was calculated by the Friedewald equation or measured by the Beta Quantification procedure if triglycerides were ≥ 400 mg/dl. Non-HDL-C was calculated as the total cholesterol minus HDL-C. Triglyceride/HDL-C ratio was calculated and represents small dense LDL particles 21. All recruitment strategies and study procedures were approved by the Institutional Review Board. All participants provided written informed consent.
Dyslipidemia Classification
Dyslipidemia was considered present, using published criteria for ideal targets in adolescents and young adults 22–24 if any of the following criteria were met: total cholesterol > 200mg/dL, non-HDL-C >145mg/dL, LDL-C > 130mg/dL, triglycerides > 130mg/dl if age ≤20 years or >150mg/dL if age >20 years, HDL-C ≤40mg/dL for either sex, or if on lipid lowering medication. We defined progression of dyslipidemia as normal non-HDL-C or HDL-C at baseline and abnormal at final follow-up, while remission was defined as abnormal non-HDL-C or HDL-C at baseline and normal at final follow-up. Stable normal was defined as normal at baseline and follow-up and stable abnormal as dyslipidemia at both baseline and final follow-up. Non-HDL-C was selected over the individual lipid parameters (total cholesterol, triglycerides and LDL-C) because it accounts for the cholesterol carried by all atherogenic apolipoprotein B containing particles and outperforms the individuals parameters in predicting subclinical atherosclerosis and cardiovascular disease 24–26. Therefore, progression of non-HDL-C was defined as < 145mg/dL at baseline (normal) and ≥ 145mg/dL at long term follow-up (abnormal). Remission of non-HDL-C was defined as non-HDL-C ≥145mg/dL at baseline (abnormal) and <145mg/dL at long term follow-up (normal). For HDL-C, progression was defined as >40 mg/dL at baseline (normal) and ≤40mg/dL at long term follow-up (abnormal) while remission of HDL-C was defined as ≤40mg/dL (abnormal) and >40mg/dL at long-term follow-up (normal).
Statistics
Data are presented as mean (± standard deviation) or median (interquartile range) for continuous variables, or frequencies (and percentages) for categorical variables. Demographic comparisons between RYGB and Non-op controls were made using non-paired t tests or Chi square test. Comparisons over time within either the RYGB or Non-op group were made using paired t-tests for continuous variables and McNemar’s Test for dyslipidemia status.
We created separate multivariable linear regression models to examine factors associated with non-HDL-C and HDL-C progression at 1 year and change in BMI at long term follow-up. Potential covariates included age, race, sex, physical activity (total minutes per week), BMI (either pre-surgery or one year BMI), change in BMI in kg/m2 (calculated as either the difference between one year follow-up and baseline or long term follow-up and one year BMI), and the time interval between baseline and follow-up visits. Variables with 2-sided p values of <0.05 were considered statistically significant. All statistical analyses were performed using SAS version 9.4 (SAS Institute, Cary, North Carolina).
Results
RYGB participants (n=58) were a mean ± SD age of 17±2 years (age range 13–21 years) at baseline and 25 ± 2 (age range 20–29 years) at follow-up. The mean duration of follow-up for the RYGB group was 8 years. The Non-op comparison group (n=30) was a mean ± SD age of 15 ± 2 (range 11–18 years) at baseline and 22 ± 2 years (range 18–28 years) at follow-up. Mean duration of follow-up for Non-op comparators was 7 years. The RYGB and Non-Op cohorts were similar with respect to sex (64% vs. 73% female; Table 1). Compared to the RYGB group, baseline BMI and age were lower in the Non-op group (BMI 56 vs. 52 kg/m2 and age 17 vs. 15 years). Race differences were also apparent between groups, 86% of the RYGB non-Hispanic white while 47% of the Non-Op group was non-Hispanic white.
Table 1.
Baseline characteristics
| RYGB n=58 | Non-op, n=30 | p value | |
|---|---|---|---|
| Age, in years | 17.1 ± 1.7 | 15.3 ± 1.7 | <0.01 |
| Female, n (%) | 37 (64%) | 22 (73%) | 0.37 |
| Non-Hispanic white, n (%) | 50 (86%) | 14 (47%) | <0.01 |
| Height, in cm | 170.6 ± 9.6 | 167.7 ± 7.4 | 0.16 |
| Weight, in kg | 162.2 (111.3, 288.4) | 141.8 (115.0, 204.0) | 0.01 |
| Body mass index, in kg/m2 | 56.1 (41.4, 86.8) | 51.5 (40.6, 73.2) | 0.03 |
Data are mean ± SD, n (%) or median (min, max)
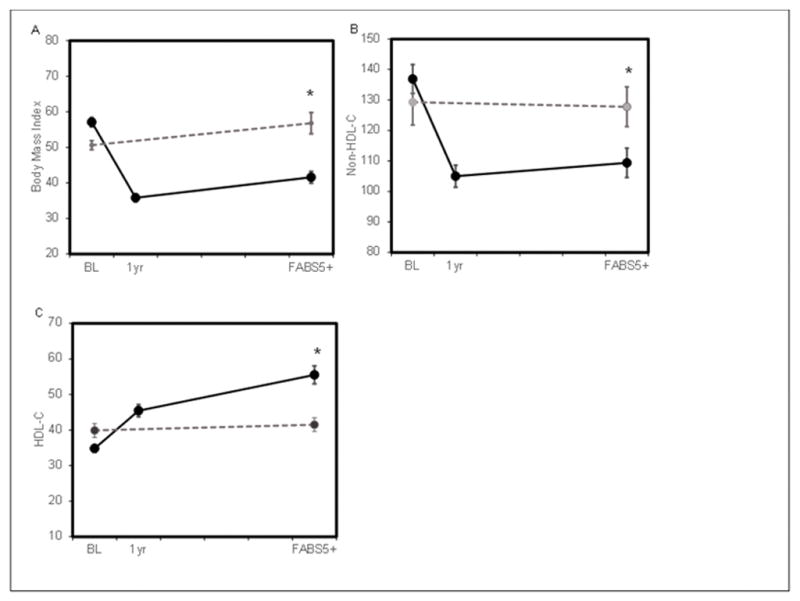
In the first year following RYGB, a −23.1 ± 4.8kg/m2 mean BMI decrease was observed (−40% change, Figure 1). At long-term follow-up, a mean BMI decrease of −16.3 kg/m2 from baseline was observed in the RYGB group (−28.9%). At long-term follow-up, the Non-Op cohort experienced a mean BMI increase of 4.0 ± 11.3kg/m2 (+7.2%) from baseline. Figure 1 also shows the mean change in non-HDL-C and HDL-C for both groups. The RYGB group had a 17.0% mean decrease in non-HDL-C whereas the Non-Op group had a 2.2% mean increase in non-HDL-C from baseline to long term follow-up. For HDL-C, the mean increase in the RYGB group was 62.6%. For the Non-Op group, a mean decrease in HDL-C was 5% over the long term. At long term follow-up, total physical activity in minutes per week was a median (Q1, Q3) of 490 (210, 1040) in the RYGB group and 385 (130, 765) in the Non-Op group.
Figure 1.
BMI, non-HDL-C and HDL-C over time for RYGB and Non-operative participants. Panel A shows body mass index in kg/m2, Panel B shows non-HDL-C in mg/dL, Panel C shows HDL-C in mg/dL. Solid black line is participants who underwent RYGB. Dotted gray line shows non-surgical control group. * represents a p value of <0.001 for the difference in BMI between groups at long term follow-up (FABS5+)
At baseline, 88% of the RYGB group had evidence of dyslipidemia with 6% (n=3) of participants on lipid lowering meds. At long term follow-up, the percent of participants with dyslipidemia in the RYGB group had reduced to 27% (p<0.001) at which time only one participant reported taking lipid lowering medications at any time during or at follow-up. Individual lipid parameters at 1 year post RYGB and at long term follow-up are shown in Table 2. While total cholesterol was unchanged, all individual lipids improved at 1 year and were sustained at long term follow-up in the RYGB group with the largest difference in HDL-C (+63%). In the Non-op group, no change was observed in the proportion with dyslipidemia (73% vs. 70%, p=0.655) or mean lipid concentrations at long term follow-up, see Table 2.
Table 2.
Longitudinal lipid data
| Baseline N=50 |
1 year post RYGB N=45 |
Long term follow up N=48 |
% change from baseline | p value | |
|---|---|---|---|---|---|
| RYGB | |||||
| Total Cholesterol | 161 (146, 196) | 150 (131, 170) | 166 (141, 183) | −1.0% | 0.461 |
| HDL-C | 35 (30, 39) | 46 (35, 53) | 52 (44, 63) | +62.6% | <0.001 |
| LDL-C | 104 (88, 124) | 85 (70, 104) | 93 (67, 107) | −12.3% | 0.002 |
| Triglycerides | 123 (99, 183) | 77 (64, 91) | 75 (60, 121) | −25.5% | <0.001 |
| TG/HDL-C ratio | 3.8 (2.6, 5.6) | 1.7 (1.4, 2.2) | 1.4 (1.0, 2.0) | −48.3% | <0.001 |
| Non-HDL-C | 131(115, 166) | 103 (85, 123) | 110 (82, 124) | −17.0% | <0.001 |
| Non-op | |||||
| N=25 | N=29 | ||||
| Total Cholesterol | 172.2 (138, 197) | NA | 167 (141, 190) | 2.5% | 0.938 |
| HDL-C | 38 (34, 48) | NA | 39 (36, 48) | 5.0% | 0.758 |
| LDL-C | 106 (83, 118) | NA | 108 (79, 127) | 5.9% | 0.422 |
| Triglycerides | 110 (71, 170) | NA | 86 (64, 158) | −6.8% | 0.144 |
| TG/HDL-C ratio | 2.6 (1.6, 3.9) | NA | 2.3(1.4, 3.9) | −7.1% | 0.3021 |
| Non-HDL-C | 131 (95, 148) | NA | 132 (99, 149) | 2.2% | 0.8773 |
Data are median (Q1, Q3) all in mg/dL. % change from baseline calculated compared to long term follow-up by paired t-test. NA-indicates data was not available. RYGB and Non-op participants excluded from this table include pregnant participants, those on lipid lowering medication, those with lipids missing or those that were non-fasting.
Table 3 shows the frequency of progression and remission of dyslipidemia along with stable abnormal and stable normal phenotypes for non-HDL-C and HDL-C in the RYGB group. Non-HDL-C values rose (progressed) in 0%, remained stable abnormal in 8%, remained stable normal in 61% and declined (regressed) in 32%. HDL-C declined (progressed or worsened) in 0%, remained stable abnormal in 15%, remained stable normal in 25% and rose (regressed) in 60%. In comparison, in the Non-op group, non-HDL-C rose in 14%, remained stable abnormal in 14%, remained stable normal in 55%, and declined in 18% while HDL-C progressed in 8%, remained stable abnormal in 50%, remained stable normal in 29% and regressed in 13%.
Table 3.
Dyslipidemia Progression or Remission Over Time
| Variable | RYGB, n=40 | Non-op n=24 |
|---|---|---|
| Non-HDL-C, n (%) | ||
| Stable Normal | 23(61%) | 12(55%) |
| Progression | 0(0%) | 3(14%) |
| Remission | 12(32%) | 4(18%) |
| Stable Abnormal | 3(8%) | 3(14%) |
| HDL-C, n (%) | ||
| Stable Normal | 10 (25%) | 7 (29%) |
| Progression | 0 (0%) | 2 (8%) |
| Remission | 24 (60%) | 3 (13%) |
| Stable Abnormal | 6 (15%) | 12 (50%) |
Data are n (%). Progression of non-HDL-C was defined as < 145mg/dL at baseline (normal) and ≥ 145mg/dL at long term follow-up (abnormal). Remission of non-HDL-C was defined as non-HDL-C ≥145mg/dL at baseline (abnormal) and <145mg/dL at long term follow-up (normal). For HDL-C, progression was defined as >40 mg/dL at baseline (normal) and ≤40mg/dL at long term follow-up (abnormal) while remission of HDL-C was defined as ≤40mg/dL (abnormal) and >40mg/dL at long-term follow-up (normal). RYGB and Non-op participants excluded from this table include pregnant participants, those on lipid lowering medication, those with lipids missing or those that were non-fasting.
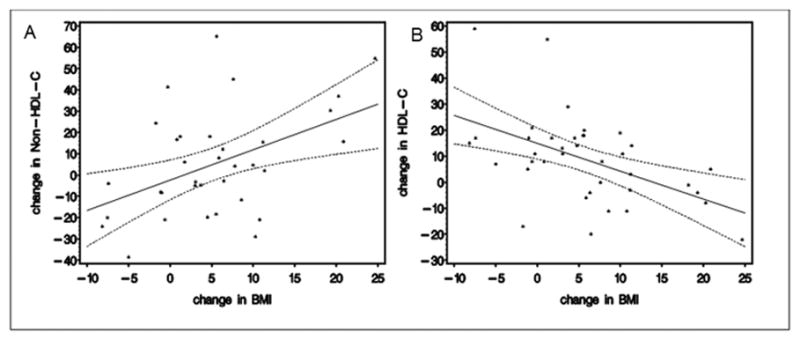
We constructed multivariable linear regression models to examine risk factors to predict non-HDL-C and HDL-C at follow-up in the RYGB group. We modeled the change in BMI from baseline to 1 year and 1 year to long term follow-up separately given that the changes in lipids overtime were not constant. An increase in BMI (in kg/m2) from 1 year to long-term follow-up was associated with higher non-HDL-C and lower HDL-C at the long term follow-up, both p<0.01 (Figure 2). Female sex was the only risk factor associated with a higher non-HDL-C at one year follow-up (p<0.05). No risk factors were identified that predicted change in HDL-C at 1 year.
Figure 2.
The relationship between change in lipids and BMI from 1 year postoperatively to the long-term FABS5+ visit. Solid line represents the mean and dotted lines represent the 95 percent confidence interval. Panel A shows the relationship between change in non-HDL-C (in mg/dL) and change in BMI (in kg/m2) from 1 year to long term follow-up. Panel B shows the relationship between change in HDL-C (in mg/dL) and change in BMI (in kg/m2) during the same interval.
Discussion
This is the longest reported follow-up of lipids after RYGB in adolescents. We show improvements in the lipid profile that are durably maintained over the 8 year follow-up period. Additionally, we show that body weight after the first year after RYGB appears to be important predictor of long term lipid values. No such changes were observed in the absence of surgical treatment.
The improvements in lipids observed here mirror findings in adults where participants undergoing weight loss surgery show improvements in long term lipids 27–30. The Swedish Obese Subjects (SOS) study has published some of the longest follow-up lipid data in adults after bariatric surgery (several distinct types of operations). Over 10 years following surgery, SOS participants’ demonstrated improvements in HDL-C and triglycerides that were durable (LDL-C not reported) 31. Until now, prospective follow-up lipid data in adolescents following RYGB has been limited to 3 years 32 with most studies in adolescents reporting post-operative lipid changes between 6–24 months 16, 20, 32–38. While all studies show improvements in lipids or some resolution of dyslipidemia 16, 32, 38, not all show statistical differences from pre-surgical levels 20, 34–37. For example, Sinha et al. found no difference in HDL-C at 6 months post RYGB 36, Serrano et al. saw no differences in LDL-C or triglycerides at 13 months 35, and Maffazioli et al found both HDL-C and triglycerides concentrations were unchanged at 18 month follow-up 37. Here, we show improvements in all lipid parameters and a nearly 50% decrease in dyslipidemia that is durably maintained for > 5 years post RYGB. The larger sample size in FABS-5+ (increased power), degree of weight loss, or differences in pre-surgical (baseline) lipid concentrations may explain discrepant findings between this and other studies in the literature. Our findings are important, however, because they suggest RYGB has beneficial effects on lipids, an important cardiovascular risk parameter. Specifically, the observed improvements in atherogenic lipids [(LDL-C, non-HDL-C and triglyceride/HDL-C ratio (a measure of small dense LDL)] may have important implications on adult cardiovascular disease 21, 39, 40.
The lipid parameter with the largest improvement after RYGB was HDL-C, with an increase of nearly 68%. In addition, despite some weight regain from 1 year to long term follow-up, HDL-C continued to improve. The mechanisms by which HDL-C increases and continues to rise following RYGB are not clear from this analysis but prior studied suggest it may be related to improved HDL metabolism with the formation of larger, more cholesterol-rich particles as a result of weight loss and/or improved insulin resistance 41. Recent work in mice suggests altered gut physiology after RYGB, particularly an increase in glucagon like peptide-1 (GLP-1) secretion may drive this process 42. Indeed, compared to vertical sleeve gastrectomy 37 and adjustable gastric banding 43, RYGB is associated with higher GLP-1 levels and higher HDL-C levels 44. Perhaps this explains the continued rise in HDL-C. Our group also recently published data showing an increase in HDL-C following weight loss surgery is associated with improved HDL function including protection from LDL oxidation and improved ability to efflux cholesterol into macrophages. These findings suggesting this rise in HDL-C may also be beneficial for future cardiovascular health as higher efflux ability is associated with lower incident and prevalent cardiovascular events 45–47.
We found that female sex was associated with a higher non-HDL-C at one year. After the first year, BMI was an important predictor of long term lipid levels. Specifically, an increase in BMI from one year to long term follow-up was associated with a higher non-HDL-C and lower HDL-C at follow-up. These findings suggest body weight is linked to improvement in lipids long term and weight gain post-operatively likely increases cardiovascular risk. Furthermore, these findings highlight the importance of weight maintenance after RYGB on future cardiovascular risk. From our data, it is not clear why BMI was not a significant determinant of non-HDL-C or HDL-C at one year. Perhaps BMI and lipid changes do not coincide short-term but at long term follow-up because of the greater distribution or spread amongst individuals a relationship between lipids and BMI is detected. It is also possible that other risk factors including diet or smoking (not measured in this study) are important.
The lipid findings after RYGB can be taken in context of the changes in the non-operative comparator group where the data demonstrate that weight increased over time, the frequency of dyslipidemia did not improve, and lipid parameters were unchanged over time. This appears to be the natural course for both obesity and dyslipidemia 48, 49, although few studies have examined the natural history of cardiovascular risk factors in severely obese adolescents long term. Prior cross sectional analyses have shown that the presence of cardiovascular risk factors in youth with severe obesity 2 is associated with early evidence of cardiac and vascular dysfunction 5. Recent data suggest both of these may be reversible with RYGB 50, 51. Therefore, we hypothesize that compared to the non-surgical cohort, target organ damage will be diminished in adolescents undergoing RYGB due to weight loss and/or improved cardiovascular risk factors.
Limitations of this study include an under representation of males and minor ethnic groups which limits the generalizability of our findings. Additionally, not all participants had fasting lipid data therefore some data were missing in both groups (n=13 across both groups). While this did not influence the overall results, it likely limited our ability to identify risk factors associated with change in lipids overtime. Third, while extensive measures were taken to locate and recruit both surgical and non-surgical participants, some could not be found or did not agree to participate. While 81% of RYGB subjects were successfully recruited and included in the analyses and were no different than the 14 non-participating RYGB subjects in terms of surgical age, race, sex, and baseline BMI, in the non-operative cohort only 10% of eligible patients were captured for this study. In addition, since participation in medically-supervised weight management during the 12-months post-baseline evaluation was variable, this cohort cannot be regarded as a standard of care control group but instead should be viewed as simply a comparison group to examine the natural evolution of lipids overtime. Finally, we did not capture physical activity data at baseline or diet or smoking at either time-point, factors known to influence lipids. These should be included in future studies.
In conclusion, RYGB has durable effects on the lipid profile in adolescents with severe obesity. Given that abnormal concentrations of lipids are strongly associated with adult cardiovascular disease and lipids track from childhood to adulthood, these findings suggest RYGB, due to significant and durable improvement in lipids, may have the potential to decrease hard cardiovascular endpoints like myocardial infarction and stroke in middle age years 9. Longer follow-up of the surgical cohort is needed to establish the magnitude of the anticipated impact of adolescent bariatric surgery on hard cardiovascular endpoints.
Acknowledgments
Funding: This research was supported by investigator initiated grants from Ethicon Endosurgery (grants 15161 and 15151.3); the project was also supported by the National Center for Advancing Translational Sciences of the US National Institutes of Health (award number UL1TR000077). The content of this Article is solely the responsibility of the authors and does not necessarily represent the official views of Ethicon Endosurgery or the National Institutes of Health.
We would like to thank Aaron Kelly PhD for critical review of this manuscript.
Footnotes
Conflicts of interest; none
There are no conflicts of interest to disclose.
References
- 1.Claire Wang Y, Gortmaker SL, Taveras EM. Trends and racial/ethnic disparities in severe obesity among US children and adolescents, 1976–2006. Int J Pediatr Obes. 2011;6:12–20. doi: 10.3109/17477161003587774. [DOI] [PubMed] [Google Scholar]
- 2.Ice CL, Murphy E, Cottrell L, Neal WA. Morbidly obese diagnosis as an indicator of cardiovascular disease risk in children: results from the CARDIAC Project. Int J Pediatr Obes. 2011;6:113–119. doi: 10.3109/17477161003792556. [DOI] [PubMed] [Google Scholar]
- 3.Gidding SS, Nehgme R, Heise C, Muscar C, Linton A, Hassink S. Severe obesity associated with cardiovascular deconditioning, high prevalence of cardiovascular risk factors, diabetes mellitus/hyperinsulinemia, and respiratory compromise. J Pediatr. 2004;144:766–769. doi: 10.1016/j.jpeds.2004.03.043. [DOI] [PubMed] [Google Scholar]
- 4.Norris AL, Steinberger J, Steffen LM, Metzig AM, Schwarzenberg SJ, Kelly AS. Circulating oxidized LDL and inflammation in extreme pediatric obesity. Obesity (Silver Spring) 2011;19:1415–1419. doi: 10.1038/oby.2011.21. [DOI] [PMC free article] [PubMed] [Google Scholar]
- 5.Shah AS, Dolan LM, Khoury PR, Gao Z, Kimball TR, Urbina EM. Severe Obesity in Adolescents and Young Adults Is Associated With Subclinical Cardiac and Vascular Changes. J Clin Endocrinol Metab. 2015;100:2751–2757. doi: 10.1210/jc.2014-4562. [DOI] [PMC free article] [PubMed] [Google Scholar]
- 6.Berenson GS, Srinivasan SR, Bao W, Newman WP, 3rd, Tracy RE, Wattigney WA. Association between multiple cardiovascular risk factors and atherosclerosis in children and young adults. The Bogalusa Heart Study. N Engl J Med. 1998;338:1650–1656. doi: 10.1056/NEJM199806043382302. [DOI] [PubMed] [Google Scholar]
- 7.McGill HC, Jr, McMahan CA, Malcom GT, Oalmann MC, Strong JP. Effects of serum lipoproteins and smoking on atherosclerosis in young men and women. The PDAY Research Group. Pathobiological Determinants of Atherosclerosis in Youth. Arterioscler Thromb Vasc Biol. 1997;17:95–106. doi: 10.1161/01.atv.17.1.95. [DOI] [PubMed] [Google Scholar]
- 8.Raitakari OT, Juonala M, Kahonen M, Taittonen L, Laitinen T, Maki-Torkko N, et al. Cardiovascular risk factors in childhood and carotid artery intima-media thickness in adulthood: the Cardiovascular Risk in Young Finns Study. JAMA. 2003;290:2277–2283. doi: 10.1001/jama.290.17.2277. [DOI] [PubMed] [Google Scholar]
- 9.Twig G, Yaniv G, Levine H, Leiba A, Goldberger N, Derazne E, et al. Body-Mass Index in 2.3 Million Adolescents and Cardiovascular Death in Adulthood. N Engl J Med. 2016;374:2430–2440. doi: 10.1056/NEJMoa1503840. [DOI] [PubMed] [Google Scholar]
- 10.Freedman DS, Dietz WH, Tang R, Mensah GA, Bond MG, Urbina EM, et al. The relation of obesity throughout life to carotid intima-media thickness in adulthood: the Bogalusa Heart Study. Int J Obes Relat Metab Disord. 2004;28:159–166. doi: 10.1038/sj.ijo.0802515. [DOI] [PubMed] [Google Scholar]
- 11.Li S, Chen W, Srinivasan SR, Bond MG, Tang R, Urbina EM, et al. Childhood cardiovascular risk factors and carotid vascular changes in adulthood: the Bogalusa Heart Study. Jama. 2003;290:2271–2276. doi: 10.1001/jama.290.17.2271. [DOI] [PubMed] [Google Scholar]
- 12.Li X, Li S, Ulusoy E, Chen W, Srinivasan SR, Berenson GS. Childhood adiposity as a predictor of cardiac mass in adulthood: the Bogalusa Heart Study. Circulation. 2004;110:3488–3492. doi: 10.1161/01.CIR.0000149713.48317.27. [DOI] [PubMed] [Google Scholar]
- 13.Myers L, Coughlin SS, Webber LS, Srinivasan SR, Berenson GS. Prediction of adult cardiovascular multifactorial risk status from childhood risk factor levels. The Bogalusa Heart Study. Am J Epidemiol. 1995;142:918–924. doi: 10.1093/oxfordjournals.aje.a117739. [DOI] [PubMed] [Google Scholar]
- 14.Danielsson P, Kowalski J, Ekblom O, Marcus C. Response of severely obese children and adolescents to behavioral treatment. Arch Pediatr Adolesc Med. 2012;166:1103–1108. doi: 10.1001/2013.jamapediatrics.319. [DOI] [PubMed] [Google Scholar]
- 15.Kelly AS, Barlow SE, Rao G, Inge TH, Hayman LL, Steinberger J, et al. Severe obesity in children and adolescents: identification, associated health risks, and treatment approaches: a scientific statement from the American Heart Association. Circulation. 2013;128:1689–1712. doi: 10.1161/CIR.0b013e3182a5cfb3. [DOI] [PubMed] [Google Scholar]
- 16.Olbers T, Gronowitz E, Werling M, Marlid S, Flodmark CE, Peltonen M, et al. Two-year outcome of laparoscopic Roux-en-Y gastric bypass in adolescents with severe obesity: results from a Swedish Nationwide Study (AMOS) Int J Obes (Lond) 2012;36:1388–1395. doi: 10.1038/ijo.2012.160. [DOI] [PubMed] [Google Scholar]
- 17.Inge TH, Courcoulas AP, Jenkins TM, Michalsky MP, Helmrath MA, Brandt ML, et al. Weight Loss and Health Status 3 Years after Bariatric Surgery in Adolescents. N Engl J Med. 2016;374:113–123. doi: 10.1056/NEJMoa1506699. [DOI] [PMC free article] [PubMed] [Google Scholar]
- 18.Inge TH, Zeller MH, Jenkins TM, Helmrath M, Brandt ML, Michalsky MP, et al. Perioperative outcomes of adolescents undergoing bariatric surgery: the Teen-Longitudinal Assessment of Bariatric Surgery (Teen-LABS) study. JAMA Pediatr. 2014;168:47–53. doi: 10.1001/jamapediatrics.2013.4296. [DOI] [PMC free article] [PubMed] [Google Scholar]
- 19.Inge TH, Jenkins TM, Xanthakos SA, Dixon JB, Daniels SR, Zeller MH, et al. Long-term outcomes of bariatric surgery in adolescents with severe obesity (FABS-5+): a prospective follow-up analysis. Lancet Diabetes Endocrinol. 2017 doi: 10.1016/S2213-8587(16)30315-1. [DOI] [PMC free article] [PubMed] [Google Scholar]
- 20.Lawson ML, Kirk S, Mitchell T, Chen MK, Loux TJ, Daniels SR, et al. One-year outcomes of Roux-en-Y gastric bypass for morbidly obese adolescents: a multicenter study from the Pediatric Bariatric Study Group. J Pediatr Surg. 2006;41:137–143. doi: 10.1016/j.jpedsurg.2005.10.017. discussion 137–143. [DOI] [PubMed] [Google Scholar]
- 21.Hanak V, Munoz J, Teague J, Stanley A, Jr, Bittner V. Accuracy of the triglyceride to high-density lipoprotein cholesterol ratio for prediction of the low-density lipoprotein phenotype B. Am J Cardiol. 2004;94:219–222. doi: 10.1016/j.amjcard.2004.03.069. [DOI] [PubMed] [Google Scholar]
- 22.National Cholesterol Education Program (NCEP): highlights of the report of the Expert Panel on Blood Cholesterol Levels in Children and Adolescents. Pediatrics. 1992;89:495–501. [PubMed] [Google Scholar]
- 23.Expert panel on integrated guidelines for cardiovascular health and risk reduction in children and adolescents: summary report. Pediatrics. 2011;128(Suppl 5):S213–256. doi: 10.1542/peds.2009-2107C. [DOI] [PMC free article] [PubMed] [Google Scholar]
- 24.Executive Summary of The Third Report of The National Cholesterol Education Program (NCEP) Expert Panel on Detection, Evaluation, And Treatment of High Blood Cholesterol In Adults (Adult Treatment Panel III) JAMA. 2001;285:2486–2497. doi: 10.1001/jama.285.19.2486. [DOI] [PubMed] [Google Scholar]
- 25.Blaha MJ, Blumenthal RS, Brinton EA, Jacobson TA. The importance of non-HDL cholesterol reporting in lipid management. J Clin Lipidol. 2008;2:267–273. doi: 10.1016/j.jacl.2008.06.013. [DOI] [PubMed] [Google Scholar]
- 26.van Deventer HE, Miller WG, Myers GL, Sakurabayashi I, Bachmann LM, Caudill SP, et al. Non-HDL cholesterol shows improved accuracy for cardiovascular risk score classification compared to direct or calculated LDL cholesterol in a dyslipidemic population. Clin Chem. 2011;57:490–501. doi: 10.1373/clinchem.2010.154773. [DOI] [PMC free article] [PubMed] [Google Scholar]
- 27.Carswell KA, Belgaumkar AP, Amiel SA, Patel AG. A Systematic Review and Meta-analysis of the Effect of Gastric Bypass Surgery on Plasma Lipid Levels. Obes Surg. 2016;26:843–855. doi: 10.1007/s11695-015-1829-x. [DOI] [PubMed] [Google Scholar]
- 28.Kim MK, Kim W, Kwon HS, Baek KH, Kim EK, Song KH. Effects of bariatric surgery on metabolic and nutritional parameters in severely obese Korean patients with type 2 diabetes: A prospective 2-year follow up. J Diabetes Investig. 2014;5:221–227. doi: 10.1111/jdi.12137. [DOI] [PMC free article] [PubMed] [Google Scholar]
- 29.Lubrano C, Mariani S, Badiali M, Cuzzolaro M, Barbaro G, Migliaccio S, et al. Metabolic or bariatric surgery? Long-term effects of malabsorptive vs restrictive bariatric techniques on body composition and cardiometabolic risk factors. Int J Obes (Lond) 2010;34:1404–1414. doi: 10.1038/ijo.2010.54. [DOI] [PubMed] [Google Scholar]
- 30.Zambon S, Romanato G, Sartore G, Marin R, Busetto L, Zanoni S, et al. Bariatric surgery improves atherogenic LDL profile by triglyceride reduction. Obes Surg. 2009;19:190–195. doi: 10.1007/s11695-008-9644-2. [DOI] [PubMed] [Google Scholar]
- 31.Sjostrom CD, Lystig T, Lindroos AK. Impact of weight change, secular trends and ageing on cardiovascular risk factors: 10-year experiences from the SOS study. Int J Obes (Lond) 2011;35:1413–1420. doi: 10.1038/ijo.2010.282. [DOI] [PubMed] [Google Scholar]
- 32.Inge TH, Courcoulas AP, Jenkins TM, Michalsky MP, Helmrath MA, Brandt ML, et al. Weight Loss and Health Status 3 Years after Bariatric Surgery in Adolescents. N Engl J Med. 2015 doi: 10.1056/NEJMoa1506699. [DOI] [PMC free article] [PubMed] [Google Scholar]
- 33.Sugerman HJ, Sugerman EL, DeMaria EJ, Kellum JM, Kennedy C, Mowery Y, et al. Bariatric surgery for severely obese adolescents. J Gastrointest Surg. 2003;7:102–107. doi: 10.1016/S1091-255X(02)00125-7. discussion 107–108. [DOI] [PubMed] [Google Scholar]
- 34.Oberbach A, Neuhaus J, Inge T, Kirsch K, Schlichting N, Bluher S, et al. Bariatric surgery in severely obese adolescents improves major comorbidities including hyperuricemia. Metabolism. 2014;63:242–249. doi: 10.1016/j.metabol.2013.11.012. [DOI] [PubMed] [Google Scholar]
- 35.Serrano OK, Zhang Y, Kintzer E, Moran-Atkin E, Choi J, Melvin WS, et al. Outcomes of bariatric surgery in the young: a single-institution experience caring for patients under 21 years old. Surg Endosc. 2016 doi: 10.1007/s00464-016-4849-2. [DOI] [PubMed] [Google Scholar]
- 36.Sinha M, Stanley TL, Webb J, Scirica C, Corey K, Pratt J, et al. Metabolic effects of Roux-en-Y gastric bypass in obese adolescents and young adults. J Pediatr Gastroenterol Nutr. 2013;56:528–531. doi: 10.1097/MPG.0b013e318283910c. [DOI] [PMC free article] [PubMed] [Google Scholar]
- 37.Maffazioli GD, Stanford FC, Campoverde Reyes KJ, Stanley TL, Singhal V, Corey KE, et al. Comparing Outcomes of Two Types of Bariatric Surgery in an Adolescent Obese Population: Roux-en-Y Gastric Bypass vs. Sleeve Gastrectomy. Front Pediatr. 2016;4:78. doi: 10.3389/fped.2016.00078. [DOI] [PMC free article] [PubMed] [Google Scholar]
- 38.Messiah SE, Lopez-Mitnik G, Winegar D, Sherif B, Arheart KL, Reichard KW, et al. Changes in weight and co-morbidities among adolescents undergoing bariatric surgery: 1-year results from the Bariatric Outcomes Longitudinal Database. Surg Obes Relat Dis. 2013;9:503–513. doi: 10.1016/j.soard.2012.03.007. [DOI] [PMC free article] [PubMed] [Google Scholar]
- 39.Ridker PM, Rifai N, Cook NR, Bradwin G, Buring JE. Non-HDL cholesterol, apolipoproteins A-I and B100, standard lipid measures, lipid ratios, and CRP as risk factors for cardiovascular disease in women. JAMA. 2005;294:326–333. doi: 10.1001/jama.294.3.326. [DOI] [PubMed] [Google Scholar]
- 40.Kannel WB, Castelli WP, Gordon T. Cholesterol in the prediction of atherosclerotic disease. New perspectives based on the Framingham study. Ann Intern Med. 1979;90:85–91. doi: 10.7326/0003-4819-90-1-85. [DOI] [PubMed] [Google Scholar]
- 41.Asztalos BF, Swarbrick MM, Schaefer EJ, Dallal GE, Horvath KV, Ai M, et al. Effects of weight loss, induced by gastric bypass surgery, on HDL remodeling in obese women. Journal of Lipid Research. 2010;51:2405–2412. doi: 10.1194/jlr.P900015. [DOI] [PMC free article] [PubMed] [Google Scholar]
- 42.Osto E, Doytcheva P, Corteville C, Bueter M, Dorig C, Stivala S, et al. Rapid and body weight-independent improvement of endothelial and high-density lipoprotein function after Roux-en-Y gastric bypass: role of glucagon-like peptide-1. Circulation. 2015;131:871–881. doi: 10.1161/CIRCULATIONAHA.114.011791. [DOI] [PubMed] [Google Scholar]
- 43.Benetti A, Del Puppo M, Crosignani A, Veronelli A, Masci E, Frige F, et al. Cholesterol metabolism after bariatric surgery in grade 3 obesity: differences between malabsorptive and restrictive procedures. Diabetes Care. 2013;36:1443–1447. doi: 10.2337/dc12-1737. [DOI] [PMC free article] [PubMed] [Google Scholar]
- 44.Salehi M, D’Alessio DA. Effects of glucagon like peptide-1 to mediate glycemic effects of weight loss surgery. Rev Endocr Metab Disord. 2014;15:171–179. doi: 10.1007/s11154-014-9291-y. [DOI] [PMC free article] [PubMed] [Google Scholar]
- 45.Davidson WS, Inge TH, Sexmith H, Heink A, Elder D, Hui DY, et al. Weight loss surgery in adolescents corrects high density lipoprotein subspecies and their function. Int J Obes (Lond) 2016 doi: 10.1038/ijo.2016.190. [DOI] [PMC free article] [PubMed] [Google Scholar]
- 46.Khera AV, Cuchel M, de la Llera-Moya M, Rodrigues A, Burke MF, Jafri K, et al. Cholesterol efflux capacity, high-density lipoprotein function, and atherosclerosis. N Engl J Med. 2011;364:127–135. doi: 10.1056/NEJMoa1001689. [DOI] [PMC free article] [PubMed] [Google Scholar]
- 47.Rohatgi A, Khera A, Berry JD, Givens EG, Ayers CR, Wedin KE, et al. HDL cholesterol efflux capacity and incident cardiovascular events. N Engl J Med. 2014;371:2383–2393. doi: 10.1056/NEJMoa1409065. [DOI] [PMC free article] [PubMed] [Google Scholar]
- 48.Deshmukh-Taskar P, Nicklas TA, Morales M, Yang SJ, Zakeri I, Berenson GS. Tracking of overweight status from childhood to young adulthood: the Bogalusa Heart Study. Eur J Clin Nutr. 2006;60:48–57. doi: 10.1038/sj.ejcn.1602266. [DOI] [PubMed] [Google Scholar]
- 49.Webber LS, Srinivasan SR, Wattigney WA, Berenson GS. Tracking of serum lipids and lipoproteins from childhood to adulthood. The Bogalusa Heart Study. Am J Epidemiol. 1991;133:884–899. doi: 10.1093/oxfordjournals.aje.a115968. [DOI] [PubMed] [Google Scholar]
- 50.Ippisch HM, Inge TH, Daniels SR, Wang B, Khoury PR, Witt SA, et al. Reversibility of cardiac abnormalities in morbidly obese adolescents. J Am Coll Cardiol. 2008;51:1342–1348. doi: 10.1016/j.jacc.2007.12.029. [DOI] [PubMed] [Google Scholar]
- 51.Marchesi F, Giacosa R, Reggiani V, De Sario G, Tartamella F, Melani E, et al. Morphological Changes in the Carotid Artery Intima after Gastric Bypass for Morbid Obesity. Obes Surg. 2016 doi: 10.1007/s11695-016-2279-9. [DOI] [PubMed] [Google Scholar]