

Abstract
Glioma stem cells (GSCs) and epithelial-mesenchymal transition (EMT) are strongly associated with therapy resistance and tumor recurrence, but the underlying mechanisms are incompletely understood. Here we show that S100A4 is a novel biomarker of GSCs. S100A4+ cells in gliomas are enriched with cancer cells that have tumor-initiating and sphere-forming abilities, with the majority located in perivascular niches where GSCs are found. Selective ablation of S100A4-expressing cells was sufficient to block tumor growth in vitro and in vivo. We also identified S100A4 as a critical regulator of GSC self-renewal in mouse and patient-derived glioma tumorspheres. In contrast to previous reports of S100A4 as a reporter of EMT, we discovered that S100A4 is an upstream regulator of the master EMT regulators SNAIL2 and ZEB along with other mesenchymal transition regulators in glioblastoma. Overall, our results establish S100A4 as a central node in a molecular network that controls stemness and EMT in glioblastoma, suggesting S100A4 as a candidate therapeutic target.
Keywords: cancer stem cells, S100A4, mesenchymal transition, EMT, GBM
INTRODUCTION
Glioblastoma (GBM) is the most aggressive form of brain tumor with median overall survival of only 15.6 months with standard of care (radiation and Temozolamide) and 20.5 months with addition of tumor treating fields (1). GBM can be classified into four molecular subgroups: neural, proneural, classical, and mesenchymal (2). Of these, the mesenchymal (MES) subgroup has the worst prognosis (2,3). Concordantly, proneural and classical tumors often display the mesenchymal phenotype at recurrence, and radiation and chemotherapy treatments also enhance mesenchymal gene expression signatures (2–4). While it is not yet clear whether the observed phenotypic switch is due to clonal selection or epigenetic reprogramming, these clinical observations suggest that MES transition is associated with therapy resistance and tumor progression.
Several lines of evidence suggest that the epithelial-mesenchymal transition (EMT), which allows epithelial cells to acquire mesenchymal phenotype, is associated with acquisition of stemness in other cancers (5,6). Stem cell-like cancer cells, or cancer stem cells, by definition share the defining characteristics of normal stem cells and have enhanced ability to initiate tumors upon transplantation (7). Glioma stem cells (GSCs) have been shown to be more resistant to chemo- and radiation therapies compared to bulk tumor cells and seed recurring tumors in vivo (7–10). Major challenges in studying GSCs include the lack of a definitive GSC marker that identifies GSCs across different patient tumors and the dynamic nature of the GSC state. Recent studies showed that cellular hierarchy in GBMs is not strictly unidirectional and may be reversible (11). For example, environmental stresses such as acidosis and hypoxia have been shown to confer the GSC phenotype to non-GSCs (12,13). Therefore, GSC regulators that are also associated with EMT and MES transition may be particularly useful molecular targets to inhibit therapy-resistant glioma cells.
S100A4, also known as FSP1/mts-1/metastasin/pEL98, is a gene encoding a small calcium binding protein that interacts to other proteins, such as p53 (14), non-muscle Myosin IIa (15), and Annexin 2 (16) to enhance apoptosis, cell motility, and angiogenesis. S100a4 is used as a marker of EMT and mesenchymal cells and its function is critical for breast cancer metastasis (17–22). High levels of S100A4 expression are associated with poor prognosis in multiple human cancers (23). For many years, it has been used as a marker and a promoter of EMT and mesenchymal phenotype in a variety of tissue systems (23,24)(25,26). Interestingly, its expression is reported to be elevated in purified hair follicle stem cells (27–29). In an earlier study, we identified S100a4 as one of 45 genes differentially expressed in purified GSCs compared to bulk tumor cells from the same glioma and also syngeneic normal neural stem cells (30). In the normal brain, S100A4 is expressed in a subset of GFAP+ astrocytes and reactive astrocytes upon brain injury (31–33); however, little was known about its function in brain tumors.
Here, we report that S100a4 is a novel marker and a critical regulator of GSCs. Using genetically engineered mouse models and patient-derived GBM tumorspheres, we show that cells with high-S100A4 expression are enriched with tumorsphere formation and tumor initiating abilities in vivo, and that S100A4 function is necessary to maintain self-renewal of GSCs. Furthermore, selective ablation of S100a4+ cells in vivo is sufficient to block tumor growth, providing experimental support for the cancer stem cell model. Importantly, we discovered that S100A4 is an upstream regulator of SNAIL2, ZEB1 and the mesenchymal signature genes in GBM, identifying S100A4 as a novel upstream regulator of these “master regulators”. In summary, we report that S100A4 is not only a novel marker and a regulator of GSCs but also a molecular links that couples mesenchymal transition and stemness in GBMs.
MATERIALS AND METHODS
Mice
S100a4-EGFP (B6.129S6-S100a4tm1Egn/YunkJ), S100a4-HSV-TK (B6.Cg-Tg(S100a4-TK)M31Eng/YunkJ), and TgS100a4-EGFP (B6.Cg-Tg(S100a4-EGFP)M1Eng/YunkJ), were obtained from Eric Neilson’s laboratory (22). The S100ß-verbB glioma model (Weiss et al., 2003) was originally from Mark Israel and maintained on the C57BL6/J background in the Yun lab. p53 (B6.129S2-Trp53tm1TyjI/J), JAX# 002101, NSG (NOD.Cg-Prkdcscid Il2rgtm1Wjl/SzJ), JAX# 005557, B6 (C57BL/6J), JAX# 000664 were obtained from the JAX repository. GBM PDX models (BN207F and BN289F) were obtained from the JAX-West PDX Resource. See JAX Mouse Tumor Database for information regarding these models. Mice were housed and handled in accordance with protocols approved by the JAX ACUC committee.
Human GBM tissues
Tissue Microarrays were purchased from Creative Biolabs (CBL-TMA-019, CBL-TMA-203). Additional paraffin-embedded GBM samples were obtained from Maine Medical Center Tissue repository without linked patient information (approved by the Maine Medical Center Institutional Review Board (IRB#3202X)).
Tumor harvest and FACS sorting
S100a4-GFP;S100ß-verbB;p53 spontaneous tumors were harvested and dissociated single-cell suspensions were plated in TSC media (DEME;F12 + B27 + Pen/strep) at high density to establish a tumorsphere line or at a clonal density (1cell/μl) to test the frequency of sphere forming cells in each tumor. For FACS sorting, dissociated single cells were resuspended in FACS buffer (3% BSA, 1X PBS), Propidium iodide was used to exclude dead cells, and sorted on a FACSAria II cell sorter. Gates for GFP+ cells were set using S100ß-verbB;p53 control glioma cells.
Intracranial injections
1,000 FACS sorted GFP+ or GFP− cells were injected into the striatum of NSG mice using a stereotaxic device (Bregma: −2.5/-1/-3).
Cytovene treatment in vivo
2×10⁵ S100a4-HSVtk;S100ß-verbB;p53+/− cells at passage 2 were injected into flanks of 3 months-old NSG mice and treated daily with PBS or Cytovene (75mg/kg) for 14 days. Tumor size measurement was performed as mentioned above. On day 15, tumors were harvested and tumor weights were determined.
Tissue culture
Mouse glioma tumorspheres were isolated from spontaneous forebrain tumors in S100ß-verbB;p53 mice as previously described (Harris et al., 2008). Human GSC lines were derived from PDX models or from consenting patient tumors as described in Emery et al. (in press) and cultured in hNSC medium (DMEM: F12 + B27+ pen/strep with EGF (20ng/mL) and bFGF (10ng/mL). For secondary sphere formation assays, low passage (p<10) cultures were dissociated with Accutase and viable cells were seeded at a clonal density (1 cell/uL) in 6-well plates in triplicate. Spheres were counted when tumorspheres reached >50 cells or ~100–200μm in size.
siRNA transfection
20nM- 40nM of siRNAs, scramble/scm (AGUACGACGGUAAGGCUGUAtt), Si1 (GAGGGUGACAAGUUCAAGCUtt) (Radestock, Willing et al. 2010), or Si2 (GGACAGAUGAAGCUGCUUUCtt) (Kato, Kojima et al. 2005) were transfected into patient-derived GBM tumorsphere cells using RNAiMAX (Life Technologies 13778-075) according to manufacturer’s instructions.
Statistical analysis
Student t-test was used to calculate the means and P values for pairwise comparisons. Kaplan-Meier survival curves were generated using the GraphPad Prism6 software. Please see Supplementary Methods for computational analyses of the TCGA and RNA-seq analyses.
Data Availability
The raw RNA-seq data are available at Sequence Read Archive (SRP105051) and will be released upon acceptance of this manuscript.
RESULTS
S100A4 is an independent prognostic indicator of glioma patient survival and is strongly associated with the mesenchymal subtype
To determine whether S100A4 plays a significant role in human gliomas, we first analyzed its expression pattern in human glioma datasets. First, we analyzed the REMBRANDT (REpository for Molecular BRAin Neoplasia DaTa) database, and observed that patients with upregulated S100A4 RNA levels have a significantly worse prognosis among all glioma and astrocytoma patients (Figure 1A). This observation is consistent with our previous report that the number of S100A4+ cells in human glioma tissues correlated positively with glioma grade (30). To assess whether S100A4 expression level can stratify GBM (grade IV glioma) patient survival, we analyzed the TCGA (The Cancer Genome Atlas) GBM dataset. While S100A4 level did not stratify all GBM patient survival, S100A4 RNA level alone was a significant independent prognostic indicator of survival among the mesenchymal molecular subgroup (p= 0.026, Figure 1B). Consistently, the average S100A4 RNA level was highest in the mesenchymal subgroup (p-value=2.3e-17, Figure 1C). Furthermore, S100A4 RNA level was strongly positively associated with mesenchymal subgroup markers (CD44, VIM, FN1, TIMP1, TGFB1, and SERPINE1) and the master regulators of EMT (SNAIL1, SNAIL2, and TWIST) (Figure 1D, Supplementary Table 1). At the same time, S100A4 RNA level is negatively associated with proneural subtype markers (DLL3, NCAM1, OLIG2, and ASCL1) (4) (Figure 1D, Supplementary Table 1), suggesting that it might function as a molecular switch between the two cell states. S100A4 gene amplification is also significantly associated with poorer survival among all glioma patients in the REMBRANDT dataset (Figure 1E). Together, these data indicate that S100A4 is strongly associated with the mesenchymal phenotype in human GBMs and that it might play a significant role in proneural-to-mesenchymal transition.
Figure 1. High-S100A4 expression is associated with mesenchymal GBMs and predict poor GBM patient survival.
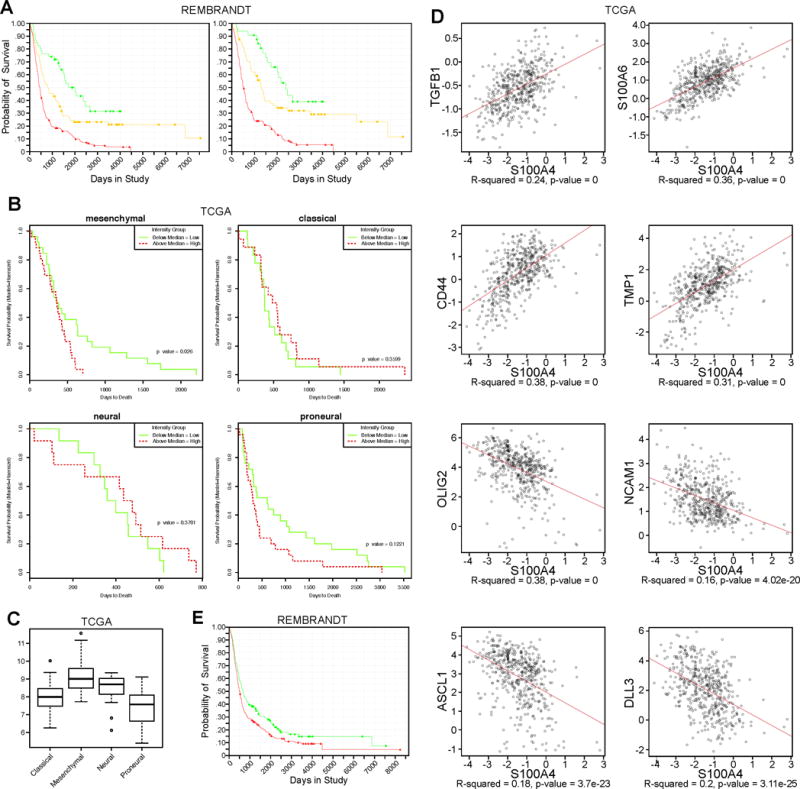
A) Kaplan-Meier survival curve of all glioma patients (LEFT) using S100A4 expression levels (red: upregulated, yellow: intermediate, green: downregulated). REMBRANDT data analysis: p=8.6E-6 for up vs. intermediate, p=5.7E-9 for up vs. down, and p=0.009 for down vs. intermediate. Right: Kaplan-Meier survival curve of astrocytoma patients only, using S100A4 expression levels in REMBRANDT database. P=0.04 for up vs. intermediate, p=0.006 for up vs. down, and p=0.211 for down vs. intermediate (red: upregulated, yellow: intermediate, green: downregulated).
B) Kaplan-Meier survival curve of patients in TCGA GBM database using S100A4 expression levels, separated by molecular subgroups.
C) Average expression levels of S100A4 in the four molecular subgroups of GBM in TCGA.
D) Expression correlation between S100A4 and mesenchymal or proneural signature gene expression, using all samples in the TCGA GBM database.
E) Kaplan-Meier survival curve of all glioma patients in the REMBRANDT data by S100A4 copy number. P=0.019 for amplified vs. deleted. (red: amplified, green: deleted).
S100a4-expressing cells are enriched with GSCs
Having established a potential role in human gliomas, we tested whether S100A4 is a novel marker of GSCs. Since S100A4 is not a cell surface marker, we took advantage of transgenic reporter mouse strains that express EGFP reporter in S100a4+ cells (22,34): the S100a4-EGFPKI and the TgS100a4-EGFP transgenic mice (Figure 2A). Our observations were consistent with both of these strains, and unless noted, we present data using the S100a4-EGFPKI/+ strain, which has one intact copy of the S100a4 gene.
Figure 2. S100a4+ cells are enriched with glioma stem cells.
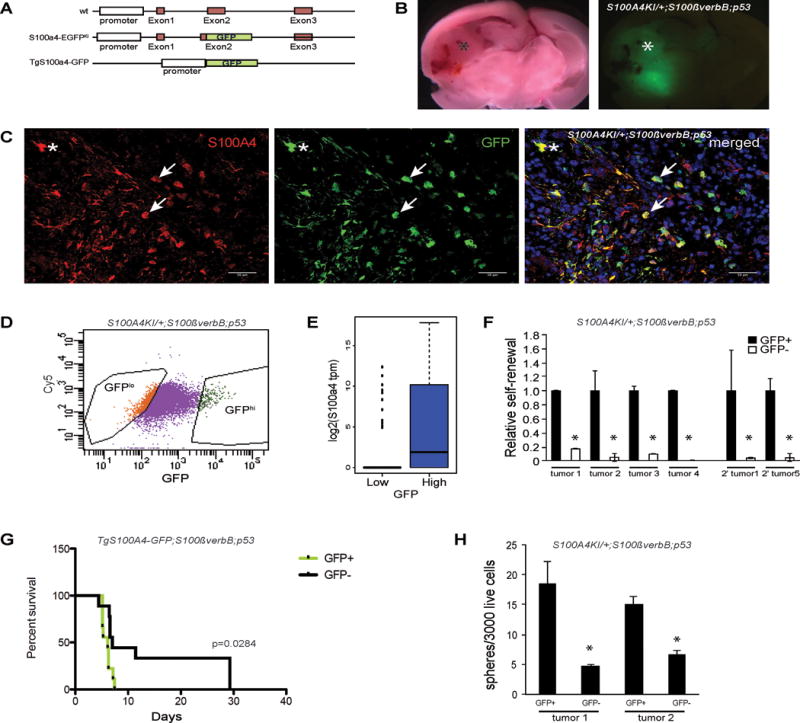
A) Schematic representation of the S100a4-EGFPKI knock-in and TgS100a4-GFP transgenic mice.
B) Spontaneous S100a4-EGFPKI/+;S100ß-verbB;p53−/− glioma showing GFP+ tumors cells in the tumor region.
C) Immunofluorescence analysis of a spontaneous S100a4-EGFPKI/+;S100ß-verbB;p53−/− tumor showing overlapping expression of GFP and S100A4. Arrows point to S100A4+/EGFP+ glioma cells. * indicates normal astrocytes. Scale bar indicates 50 μm.
D) FACS sorting of acutely dissociated S100a4-EGFPKI/+;S100ß-verbB;p53−/− tumor cell.
E) S100a4 RNA levels in individual GFP-low and GFP-high cells from S100a4-EGFPKI/+;S100ß-verbB;p53−/− tumorspheres, measured by single cell RNA-seq analysis.
F) Sphere formation assays of freshly dissociated tumor cells from 4 independent spontaneous S100a4-EGFPKI/+;S100ß-verbB;p53−/− gliomas and 2 independent secondary tumors, comparing high GFP (GFP+) or low GFP (GFP−) expressing cells. * marks observations with p<0.05.
G) Freshly sorted GFP+ and GFP− cells from a spontaneous TgS100a4-GFP tumor were orthotopically injected, and survival was analyzed by a Kaplan-Meier curve (n=9 each group, p=0.0284, median for GFP+=6.143, GFP−= 7.0]
H) Self-renewal analyses performed on unsorted tumor cells from tertiary S100a4-EGFPKI/+;S100ß-verbB;p53−/− tumors arising from injection of FACS sorted GFP+ or GFP− secondary tumor cells. All sphere formation assays were performed in triplicates.
To use FACS to sort S100a4+ cells from spontaneous gliomas, we crossed S100a4-EGFPKI mice to the S100ß-verbB;p53−/− glioma mouse model (35) to generate S100a4-EGFPKI/+;S100ß-verbB;p53−/− mice. These mice developed spontaneous brain tumors throughout the CNS (not shown). To account for regional differences in the brain, we limited our analyses to gliomas that formed in the forebrain in this study (Figure 2B). In S100a4-EGFPKI/+;S100ß-verbB;p53−/− gliomas, all EGFP+ cells were S100A4+ (Figure 2B,C), indicating faithfulness of the EGFP reporter. Some of these cells have the typical cellular morphology of reactive astrocytes (asterisk in Figure 2C) and express GFAP (Supplementary Figure 1A) while others have a more stunted morphology, with a high nucleus/cytoplasm ratio and short processes characteristic of glioma cells (arrows in Figure 2C and Supplementary Figure 1), as we previously described(30).
To test their GSC properties, we used FACS to sort for S100a4+/EGFPhi cells and S100a4-/EGFPlo cells from spontaneous gliomas (Figure 2D, E). First, we plated EGFPhi and EGFPlo cells from multiple spontaneous tumors (n=7) at a clonal density (1 cell/μl) in serum-free stem cell medium to measure sphere formation. We observed that tumorsphere-forming cells were significantly enriched in the S100A4+/EGFPhi population in every tumor we tested (Figure 2F and not shown). Second, serial passaging of S100A4+/EGFPhi and S100A4-/EGFPlo cells in vitro showed significant increase in long-term self-renewal ability in the S100A4+/EGFPhi population (Supplementary Figure 1B). Third, we assessed the numbers of sphere-forming cells in secondary tumors (spontaneous tumors transplanted into a wildtype host brain). When transplanted (secondary) tumors were acutely dissociated and FACS sorted, sphere formation was again greatly enriched in S100a4+/EGFPhi population (Figure 2F), indicating that S100a4+/EGFP+ cells are enriched with long-term self-renewing cells in vivo.
To functionally test whether S100a4+/EGFPhi cells are enriched with tumor-initiating cells, we FACS sorted cells from a spontaneous tumor (TgS100a4-EGFP;S100ß-verbB;p53−/−) and orthotopically injected 1,000 S100a4+/EGFPhi or S100a4-/EGFPlo cells into NSG (NOD-scid IL2Rgnull) mice. Consistent with sphere formation assay results in vitro, mice injected with S100a4+/EGFPhi cells succumbed to brain tumors significantly earlier than mice injected with S100a4-/EGFPlo cells (Figure 2G). Note that the S100a4+/EGFPhi population from S100a4-EGFPKI/+;S100ß-verbB;p53−/− mice contain a significant number of non-tumor cells (normal astrocytes) that express S100a4/EGFP (Figure 2C, Supplementary Figure 1A), diluting the concentration of tumorigenic cells in the S100a4+/EGFPhi fraction. In addition, we observed that GFP− injected tumors contained GFP+ cells, suggesting that S100A4 expression may be re-activated in growing tumors (Supplementary Figure 2A, B). To further test whether S100A4+ cells are enriched with long-term self-renewing cells in vivo, we measured the sphere forming cells in transplanted tumors from either S100a4+/EGFPhi or S100a4-/EGFPlo cell injections. Sphere forming cells were significantly more frequent in tumors arising from S100a4+/EGFPhi cell-injections than those arising from S100a4-/EGFPlo cell-injections (Figure 2H), demonstrating that greater percentages of S100a4+EGFPhi progeny cells retain long-term self-renewal ability in vivo. Together, these data indicate that S100a4 expressing cells are enriched with long-term self-renewing ability and tumorigenic cells in vivo and in vitro.
Previous studies have shown that tumor vasculature forms a niche for GSCs (36). To determine whether S100A4+ cells are positioned in the perivascular region, we performed intravital imaging of S100A4+ cells in growing tumors (n=3). S100a4EGFPKI/+;S100β-VerbB;p53−/− cells were injected into C57BL/6J mouse brains and longitudinally imaged through a cranial window as they grew. As shown in Figure 3A, B, C, the great majority of S100A4+ cells (~80%) were in contact with the vasculature (n=156), providing in vivo evidence that S100A4+ cells preferentially localize to the perivascular region.
Figure 3. S100A4hi cells in human and mouse tumors are quiescent but enter cell cycle to initiate tumors.
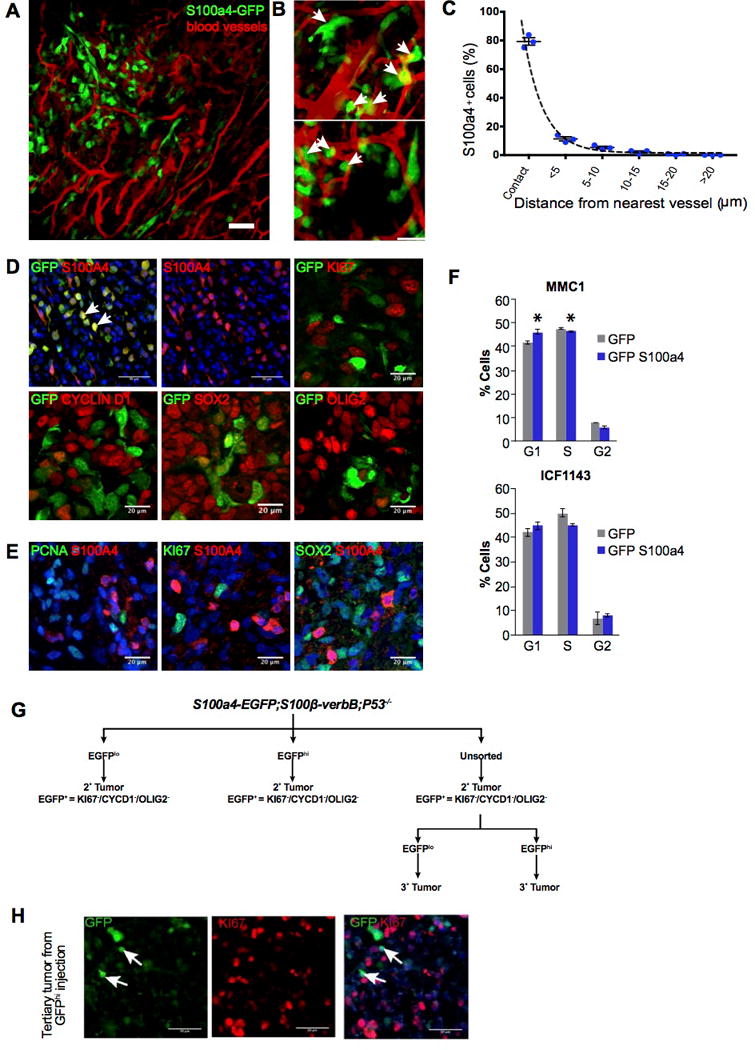
A) Intravital imaging of S100a4-EGFPKI/+;S100β-VerbB;p53−/− tumor in vivo.
B) Representative zoomed in 2D images showing close association of S100A4hi cells (green) with tumor vasculature (red). Scale bar, 20 μm.
C) Frequency of S100A4hi cells (n = 156, from 3 mice) plotted against proximity to nearest tumor vasculature.
D) Immunofluorescence analyses with indicated markers of secondary tumors derived from injecting unsorted S100a4-EGFPKI/+;S100ß-verbB;p53−/− tumor cells. Quantitation: (GFP+ KI67+)/(Ki67+) = 0.466% (tumor1) and 0.264% (tumor 2); (GFP+ Ki67+)/(GFP+) = 1.6% (tumor1) and 0.866%(tumor 2). Scale bars show 50 μm (upper left and middle panels showing GFP+S100A4 and S100A4 alone), 20 μm on other panels.
E) Double immunofluorescence analyses of human GBM tissues stained with indicated markers. Quantitation: (S100A4+ KI67+)/(Ki67+) = 0% (tumor1), 0.264% (tumor 2); (S100A4+ Ki67+)/(S100A4+) = 0% (tumor1), 0%(tumor 2). Scale bars = 20 μm.
F) Two independent human GSC cell lines over-expressing GFP (control) or S100A4 were stained with Propidium iodide and FACS scanned to analyze cell cycle profiles. S100A4 over-expression resulted in statistically significant accumulation of cells in G0/G1 and reduced percentages of cells in the S- and G2- phases in MMC1 cells. Similar trend was observed in ICF1143 cells but the effect did not reach statistical significance. * indicates p value < 0.05.
G) A schematic representation of passage of tumor cells to generate secondary and tertiary tumors, all of which displaying quiescent nature of GFP+ cells with indicated markers
H) Immunofluorescence analysis of GFP+/GFP− injected tertiary tumors with GFP and KI67. Arrows point to S100A4+/GFP+ cells. Scale bar = 50 μm.
S100a4-expressing cells are quiescent in GBMs
Previous studies have also suggested that cancer stem cells may be more resistant to cytotoxic chemo- and radiation therapies because they are quiescent (10,37,38). To test whether S100A4+ cells are quiescent in vivo, we analyzed proliferation marker expression in S100A4+ cells in human and mouse gliomas. To focus on S100A4+ cancer cells and to exclude normal astrocytes from our analyses, we transplanted acutely dissociated spontaneous S100a4-EGFPKI/+;S100ß-verbB;p53−/− tumors into NSG (NOD-SCID;Il2gr−/−) mice. GFP+ cells in resulting allografts should only compose of GFP+/S100A4+ tumor cells (arrows in Figure 3D). When we performed double immunofluorescence analyses, >95% of all EGFP+ cells in the tumor were negative for cell-cycle markers CYCLIN D1 and KI67 (Figure 3D). Quantitation showed that <1% of KI67+ cells were EGFP/S100A4+ and <2% of EGFP+/S100A4+ cells were KI67+.
To test whether S100A4+ human GBM cells are also quiescent, we analyzed GBM tissue microarrays using antibodies against S100A4, KI67, and PCNA. In human GBM patient tumor tissues (Figure 3E), 0% of S100A4+ cells were KI67+ or PCNA+ and <0.264% of KI67+ cells were double positive for S100A4+. Interestingly, S100A4+ cells in both murine and human GBMs showed low to no expression of OLIG2 and SOX2 (Figure 3D,E and not shown), similar to quiescent GSCs reported in a different GBM mouse model (38). To test whether high-level S100A4 expression induces cell cycle arrest, we ectopically expressed S100A4 in two independent primary human GBM tumorsphere lines and observed that high levels of S100A4 expression increased accumulation of cells in G0/G1 phase of the cell cycle (Figure 3F). These analyses from multiple human and mouse GBMs in vivo and in vitro indicate that S100A4hi cells are quiescent or slow cycling cells.
To test whether quiescent S100A4-expressing cells can re-enter the cell cycle in vivo, S100A4+/EGFPhi (KI67-) cells from secondary tumors were FACS sorted and S100a4+/EGFPhi and S100a4-/EGFPlo cells were injected into NSG brains to initiate tertiary tumors (Figure 3G). Transplanted S100A4+/EGFPhi cells were able to re-enter the cell cycle, initiate tumor formation, and generate highly proliferative tertiary tumors. Again, in well-established tumors, KI67+ tumor cells were negative for S100A4/GFP (Figure 3H).
Selective ablation of S100a4-expressing tumor cells is sufficient to block tumor growth in vivo
To determine whether selective ablation of S100A4+ cells is sufficient to block tumor growth, we used a genetically engineered mouse strain in which an inducible suicide gene (HSVtk) is expressed under control of the S100a4 promoter (Tg S100a4-HSVtk, Figure 4A)(22). We generated S100a4-HSVtk;S100ß-verbB;p53−/− mice that form spontaneous gliomas in which S100a4+ cells can be selectively ablated by Cytovene (ganciclovir) administration.
Figure 4. Selective ablation of S100a4+ cells is sufficient to block glioma growth in vivo.
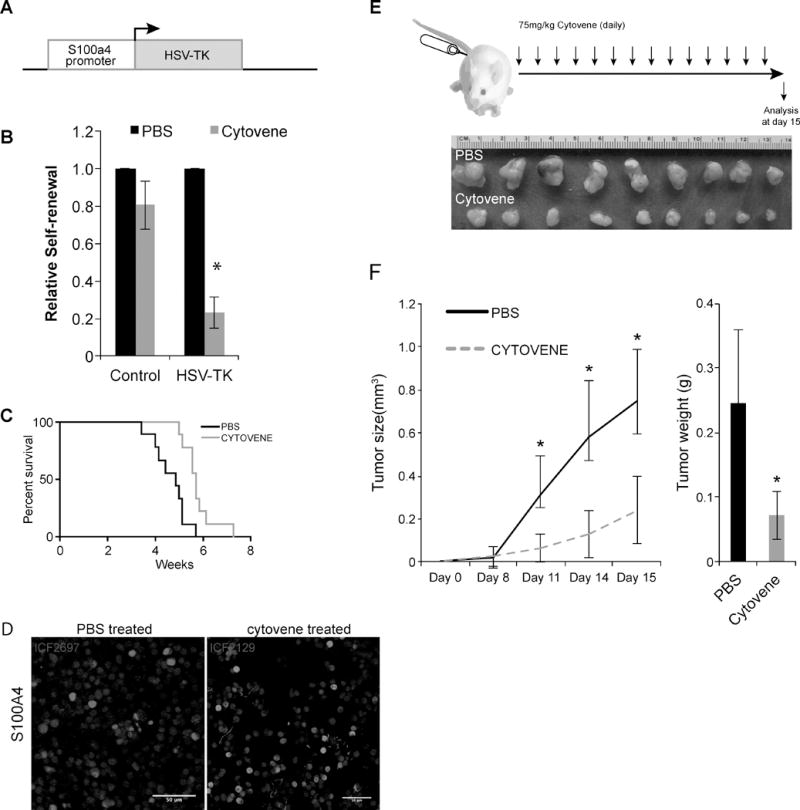
A) A schematic representation of S100a4-HSVtk transgenic mice.
B) Self-renewal analyses on Control (TgS100a4-EGFP;S100ß-verbB;p53−/− derived tumor cells) and HSV-TK (S100a4-HSVtk;S100ß-verbB;p53+/−) tumor cells treated with either PBS or 10uM of Cytovene. Cytovene is the brand name for ganciclovir sodium for injections. * indicates p values <0.05, error bars=SEM. Two independent S100a4-HSVtk;S100ß-verbB;p53+/− tumor lines were tested and each line was tested on 3 separate passages.
C) S100a4-HSVtk;S100ß-verbB;p53+/− cells were in vitro treated with either PBS or Cytovene and then intracranially injected (n=9, med survival Cytovene treated = 5.71 and PBS treated= 4.87) p=0.0034.
D) S100A4 antibody staining on tumors arising from (C). n=2 each. Scale bar indicates 50 μm.
E) S100a4-HSVtk;S100ß-verbB;p53+/− cells were first injected into flank of NSG mice and then treated with PBS or Cytovene daily (75mg/kg, a non-toxic dose we determined).
F) Average tumor volume in PBS or Cytovene treated mice, and average tumors weights at harvest. * indicates p values <0.05, error bars=SEM.
First, we isolated tumorspheres from control (S100a4-EGFPKI/+;S100ßverbB;p53−/−) and S100a4-HSVtk;S100ß-verbB;p53+/− tumors and plated them at a clonal density (1cell/μl) and treated them with either PBS or 10μM Cytovene (ganciclovir) in vitro. As anticipated, self-renewal was not significantly affected by Cytovene treatment in control cells (Figure 4B). In contrast, self-renewal of S100a4-HSVtk;S100ß-verbB;p53+/− cells was significantly compromised when treated with Cytovene (p=0.001, Figure 4B), consistent with enriched sphere formation in S100a4+/EGFPhi cells (Figure 2E).
To functionally test whether ablation of S100a4+ cells is sufficient to eliminate tumor-initiating cells, we first treated S100a4-HSVtk;S100ß-verbB;p53+/− cells with either Cytovene or PBS and then orthotopically injected them into NSG mice. As shown in Figure 4C, mice injected with cultures pre-treated with Cytovene survived significantly longer than mice injected with cultures containing S100a4+ cells (p=0.0034). Interestingly, S100A4 antibody staining of tumors derived from these injections showed equivalent numbers of S100A4+ cells in established tumors (Figure 4D). This suggests either that in vitro Cytovene treatment did not eliminate all S100A4+ cells prior to injection (such as quiescent S100A4+ cells that are not targeted by Cytovene since Cytovene only kills actively cycling cells) or that S100Aa4 expression is reactivated upon transplantation.
Finally, to test whether selective ablation of S100A4+ cells in established tumors in vivo is sufficient to slow tumor growth, we injected freshly dissociated S100a4-HSVtk;S100ß-verbB;p53+/− glioma cells into NSG mice to generate a cohort. We then treated the mice with either PBS or Cytovene (75mg/kg daily I.P. injection for 2 weeks). Consistent with our in vitro results, selective ablation of S100a4+ cells significantly reduced tumor growth (Figure 4E, F). Residual tumor still contained S100A4+ cells. Together, these in vitro and in vivo data indicate that S100a4+ cells are enriched with GSCs and that selective elimination of S100a4+ cells is sufficient to suppress tumor growth, supporting the cancer stem cell model.
S100A4 is functionally required for promotion of human and mouse GSC self-renewal and survival
Next we assessed the molecular function of S100a4 in human and mouse GBM tumorspheres. S100A4 is not necessary for spontaneous tumor formation in S100ßverbB;p53−/− mice since S100A4−/−;S100a4 in S100ßverbB;p53−/− mice could form spontaneous gliomas. However, tumorspheres isolated from S100A4−/−;S100a4 in S100ßverbB;p53−/− glioma showed significantly reduced self-renewal and in vitro growth (Figure 5A,B), rapidly depleting the cultures. To overcome this challenge, we infected S100ß-verbB;p53−/− tumorsphere cells with lentivirus expressing two different short hairpin RNAs (shRNAs) against S100a4 to knockdown S100a4 expression in vitro. Both shRNAs reduced S100A4 protein levels by >80% compared to control shRNA in murine glioma tumorspheres (Figure 5C). Consistent with genetic deletion analysis (Fig 5A,B), S100a4 shRNA-expressing cells showed dose-dependent reduction in proliferation (Figure 5D), increased cell death (Figure 5E), and increased cleaved Caspase 3 levels (Figure 5C). Importantly, when these cells were injected into B6 wildtype host mice, the mice also showed significant reduction in tumor growth rate, volume, and weight in a dose dependent manner (Figure 5F, G, Supplementary Figure 2C).
Figure 5. S100a4 function is required for self-renewal and survival of mouse GSCs.
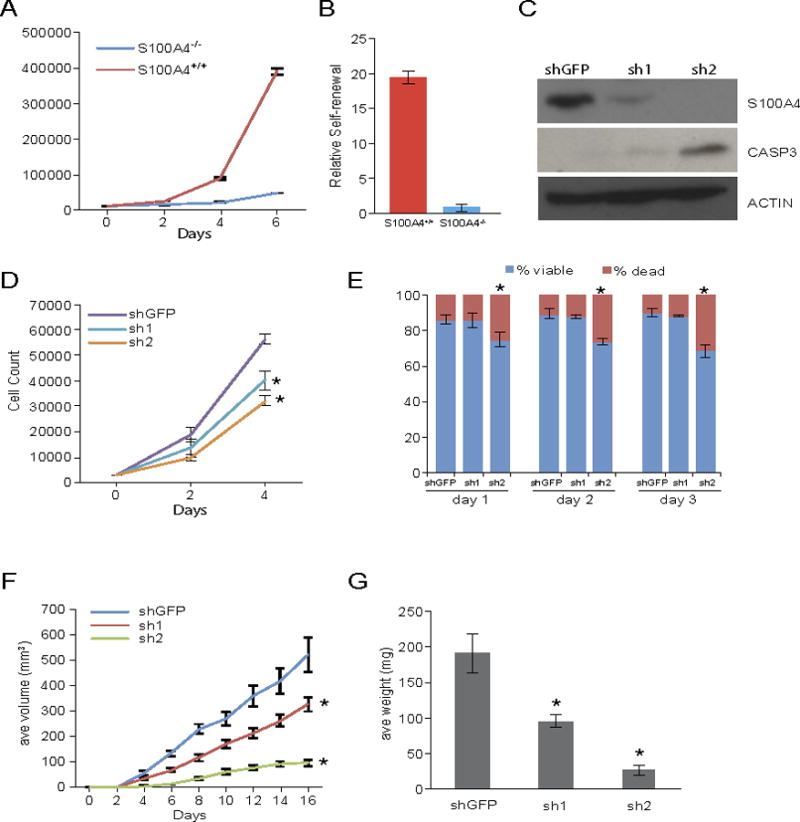
A, B) Growth curve and self-renewal analyses of tumor cells derived from S100a4-EGFPKI/KI;S100ß-verbB;p53−/− tumor (S100a4−/−) and TgS100a4-EGFP;S100ß-verbB;p53−/− tumor (S100a4+/+ control). Panel A: p-values on day 2 = 0.02, day 4=0.0034, and day 6=0.0009. Panel B: p-value = 0.0004.
C) Immunoblot showing stable knockdown of S100a4 in TgS100a4-EGFP; S100ß-verbB;p53−/− tumor cells using two different shRNAs and increased apoptosis in knockdown cells (cleaved caspase 3). Control shRNA: shGFP.
D,E) Growth curve analysis of stable knockdown cells and relative percentages of live and dead cells. * indicates p value <0.05.
F, G) Control and two different shRNA S100a4 knockdown cells were injected into C57BL/6J host mice and tumor volume/weight were measured. * indicates p values <0.05.
To test whether S100A4 plays a similar critical role in human GBMs, we analyzed S100A4 expression and function in low passage (p<10) tumorspheres isolated from GBM patient tumors or PDX (Patient derived xenograft) models. Consistent with the TCGA expression analysis (Figure 1C), different GBM tumorsphere lines showed varying levels of S100A4 expression (Figure 6A, B). Using gene expression signatures for proneural and mesenchymal GBM tumorsphere lines (4), we analyzed mesenchymal signature gene scores in different tumorsphere lines (Figure 6C). Tumorsphere lines with strong mesenchymal signature (such as SN289) showed higher levels of S100A4 expression than tumorspheres with low mesenchymal signature scores (such as MMC1, MMC5, and SN207, Figure 6A, B, C). To test S100A4 function, we knocked down S100A4 using two different siRNAs (si1 and si2) in three independent human GBM tumorsphere lines (MMC1, MMC11, and GNV019, Figure 6D). Similarly to S100ß-verbB;p53−/− mouse glioma tumorspheres (Figure 5), S100A4-knockdown significantly reduced proliferation and self-renewal (Figure 6E and F, respectively). Note that we consistently observed a more dramatic decrease in secondary sphere formation assays (Figure 6F) than in over-all viability assays (Figure 6E), supporting the notion that S100A4 is necessary in a small subset of self-renewing tumor cells, i.e. GSCs. Together, these results indicate that S100a4 is not only a novel marker of GSCs but also a significant regulator of GSC proliferation, survival, self-renewal and tumor growth.
Figure 6. S100A4 is required for self-renewal of human GSCs.
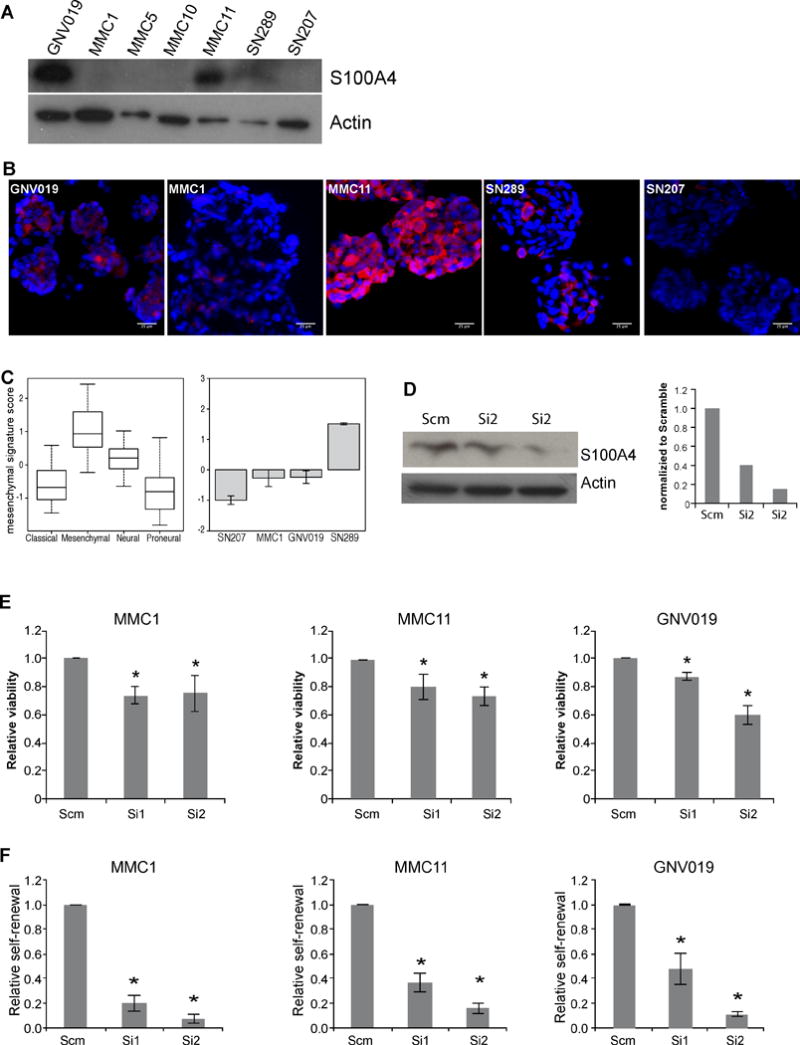
A) Western blot analyses of S100A4 expression levels in seven independent human GSC lines. GNV019, MMC1, MMC5, MMC10, and MMC11 were derived from patient tumors. SN289 and SN207 were derived from GBM PDX models.
B) S100A4 antibody staining on various GSCs. Scale bar indicates 25 μm.
C) Analysis of S100A4 expression in TCGA GBM dataset and assignment of molecular subgroup classification to human GSC lines based on RNA analysis from each GSC line.
D) Western blot analysis and quantification of S100A4 expression levels in human GSCs treated with two different siRNAs against S100A4.
E) 3 × 10⁴ viable cells from three independent GSC lines were transfected with scramble, siRNA1 or SiRNA2 and plated in 96-well plates in triplicates. Viability was measured 48 hours later. * indicates p values <0.05, error bars=SEM.
F) Self-renewal analyses of three independent GSC lines were determined by transfecting scramble or two different siRNA against S100A4 and plating them at 1cell/μl density to measure sphere formation. * indicates p values <0.05, error bars=SEM.
S100A4 regulates mesenchymal genes and metabolism GBM cells
To identify potential mechanisms of S100A4 function, we performed RNA-seq analyses using two different siRNAs against human S100A4 in MMC1 tumorsphere cells. With a stringent statistical cutoff (q<0.05 and FC > 2×), 1,126 genes were commonly differentially expressed in both siRNA-treated samples compared to scramble siRNA-treated cells (Figure 7A, Supplementary Table 2). Interestingly, S100A4 knockdown significantly reduced mesenchymal GSC signature genes (TIMP and CD44) and increased proneural GSC signature genes (ASCL1, and NCAM1) (Figure 7B). In addition, “master transcriptional regulators” of the GBM mesenchymal gene expression signature (39) – CEBPB, CEBPD, bHLHE40, FOSL2, and RUNX1 – were all downregulated by S100A4 knockdown (Figure 7C), suggesting that S100A4 is an upstream regulator of these master transcription factors. We validated these results in an independent set of S100A4-knockdown samples using qRT-PCR. Knockdown of S100A4 in multiple human GBM tumorsphere lines showed consistent downregulation of the mesenychymal genes: VIM, YKL40, and CD44 and increased expression of the proneural GSC marker NCAM1 (Figure 7D). We also analyzed the TCGA data and observed that S100A4 expression is significantly correlated with expression of the master transcriptional regulators FOSL2 and CEBPB, as well as mesenchymal differentiation regulator, WWTR1/TAZ (40)(Figure 7E, Supplementary Table 1). Immunofluorescence analyses with MES markers (VIMENTIN and CD44) showed that S100A4+/GFP+ cells co-express these markers at the protein level (Figure 7F). Together with strong negative correlation to proneural genes and positive correlation to mesenchymal genes in the TCGA data set (Figure 1D and Supplementary Table 1), these functional analyses results indicate that S100A4 may be a molecular switch that regulates the transition between the proneural and mesenchymal states.
Figure 7. S100A4 is upstream of master regulators of EMT and the mesenchymal GBM signature genes.
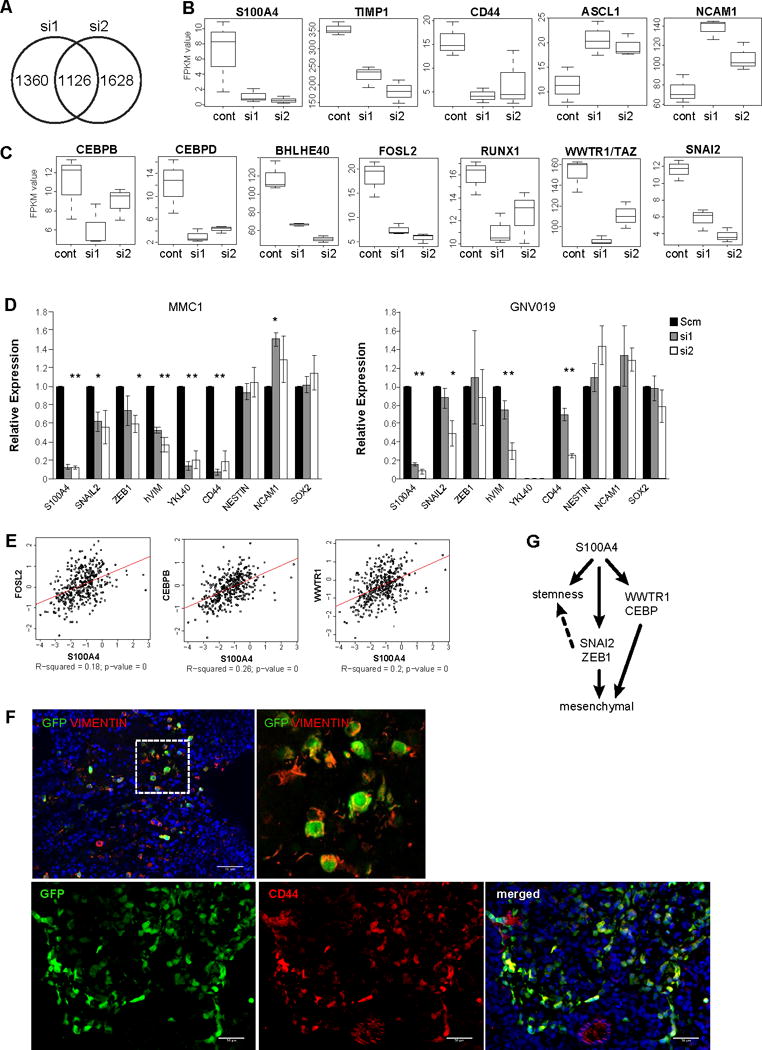
A) A Venn diagram indicating the number of genes with significantly altered expression levels by two different S100A4 siRNAs in MMC1 cells.
B) Boxplots showing expression levels of mesenchymal and proneural GSC marker genes in control and S100A4 knockdown cells, measured by RNA-seq.
C) Boxplots showing expression levels of the master transcriptional regulators of GBM mesenchymal signature genes (CEBPB/D, BHLHE40, FOSL2, RUNX1, and TAZ) and EMT (SNAIL2) in control and S100A4 knockdown cells, measured by RNA-seq.
D) Realtime RT-PCR validation of reduced EMT and mesenchymal signature gene expression by S100A4 knockdown in two independent GSC lines (MMC1 and GNV019). * indicates p values <0.05, error bars=SEM.
E) Expression correlation analysis of S100A4 vs. FOSL2, CEBP, and WWTR1/TAZ using the TCGA GBM dataset.
F) Gliomas derived from injection of spontaneous S100a4-EGFPKI/+;S100ß-verbB;p53−/− glioma cells. Immunofluorescence analyses with markers of MES subtype GBM, CD44 and VIM, showing co-expression in GFP+/S100A4+ glioma cells.
G) A working model of S100A4 function in regulating GSC self-renewal, EMT, and the mesenchymal phenotype.
We also took an unbiased approach to analyze the RNA-seq data, using the Ingenuity Pathway Analysis (IPA) and Gene Set Enrichment Analysis (GSEA) tools to identify pathways that are differentially activated in S100A4-knockdown cells. Analysis of significantly differentially expressed genes showed that glycolysis and gluconeogenesis (downregulated) and AMPK and Wnt/ß-catenin signaling (upregulated) are the most significantly altered canonical pathways between control and S100A4 knockdown cells (Supplementary Figure 3A, B and Supplementary Table 3). In addition, IPA analysis predicted that TP53, HIF1A, TGFB1, and TNF are the top four upstream regulators of genes that are differentially expressed in S100A4-knockdown cells (Supplementary Table 3, and 5). In addition, downregulated genes by S100A4-knockdown overlap with downstream targets of HIF1A, TGFB1, TNF, HGF, and MYC (Supplementary Table 3, and 4), suggesting that S100A4 may regulate cellular response to environmental stress in GBM. Interestingly, TGFB is a well-established inducer of EMT, and TNF has been recently reported to promote mesenchymal differentiation of GSCs in a NF-kB dependent way, through STAT3, CEBPB, and WWTR1/TAZ (4,40). Concordantly, we observed that SNAI2, CEBPB and WWTR1/TAZ levels are reduced by S100A4 knockdown (Figure 7C, D). GSEA showed consistent enrichment for gene sets associated with EMT, glycolysis, and hypoxia (Supplementary Figure 3C). Together, our analyses indicate that S100A4 is an upstream regulator of critical transcription factors that regulate mesenchymal transition on GBM (Figure 7G).
DISCUSSION
S100a4 is a novel marker and regulator of glioma stem cells
Due to both intra-tumoral heterogeneity and dynamic regulation of stem cell marker expression, prospective identification of GSCs using cell surface markers remains a challenge. In a previous study, we showed that GSCs are enriched in the side-population (SP) cells in the S100ß-verbB;p53 glioma mouse model (30). To discover novel molecular targets in GSCs, we identified genes differentially expressed between normal neural stem cells (NSCs) vs. GSCs and stem vs. bulk glioma cells by performing a transcriptome analysis (30). Among these 45 genes we identified was S100a4, a small EF-hand Ca2+ binding protein previously shown to be important for breast tumor metastasis (17–22). We now present evidence indicating that S100A4 is a novel marker and regulator of GSCs in murine and human malignant gliomas. Interestingly, different levels of S100A4 expression regulate different stem cell characteristics: at the highest level (over-expressed), S100A4 promotes quiescence and at a lower level, it promotes self-renewal through asymmetric stem:progenitor divisions (Figs. 3, 5, and 6). Furthermore, we provide proof of principle evidence that strategies that either ablate S100A4+ cells or inhibit S100A4 function may provide therapeutic benefit to GBM patients. Others have shown that S100A4 maintains tumor initiating cells in head and neck cancer cell lines (26), suggesting that inhibiting S100A4 function may target cancer stem cells in multiple cancer types. Interestingly, S100A4 appears to regulate GSC phenotypes through a pathway parallel to classical stem cell regulatory network involving NSC regulators such as Tlx/Nr2e2, Id1, Itga6, and Sox2, as expression of these genes are not significantly affected by S100A4 knockdown (not shown). While the exact molecular mechanism through which S100a4 promotes GSC self-renewal/survival still needs to be elucidated, it appears to involve processes that are upstream of EMT and MES transition regulator activation.
S100A4 is an upstream regulator of the mesenchymal program
The MES phenotype and EMT signature are associated with tumor progression and aggressiveness in many human cancers (4,5,40–43). For example, MES-subtype GBM patients are resistant to standard care and have a worse prognosis than other subtypes (42,44,45). We provide several lines of evidence that S100A4 is a critical upstream regulator of the MES transition in GBMs. For example, we showed that S100A4 is necessary for the expression of key EMT regulators SNAIL2 and ZEB1 in GSCs (Fig 7C,D). A recent study has shown that ZEB1 is expressed in GBM cells in the invasion front and it promotes invasion, chemoresistance, and stemness in GBM cells (46); therefore, a key function of S100A4 in GSC regulation may be through ZEB1 expression regulation. S100A4 has been used as a marker of EMT and mesenchymal cells. Our study shows that it is not merely a marker but an upstream regulator of mesenchymal transition. Our results suggest that re-analyses of earlier studies in other systems, for example S100A4+ cells in breast tumor stroma that were presumed to be cancer associated fibroblasts, may represent cancer cells that have undergone mesenchymal transition and acquired stemness.
We report for the first time that S100A4 is an upstream regulator of CEBP, FOSL2, RUNX1,bHLHE40, and WWTR1/TAZ – the “master transcriptional regulators” of the MES signature genes that can account for ~80% of the MES signature gene expression (39). Interestingly, Bhat et al. recently showed that TNFa treatment could induce mesenchymal differentiation of proneural GSCs in culture through the NFkB-STAT3/CEBPB/TAZ axis (4); however, TNFa treatment was not sufficient to induce expression of the EMT master regulators SNAIL, SLUG/SNAIL2, or TWIST (4), suggesting that TNFa treatment activates the MES transition through a parallel pathway or at a point downstream of the EMT regulator expression. Our data indicate that S100A4 is upstream of both EMT regulator expression and Nf-KB-STAT3/CEBP/TAZ-regulated MES differentiation, placing S100A4 upstream of both sets of “master regulators” of mesenchymal phenotype (Figure 7G). In summary, this study demonstrates that S100A4 is a novel marker and a regulator of GSCs as well as a critical upstream regulator of the mesenchymal transition in GBMs.
Supplementary Material
Acknowledgments
We thank Jesse Hammer and Zoe Reifsnyder for graphic design, Stephen Sampson for manuscript editing, and JAX Scientific Services for assistance with imaging, FACS and RNA-seq library preparation and sequencing. We also thank Ivette Emery and the Tissue Bank at Maine Medical Center for providing the paraffin-embedded GBM samples, and JAX-WEST PDX Resource for the GBM PDX models. We thank Nadia Rosenthal and Barbara Tennent for critical review of this manuscript.
Financial Support: This work was supported by the American Cancer Society Research Scholar Award (118571-RSG-10-042-01-DDC) and a grant from the Donaldson Charitable Trust to K. Yun. JAX Scientific Services was supported by the Cancer Center Core Grant, CA034196, to E. Liu.
Footnotes
Authors declare no potential conflicts of interest.
References
- 1.Stupp R, Taillibert S, Kanner AA, Kesari S, Steinberg DM, Toms SA, et al. Maintenance Therapy With Tumor-Treating Fields Plus Temozolomide vs Temozolomide Alone for Glioblastoma: A Randomized Clinical Trial. JAMA. 2015;314(23):2535–43. doi: 10.1001/jama.2015.16669. [DOI] [PubMed] [Google Scholar]
- 2.Verhaak RGW, Hoadley KA, Purdom E, Wang V, Qi Y, Wilkerson MD, et al. Integrated genomic analysis identifies clinically relevant subtypes of glioblastoma characterized by abnormalities in PDGFRA, IDH1, EGFR, and NF1. Cancer Cell. 2010;17(1):98–110. doi: 10.1016/j.ccr.2009.12.020. [DOI] [PMC free article] [PubMed] [Google Scholar]
- 3.Phillips HS, Kharbanda S, Chen R, Forrest WF, Soriano RH, Wu TD, et al. Molecular subclasses of high-grade glioma predict prognosis, delineate a pattern of disease progression, and resemble stages in neurogenesis. Cancer Cell. 2006;9(3):157–73. doi: 10.1016/j.ccr.2006.02.019. [DOI] [PubMed] [Google Scholar]
- 4.Bhat KP, Balasubramaniyan V, Vaillant B, Ezhilarasan R, Hummelink K, Hollingsworth F, et al. Mesenchymal differentiation mediated by NF-kappaB promotes radiation resistance in glioblastoma. Cancer Cell. 2013;24(3):331–46. doi: 10.1016/j.ccr.2013.08.001. [DOI] [PMC free article] [PubMed] [Google Scholar]
- 5.Mani SA, Guo W, Liao MJ, Eaton EN, Ayyanan A, Zhou AY, et al. The epithelial-mesenchymal transition generates cells with properties of stem cells. Cell. 2008;133(4):704–15. doi: 10.1016/j.cell.2008.03.027. [DOI] [PMC free article] [PubMed] [Google Scholar]
- 6.Ye X, Tam WL, Shibue T, Kaygusuz Y, Reinhardt F, Ng Eaton E, et al. Distinct EMT programs control normal mammary stem cells and tumour-initiating cells. Nature. 2015;525(7568):256–60. doi: 10.1038/nature14897. [DOI] [PMC free article] [PubMed] [Google Scholar]
- 7.Visvader JE, Lindeman GJ. Cancer stem cells: current status and evolving complexities. Cell stem Cell. 2012;10(6):717–28. doi: 10.1016/j.stem.2012.05.007. [DOI] [PubMed] [Google Scholar]
- 8.Venere M, Fine HA, Dirks PB, Rich JN. Cancer stem cells in gliomas: identifying and understanding the apex cell in cancer’s hierarchy. Glia. 2011;59(8):1148–54. doi: 10.1002/glia.21185. [DOI] [PMC free article] [PubMed] [Google Scholar]
- 9.Bao S, Wu Q, McLendon RE, Hao Y, Shi Q, Hjelmeland AB, et al. Glioma stem cells promote radioresistance by preferential activation of the DNA damage response. Nature. 2006;444(7120):756–60. doi: 10.1038/nature05236. [DOI] [PubMed] [Google Scholar]
- 10.Chen J, Li Y, Yu T-S, McKay RM, Burns DK, Kernie SG, et al. A restricted cell population propagates glioblastoma growth after chemotherapy. Nature. 2012;488(7412):522–26. doi: 10.1038/nature11287. [DOI] [PMC free article] [PubMed] [Google Scholar]
- 11.Lathia JD, Heddleston JM, Venere M, Rich JN. Deadly teamwork: neural cancer stem cells and the tumor microenvironment. Cell stem Cell. 2011;8(5):482–5. doi: 10.1016/j.stem.2011.04.013. [DOI] [PMC free article] [PubMed] [Google Scholar]
- 12.Hjelmeland AB, Wu Q, Heddleston JM, Choudhary GS, MacSwords J, Lathia JD, et al. Acidic stress promotes a glioma stem cell phenotype. Cell Death Differ. 2011;18(5):829–40. doi: 10.1038/cdd.2010.150. [DOI] [PMC free article] [PubMed] [Google Scholar]
- 13.Li Z, Bao S, Wu Q, Wang H, Eyler C, Sathornsumetee S, et al. Hypoxia-inducible factors regulate tumorigenic capacity of glioma stem cells. Cancer Cell. 2009;15(6):501–13. doi: 10.1016/j.ccr.2009.03.018. [DOI] [PMC free article] [PubMed] [Google Scholar]
- 14.Grigorian M, Andresen S, Tulchinsky E, Kriajevska M, Carlberg C, Kruse C, et al. Tumor suppressor p53 protein is a new target for the metastasis-associated Mts1/S100A4 protein: functional consequences of their interaction. J Biol Chem. 2001;276(25):22699–708. doi: 10.1074/jbc.M010231200. [DOI] [PubMed] [Google Scholar]
- 15.Li ZH, Bresnick AR. The S100A4 metastasis factor regulates cellular motility via a direct interaction with myosin-IIA. Cancer Res. 2006;66(10):5173–80. doi: 10.1158/0008-5472.CAN-05-3087. [DOI] [PubMed] [Google Scholar]
- 16.Semov A, Moreno MJ, Onichtchenko A, Abulrob A, Ball M, Ekiel I, et al. Metastasis-associated protein S100A4 induces angiogenesis through interaction with Annexin II and accelerated plasmin formation. J Biol Chem. 2005;280(21):20833–41. doi: 10.1074/jbc.M412653200. [DOI] [PubMed] [Google Scholar]
- 17.Ambartsumian NS, Grigorian MS, Larsen IF, Karlstrom O, Sidenius N, Rygaard J, et al. Metastasis of mammary carcinomas in GRS/A hybrid mice transgenic for the mts1 gene. Oncogene. 1996;13(8):1621–30. [PubMed] [Google Scholar]
- 18.Davies MP, Rudland PS, Robertson L, Parry EW, Jolicoeur P, Barraclough R. Expression of the calcium-binding protein S100A4 (p9Ka) in MMTV-neu transgenic mice induces metastasis of mammary tumours. Oncogene. 1996;13(8):1631–7. [PubMed] [Google Scholar]
- 19.Grum-Schwensen B, Klingelhöfer J, Grigorian M, Almholt K, Nielsen BS, Lukanidin E, et al. Lung metastasis fails in MMTV-PyMT oncomice lacking S100A4 due to a T-cell deficiency in primary tumors. Cancer Research. 2010;70(3):936–47. doi: 10.1158/0008-5472.CAN-09-3220. [DOI] [PubMed] [Google Scholar]
- 20.Lloyd BH, Platt-Higgins A, Rudland PS, Barraclough R. Human S100A4 (p9Ka) induces the metastatic phenotype upon benign tumour cells. Oncogene. 1998;17(4):465–73. doi: 10.1038/sj.onc.1201948. [DOI] [PubMed] [Google Scholar]
- 21.O’Connell JT, Sugimoto H, Cooke VG, MacDonald BA, Mehta AI, LeBleu VS, et al. VEGF-A and Tenascin-C produced by S100A4+ stromal cells are important for metastatic colonization. Proc Natl Acad Sci USA. 2011;108(38):16002–07. doi: 10.1073/pnas.1109493108. [DOI] [PMC free article] [PubMed] [Google Scholar]
- 22.Xue C, Plieth D, Venkov C, Xu C, Neilson EG. The gatekeeper effect of epithelial-mesenchymal transition regulates the frequency of breast cancer metastasis. Cancer Res. 2003;63(12):3386–94. [PubMed] [Google Scholar]
- 23.Bresnick AR, Weber DJ, Zimmer DB. S100 proteins in cancer. Nature Reviews Cancer. 2015;15(2):96–109. doi: 10.1038/nrc3893. [DOI] [PMC free article] [PubMed] [Google Scholar]
- 24.He Z, Yu L, Luo S, Li M, Li J, Li Q, et al. miR-296 inhibits the metastasis and epithelial-mesenchymal transition of colorectal cancer by targeting S100A4. BMC cancer. 2017;17(1):140. doi: 10.1186/s12885-017-3121-z. [DOI] [PMC free article] [PubMed] [Google Scholar]
- 25.Okada H, Danoff TM, Kalluri R, Neilson EG. Early role of Fsp1 in epithelial-mesenchymal transformation. The American journal of physiology. 1997;273(4 Pt 2):F563–74. doi: 10.1152/ajprenal.1997.273.4.F563. [DOI] [PubMed] [Google Scholar]
- 26.Lo J-F, Yu C-C, Chiou S-H, Huang C-Y, Jan C-I, Lin S-C, et al. The epithelial-mesenchymal transition mediator S100A4 maintains cancer-initiating cells in head and neck cancers. Cancer Research. 2011;71(5):1912–23. doi: 10.1158/0008-5472.CAN-10-2350. [DOI] [PubMed] [Google Scholar]
- 27.Ito M, Kizawa K. Expression of calcium-binding S100 proteins A4 and A6 in regions of the epithelial sac associated with the onset of hair follicle regeneration. J Invest Dermatol. 2001;116(6):956–63. doi: 10.1046/j.0022-202x.2001.01369.x. [DOI] [PubMed] [Google Scholar]
- 28.Morris RJ, Liu Y, Marles L, Yang Z, Trempus C, Li S, et al. Capturing and profiling adult hair follicle stem cells. Nat Biotechnol. 2004;22(4):411–7. doi: 10.1038/nbt950. [DOI] [PubMed] [Google Scholar]
- 29.Tumbar T, Guasch G, Greco V, Blanpain C, Lowry WE, Rendl M, et al. Defining the epithelial stem cell niche in skin. Science. 2004;303(5656):359–63. doi: 10.1126/science.1092436. [DOI] [PMC free article] [PubMed] [Google Scholar]
- 30.Harris MA, Yang H, Low BE, Mukherje J, Guha A, Bronson RT, et al. Cancer stem cells are enriched in the side population cells in a mouse model of glioma. Cancer Res. 2008;68(24):10051–9. doi: 10.1158/0008-5472.CAN-08-0786. [DOI] [PMC free article] [PubMed] [Google Scholar]
- 31.Aberg F, Kozlova EN. Metastasis-associated mts1 (S100A4) protein in the developing and adult central nervous system. The Journal of comparative neurology. 2000;424(2):269–82. [PubMed] [Google Scholar]
- 32.Dmytriyeva O, Pankratova S, Owczarek S, Sonn K, Soroka V, Ridley CM, et al. The metastasis-promoting S100A4 protein confers neuroprotection in brain injury. Nat Commun. 2012;3:1197. doi: 10.1038/ncomms2202. [DOI] [PubMed] [Google Scholar]
- 33.Kozlova EN, Lukanidin E. Mts1 protein expression in the central nervous system after injury. Glia. 2002;37(4):337–48. [PubMed] [Google Scholar]
- 34.Iwano M, Fischer A, Okada H, Plieth D, Xue C, Danoff TM, et al. Conditional abatement of tissue fibrosis using nucleoside analogs to selectively corrupt DNA replication in transgenic fibroblasts. Mol Ther. 2001;3(2):149–59. doi: 10.1006/mthe.2000.0251. [DOI] [PubMed] [Google Scholar]
- 35.Weiss WA, Burns MJ, Hackett C, Aldape K, Hill JR, Kuriyama H, et al. Genetic determinants of malignancy in a mouse model for oligodendroglioma. Cancer Res. 2003;63(7):1589–95. [PubMed] [Google Scholar]
- 36.Calabrese C, Poppleton H, Kocak M, Hogg TL, Fuller C, Hamner B, et al. A perivascular niche for brain tumor stem cells. Cancer Cell. 2007;11(1):69–82. doi: 10.1016/j.ccr.2006.11.020. [DOI] [PubMed] [Google Scholar]
- 37.Moore N, Lyle S. Quiescent, slow-cycling stem cell populations in cancer: a review of the evidence and discussion of significance. Journal of Oncology. 2011;2011 doi: 10.1155/2011/396076. [DOI] [PMC free article] [PubMed] [Google Scholar]
- 38.Zhu Z, Khan MA, Weiler M, Blaes J, Jestaedt L, Geibert M, et al. Targeting self-renewal in high-grade brain tumors leads to loss of brain tumor stem cells and prolonged survival. Cell Stem Cell. 2014;15(2):185–98. doi: 10.1016/j.stem.2014.04.007. [DOI] [PubMed] [Google Scholar]
- 39.Carro MS, Lim WK, Alvarez MJ, Bollo RJ, Zhao X, Snyder EY, et al. The transcriptional network for mesenchymal transformation of brain tumours. Nature. 2010;463(7279):318–25. doi: 10.1038/nature08712. [DOI] [PMC free article] [PubMed] [Google Scholar]
- 40.Bhat KP, Salazar KL, Balasubramaniyan V, Wani K, Heathcock L, Hollingsworth F, et al. The transcriptional coactivator TAZ regulates mesenchymal differentiation in malignant glioma. Genes Dev. 2011;25(24):2594–609. doi: 10.1101/gad.176800.111. [DOI] [PMC free article] [PubMed] [Google Scholar]
- 41.Elias MC, Tozer KR, Silber JR, Mikheeva S, Deng M, Morrison RS, et al. TWIST is expressed in human gliomas and promotes invasion. Neoplasia (New York, NY) 2005;7(9):824–37. doi: 10.1593/neo.04352. [DOI] [PMC free article] [PubMed] [Google Scholar]
- 42.Mitra A, Mishra L, Li S. EMT, CTCs and CSCs in tumor relapse and drug-resistance. Oncotarget. 2015;6(13):10697–711. doi: 10.18632/oncotarget.4037. [DOI] [PMC free article] [PubMed] [Google Scholar]
- 43.Ye X, Weinberg RA. Epithelial-Mesenchymal Plasticity: A Central Regulator of Cancer Progression. Trends Cell Biol. 2015;25(11):675–86. doi: 10.1016/j.tcb.2015.07.012. [DOI] [PMC free article] [PubMed] [Google Scholar]
- 44.Colman H, Zhang L, Sulman EP, McDonald JM, Shooshtari NL, Rivera A, et al. A multigene predictor of outcome in glioblastoma. Neuro-Oncology. 2010;12(1):49–57. doi: 10.1093/neuonc/nop007. [DOI] [PMC free article] [PubMed] [Google Scholar]
- 45.Varna M, Gapihan G, Feugeas J-P, Ratajczak P, Tan S, Ferreira I, et al. Stem cells increase in numbers in perinecrotic areas in human renal cancer. Clin Cancer Res. 2015;21(4):916–24. doi: 10.1158/1078-0432.CCR-14-0666. [DOI] [PubMed] [Google Scholar]
- 46.Siebzehnrubl FA, Silver DJ, Tugertimur B, Deleyrolle LP, Siebzehnrubl D, Sarkisian MR, et al. The ZEB1 pathway links glioblastoma initiation, invasion and chemoresistance. EMBO molecular medicine. 2013;5(8):1196–212. doi: 10.1002/emmm.201302827. [DOI] [PMC free article] [PubMed] [Google Scholar]
Associated Data
This section collects any data citations, data availability statements, or supplementary materials included in this article.
Supplementary Materials
Data Availability Statement
The raw RNA-seq data are available at Sequence Read Archive (SRP105051) and will be released upon acceptance of this manuscript.