Abstract
Although, there is growing awareness in the progressive neurodegeneration of chronic traumatic encephalopathy, changes of immune reactions remain equivocal at best. Thus, in a clinically relevant rat repetitive mild traumatic brain injury (rmTBI) model, some immunologic cells (T cell subsets, microglia) in the injured brain and peripheral blood were analyzed by flow cytometry and immunofluorescence. In the injured brain, CD3+ T cells showed a bimodal increase during 42 days post-injury (dpi). CD3+CD4+ T cells firstly increased and then decreased, while CD3+CD8+ T cells had reversed tendency. CD86+/CD11b+ M1-like microglia increased at 42 dpi and CD206+/CD11b+ M2-like microglia peaked at 7 dpi. In addition, peripheral immune suppression was implicated in the chronic phase after rmTBI. Taken together, the study provided useful information on long-term dynamic changes of some immune cells after rmTBI in rats.
Keywords: Repetitive mild traumatic brain injury, T cell subsets, Microglia
Introduction
Traumatic brain injury (TBI) is a major public health issue, which caused by road traffic collisions, assaults, and falls, etc. Before retired athletes and veterans of wars, chronic traumatic encephalopathy (CTE), a progressive neurodegeneration of the brain tissue or a result of repetitive mild traumatic brain injury (rmTBI) [1], was not considered to be a common phenomenon.
TBI elicits robust immune events that leads to axonal damage and secondary injury. However, changes of T cell subsets and microglia post-rmTBI remain incomplete. Thus, our study would preliminary descriptive analysis.
Method and Material
All research were approved by institutional (Animal Care and Use Committee of Tianjin Medical University). All animals were maintained according to the EC Directive 86/609/EEC for animal experiments. And all investigators were blinded to the treatment groups during animal surgery, data collection and analysis.
Animals
12 weeks old male Sprague–Dawley rats (n = 162, each weighing about 200 g), which were purchased from the Chinese Academy of Military Science (Beijing, China) and bred at Experimental Animal Laboratories of Tianjin Neurological Institute, with a 12 h light–dark cycle (lights on at 7:00 a.m. and off at 7:00 p.m.), a constant temperature (22 ± 2 °C) and relative humidity (55–60%). Rats were randomly divided into 7 groups: the sham group and 1/3/7/14/28/42 dpi groups, with 6 rats in each group.
Controlled Cortical Impact (CCI) Induced Repetitive Mild Traumatic Brain Injury (rmTBI) Model
Rats were anesthetized with 10% chloride hydrate (3.5 ml/kg intraperitoneal injection) and were put under a stereotaxic frame. The circular craniotomy (diameter, 4 mm) was performed on the right parietal skull, with center of the drill located at 4.0 mm posterior from bregma and 3.0 mm lateral to the sagittal suture. The impact was induced using a pneumatic impact device (American Instruments, Richmond, VA USA) with the standard parameters for CCI rmTBI, including velocity at 3.6 m/s, tracel range 1.2 mm, dwell settings 2 s, and 24 h apart. And the removed skull was returned to its original position and the incision was suture-closed. Sham operations underwent the same anesthesia and were not exposed to injury.
Flow Cytometry
Rats were deeply anesthetized with 10% chloral hydrate at corresponding 1/3/7/14/28/42 dpi groups.
After collecting peripheral blood samples in K2-EDTA vials (BD Biosciences, USA), it was diluted with phosphate buffered saline (PBS; Sigma–Aldrich, USA) and stratified with lympholyte-mammal (Sigma–Aldrich, USA). After density gradient centrifugation at 300g for 20 min at room temperature, peripheral blood mononuclear cells (PBMCs) were isolated from collected peripheral blood. Cells were purified by washing with PBS twice times.
Rats were transcardially perfused with ice-cold PBS. Then brains were removed as soon as possible and homogenized with syringe through a 70 µM cell strainer (BD Biosciences, USA) to acquire a single cell suspension. After centrifugation at 1500 rpm for 10 min at room temperature, cells were re-suspended in 30% percoll and 70% percoll (GE Healthcare, Little Chalfont, UK, diluted in HBSS: Hanks’ balanced salt solution; Life Technologies, Carlsbad, CA). After centrifugation at 400g for 20 min at room temperature, CNS mononuclear cells were at the mid-layer, which was between the 30 and 70% percoll interface. Cells were purified by washing with PBS twice times.
Mononuclear cells were stained with Rat T lymphocyte Cocktail, anti-rat CD3-APC, anti-rat CD4-PE, anti-rat CD8-FITC, and anti-rat CD11b-FITC, anti-rat CD45-PerCP, anti-rat CD86-PE, anti-rat CD206-APC (BD Biosciences, USA) following standard protocols and manufacturer’s instructions. Data were obtained using a FACSCalibur (BD Biosciences, USA) and analyzed with Flow Jo VX software.
Immunofluorescence Procedures
For the immunofluorescence staining, rats were sacrificed by transcardiac perfusion with cold PBS followed by 4% paraformaldehyde at corresponding 1/7/14/28/42 dpi groups. The dissected injured brain were fixed in 4% paraformaldehyde for 24 h at 4 °C, and incubated in 30% sucrose for 48 h. After fixation, they were embedded in the optimum cutting temperature (OCT) medium (Sakura, Torrance, CA, USA) on dry ice, and stored at −80 °C immediately. A series of 40 µm coronal sections using a Microm HM550 cryostat were made on a cryostat at −20 °C and processed for immunofluorescence.
After air drying, all sections were treated with 3% bovine serum albumin for 30 min at 37 °C to block nonspecific staining, and incubated over night at 4 °C with the primary antibody: anti-Iba-1 (ab107159, 1:200; Abcam). After being rinsed by PBS (3 × 10 min), the slides were incubated for 2 h at room temperature with a 1:2000 dilution of anti-goat IgG secondary antibody (Invitrogen, Carlsbad, CA, USA). The nuclei were counterstained with DAPI (Sigma–Aldrich, USA) at room temperature. Sections were digitized under a 20× objective using a 3-CCD color video camera (Sony DXC-970MD, Japan) with an immunofluorescence microscope (Olympus IX81, Japan).Four separate slides (40 μm apart from each other) from each brain with each slide containing three randomly selected 200× fields from the lesion site were digitized. Image processing analysis and measurements were performed using Image J software (National Institute of Health, USA).
Statistics Analysis
The data were expressed as mean ± SD. All statistical analyses were conducted using SPSS 22.0 and Graphpad Prism 5 software. p vales were calculated with the single-factorial analysis of variance (ANOVA) and Student’s t-test. A p-value of less than 0.05 was significant.
Results
Dynamic Changes of T Lymphocyte Subsets in the Brain After rmTBI in Rats
T lymphocyte subsets were characterized by the expression of cell surface markers: all T cells (CD3+), CD4+ or CD8+ T cells (CD3+CD4+ or CD3+CD8+) [2].
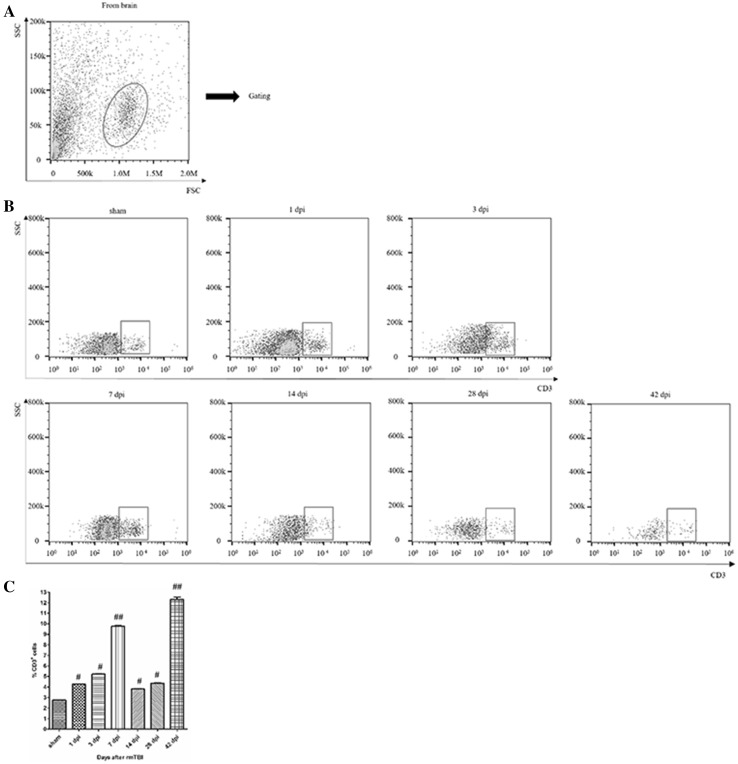
The gating strategy of live cell analysis was shown (Fig. 1a).The proportion of T cells significantly increased at 7 and 42 days post-injury (dpi) (Fig. 1b). Quantitative data for the percentage of T cells in CNS are shown in Fig. 1c.
Fig. 1.
Analysis of T lymphocyte in the injured brain after rmTBI. a Dot plots of isolated immune cells in the brain, gated for live cell analysis. b Representative flow cytometry data for T cells (CD3+ cells) in the brain at the indicated days after rmTBI. c Graph illustrating quantitative data for accumulated T cells in the brain after rmTBI. n = 6 for each experiment. T cells: ##p < 0.01 at 7 and 42 dpi compared with sham; #p < 0.05 at the others compared with sham
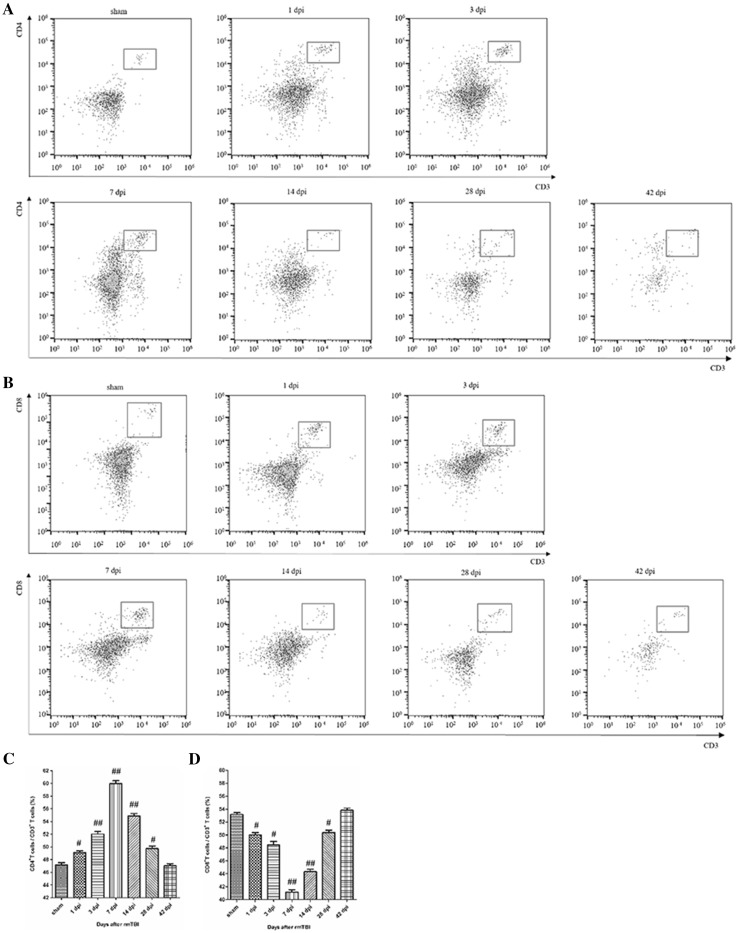
The percentage of CD4+ T cells rose first during 7 dpi and gradually returned to the baseline (Fig. 2a). The percentage of CD8+ T cells decreased during 7 dpi, and returned to the baseline level at 42 dpi (Fig. 2b). Quantitative data for the percentage of CD4 + and CD8 + T cells in CNS are shown in Fig. 2c, d.
Fig. 2.
Analysis of T cell subsets in the injured brain after rmTBI. a Representative flow cytometry data for CD4+ T cells (CD3+ CD4+ cells) in the injured brain at the indicated days after rmTBI. b Representative flow cytometry data for CD8+ T cells (CD3+ CD8+ cells) in the injured brain at the indicated days after rmTBI. c Graph illustrating quantitative data for the percentages of CD4+ T cells in the brain at the indicated days after rmTBI. d Graph illustrating quantitative data for the percentages of CD8+ T cells in the brain at the indicated days after rmTBI. n = 6 for each experiment. CD4+ T cells: ##p < 0.01 at 3, 7, and 14 dpi compared with sham; #p < 0.05 at 1 and 28 dpi compared with sham. CD8+ T cells: ##p < 0.01 at 7 and 14 dpi compared with sham; #p < 0.05 at 1, 3, and 28 dpi compared with sham
Dynamic Changes of Microglia in the Brain After rmTBI in Rats
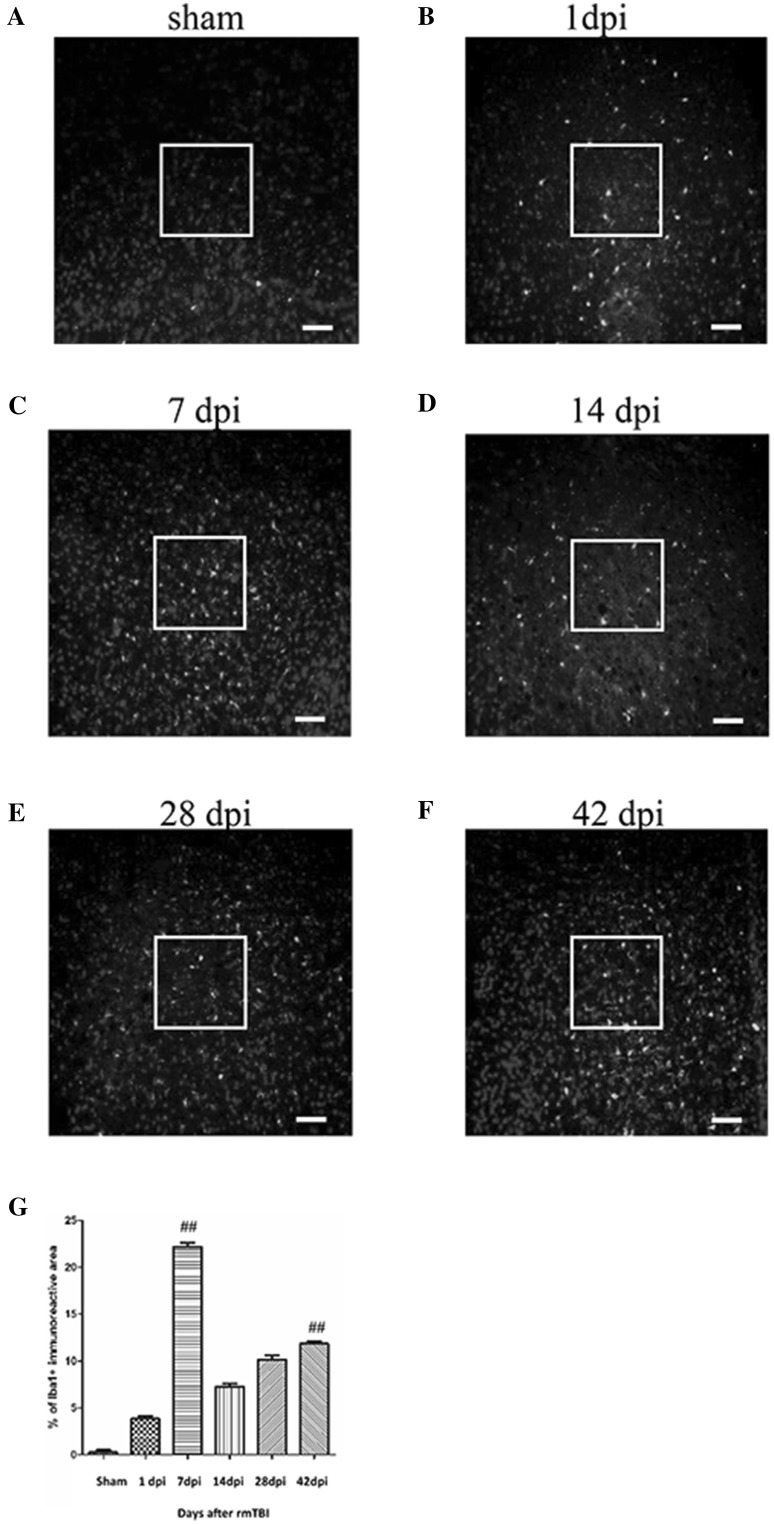
Intense signals for Iba-1+ were observed around the site of injury at 7 dpi (Fig. 3c). At 7 dpi, the percentage of Iba-1+ microglia was approximately 4 times more than that of 1 dpi (Fig. 3b). Then it declined at 14 dpi (Fig. 3d) and finally increased at 28 dpi (Fig. 3e) and 42 dpi (Fig. 3f). Quantitative data for the percentage of Iba-1+ microglia are shown in Fig. 3g.
Fig. 3.
Immunofluorescence analysis of the Iba-1+ cells in the injured brain after rmTBI. Sections are stained of Iba-1 in sham (a) and at 1 dpi (b), 7 dpi (c), 14 dpi (d), 28 dpi (e) and 42 dpi (f). g The graph shows the percentages of Iba-1+ microglia around the injured site at the indicated days after rmTBI. n = 6 for each experiment. ##p < 0.01 at 7 and 42 dpi compared with sham. Scale bar 50 µm (magnification ×200)
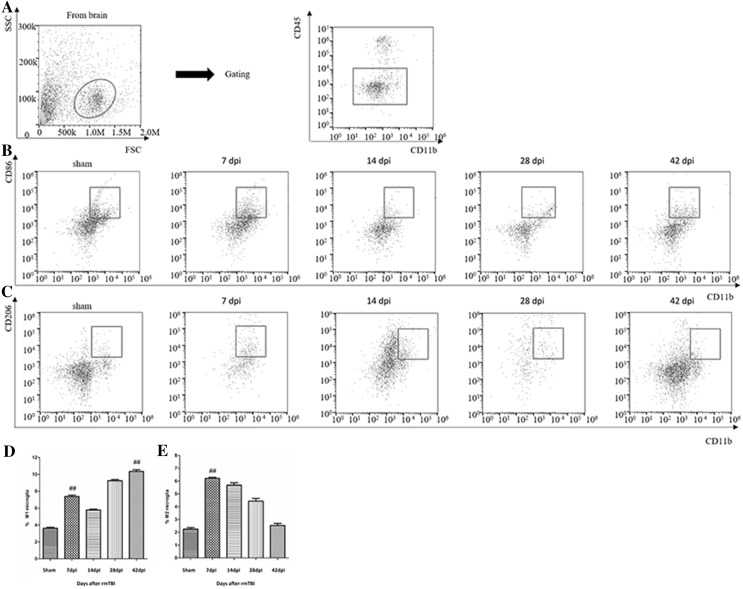
Two distinct populations of macrophages and microglia were observed: CD45high/CD11b+ cells and CD45low/CD11b+ cells. CD45high/CD11b+ cells were considered macrophages and CD45low/CD11b+ cells were considered microglia [3, 4]. Microglia have been classified into two subsets: pro-inflammatory M1 and anti-inflammatory M2 [5, 6]. CD86 is considered an M1 marker, and CD206 is considered an M2 marker [7]. Flow cytometry was performed to further examine the dynamic changes of distinct subsets of microglia in the brain. Of the isolated cells, microglia account for 90% (Fig. 4a). CD86+/CD11b+ M1-like microglia significantly increased at 42 dpi (Fig. 4b). CD206+/CD11b+ M2-like microglia peaked at 7 dpi and roughly returned to the baseline level at 42 dpi (Fig. 4c). Quantitative data for the percentage of M1 and M2-like microglia are shown in Fig. 4d, e.
Fig. 4.
Analysis of subsets of microglia in the injured brain after rmTBI. a Representative flow cytometry data for the purity of microglia isolated. Of the isolated cells, 90% were microglia .b Representative flow cytometry data for CD86+/CD11b+ M1-like microglia in the injured brain at the indicated days after rmTBI. c Representative flow cytometry data for CD206+/CD11b+ M2-like microglia in the injured brain at the indicated days after rmTBI. d Graph illustrating quantitative data showing the percentages of CD86+/CD11b+ M1-like microglia. e Graph illustrating quantitative data showing the percentages of CD206+/CD11b+ M2-like microglia. n = 6 for each experiment. CD86+/CD11b+ M1-like microglia: ##p < 0.01 at 1 and 42 dpi compared with sham. CD86+/CD11b+ M2-like microglia: ##p < 0.01 at 7 dpi compared with sham
Dynamic Changes of T Lymphocyte Subsets in the Peripheral Blood After rmTBI in Rats
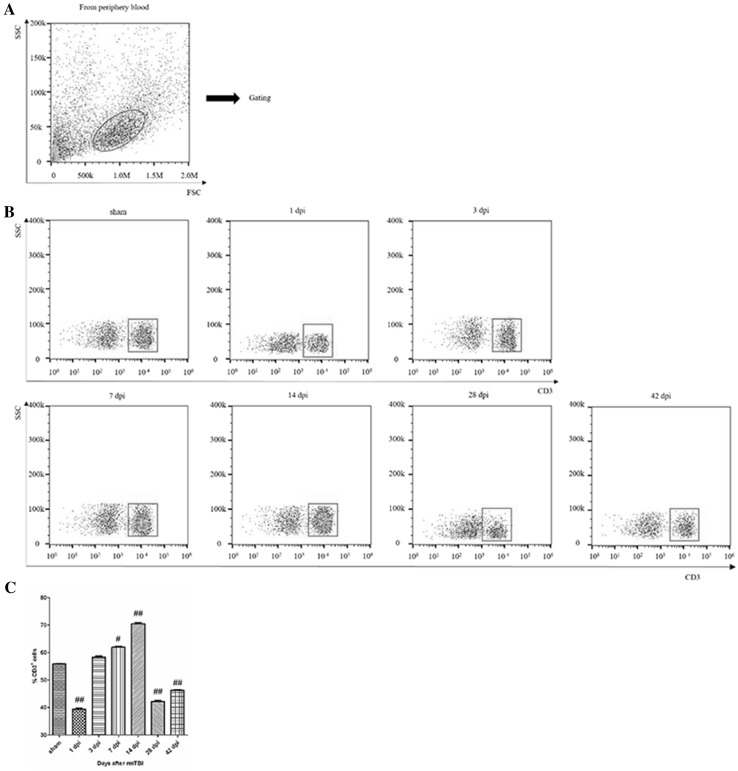
The gating strategy of live cell analysis was shown (Fig. 5a). The number of T cells decreased at 1 dpi, and rose slightly by 14 dpi, which again decreased at 28 and 42 dpi (Fig. 5b). Quantitative data for the percentage of T cells are shown in Fig. 5c.
Fig. 5.
Analysis of T lymphocyte in the peripheral blood after rmTBI. a Dot plots of isolated immune cells in the peripheral blood, gated for live cell analysis. b Representative flow cytometry data for T cells (CD3+ cells) in the peripheral blood at the indicated days after rmTBI. c Graph illustrating quantitative data for accumulated T cells in the peripheral blood after rmTBI. n = 6 for each experiment. T cells: ##p < 0.01 at 1, 14, 28, and 42 dpi compared with sham, #p < 0.05 at 7 dpi compared with sham
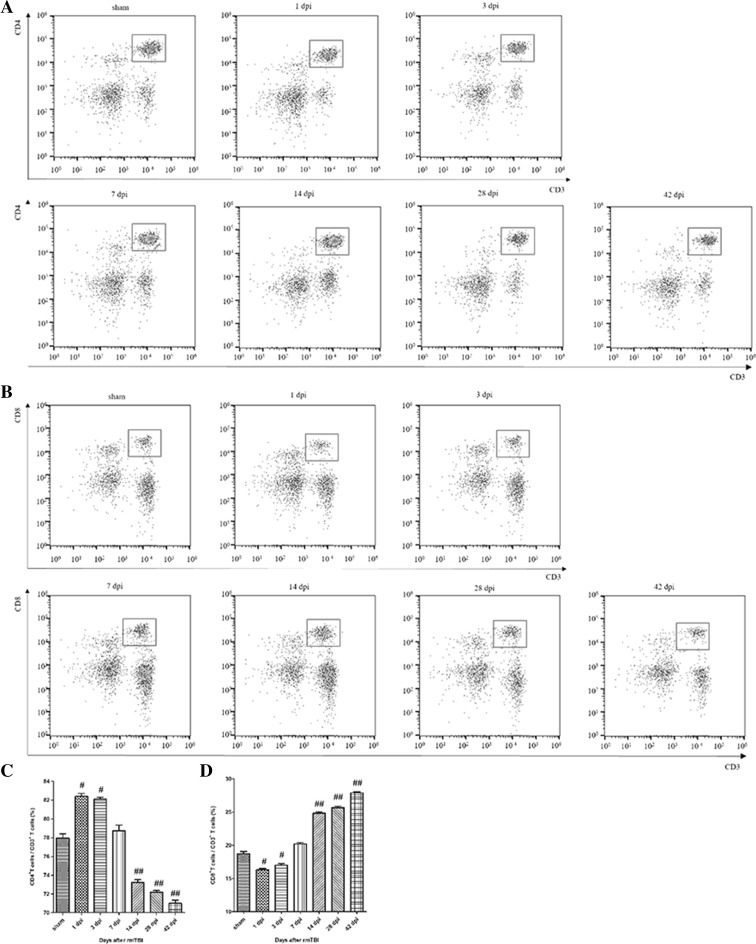
The percentage of CD4+ T cells continuously declined from 7 to 42 dpi (Fig. 6a), while the percentage of CD8+ T cells increased from 7 to 42 dpi (Fig. 6b). Quantitative data for the percentage of CD4+ and CD8+ T cells are shown in Fig. 6c, d.
Fig. 6.
Analysis of T cell subsets in the peripheral blood after rmTBI. a Representative flow cytometry data for CD4+ T cells (CD3+ CD4+ cells) in the peripheral blood at the indicated days after rmTBI. b Representative flow cytometry data for CD8+ T cells (CD3+ CD8+ cells) in the peripheral blood at the indicated days after rmTBI. c Graph illustrating quantitative data for the percentages of CD4+T cells in the peripheral blood at the indicated days after rmTBI. d Graph illustrating quantitative data for the percentages of CD8+ T cells in the peripheral blood at the indicated days after rmTBI. n = 6 for each experiment. CD4+ T cells: ##p < 0.01 at 14, 28, and 42 dpi compared with sham; #p < 0.05 at 1 and 3 dpi compared with sham. CD8+ T cells: ##p < 0.01 at 14, 28, and 42 dpi compared with sham; #p < 0.05 at 1 and 3 dpi compared with sham
Discussion
T lymphocytes, a group of complicated multifunctional cell colonies, include many subsets of CD3+, CD4+, CD8+ and others. Representing T lymphocytes, CD3+ can reflect the condition of cellular immunity and immune response to different exogenous antigens. Regarded as T helper cells or T inducible cells, CD4+ can help B cells to promote the function of various antibodies. Defined as T suppression cells or T cytotoxic cells, CD8+ can help B cells to restrain various antibodies and exert cytotoxic effect on MHC-I antigen at the membrane of target cells. Treated as a crucial marker in immune regulation, the percentages of CD4+ T cells and CD8+ T cells are often recognized as a manifestation of immune balance [8]. In the injured brain, CD3+ T cells showed a bimodal increase during 42 dpi (Fig. 1). CD3+CD4+ T cells firstly increased and then decreased, while CD3+CD8+ T cells had reversed tendency (Fig. 2). Thus, there was alterations in T cell homeostasis in CNS after rmTBI in rats.
Microglia are resident immune cells in the brain, which regulate inflammatory response after a CNS injury. Changes in the ratio of pro-inflammatory M1 cells versus anti-inflammatory M2 cells reveal the direction of immune response [9, 10]. We observed that a bimodal increase at 7 and 42 dpi (Fig. 3), coinciding with the flow cytometry that CD206+/CD11b+ M2-like microglia peaked at 7 dpi, whereas CD86+/CD11b+ M1-like microglia increased at 42 dpi (Fig. 4). Given that M1-like microglia displays a primed role in the ageing CNS [11], we make reference, where appropriate, to modification of the M1/M2 balance in the immune system to provide plausible treatments following rmTBI.
Especially, we observed that the peak of T cells in the peripheral blood were at 14 dpi (Fig. 5), which showed a 7 dpi delay compared to that of microglia in CNS, consisting with Xuemei Jin’s view that T cells in the cervical lymph nodes respond to activated microglia in the injured brain transiently [12]. Hence, we observed that peripheral immunosuppression in the chronic phase after rmTBI (Fig. 6). Also, impaired CD4+/CD8+ T cell function was found in several studies on chronic injuries [13], and the immunosuppression could be lasted about 3 months [2, 14].
Generally, TBI immediately activates the SNS, leading to splenic contraction, spleen shrinkage [15], and dysfunction of immunity [16], all of which eventually make profound immune suppression. In later stages, because of exhausted spleen-derived immune cells and dramatically reduced spleen size, post-injury peripheral immunosuppression will develop [17]. Specifically, proposed mechanisms underlying peripheral immunosuppression impact on susceptibility of infections, which includes a set of molecular determinants [18] (high-mobility group box 1 [HMGB1] [19–21], ATP [22–24], S100 [25, 26]), activation of the HPA axis and SNS [27, 28], and disruption of the blood–brain barrier (BBB) [29].
In summary, what is characteristic of our finding is that dynamic changes of T cell subsets and microglia was implicated in the acute and chronic phase post-rmTBI. Further studies need to be explored, including the mechanisms underlying changes of the M1/M2 balance, the specific roles of CD3+/CD4+/CD8+ T cells in CNS or the peripheral blood, and the possible relationship between immunity and the post-injury prognosis.
Acknowledgements
The research was supported by grants from Tianjin Municipal Science and Technology Commission Natural Fund Project (13JCYBJC23700) and National Clinical Key Subject Construction Project of NHFPC Fund (81471252) and Natural Science Foundation for the Youth (81501055).
Compliance with Ethical Standards
Conflict of interest
All authors announce no competing interests.
References
- 1.Hay J, Johnson VE, Smith DH, Stewart W. Chronic traumatic encephalopathy: the neuropathological legacy of traumatic brain injury. Annu Rev Pathol. 2016;11:21–45. doi: 10.1146/annurev-pathol-012615-044116. [DOI] [PMC free article] [PubMed] [Google Scholar]
- 2.Monahan R, Stein A, Gibbs K, Bank M, Bloom O. Circulating T cell subsets are altered in individuals with chronic spinal cord injury. Immunol Res. 2015;63(1–3):3–10. doi: 10.1007/s12026-015-8698-1. [DOI] [PMC free article] [PubMed] [Google Scholar]
- 3.Ford AL, Goodsall AL, Hickey WF, Sedgwick JD. Normal adult ramified microglia separated from other central nervous system macrophages by flow cytometric sorting. Phenotypic differences defined and direct ex vivo antigen presentation to myelin basic protein-reactive CD4 + T cells. J Immunol. 1995;154(9):4309–4321. [PubMed] [Google Scholar]
- 4.Shichita T, Sugiyama Y, Ooboshi H, et al. Pivotal role of cerebral interleukin-17-producing gammadeltaT cells in the delayed phase of ischemic brain injury. Nat Med. 2009;15(8):946–950. doi: 10.1038/nm.1999. [DOI] [PubMed] [Google Scholar]
- 5.Mantovani A, Sica A, Sozzani S, Allavena P, Vecchi A, Locati M. The chemokine system in diverse forms of macrophage activation and polarization. Trends Immunol. 2004;25(12):677–686. doi: 10.1016/j.it.2004.09.015. [DOI] [PubMed] [Google Scholar]
- 6.Kettenmann H, Hanisch UK, Noda M, Verkhratsky A. Physiology of microglia. Physiol Rev. 2011;91(2):461–553. doi: 10.1152/physrev.00011.2010. [DOI] [PubMed] [Google Scholar]
- 7.Kigerl KA, Gensel JC, Ankeny DP, Alexander JK, Donnelly DJ, Popovich PG. Identification of two distinct macrophage subsets with divergent effects causing either neurotoxicity or regeneration in the injured mouse spinal cord. J Neurosci. 2009;29(43):13435–13444. doi: 10.1523/JNEUROSCI.3257-09.2009. [DOI] [PMC free article] [PubMed] [Google Scholar]
- 8.Wang J, Lu Q. Expression of T subsets and mIL-2R in peripheral blood of newborns with hypoxic ischemic encephalopathy. World J Pediatr. 2008;4(2):140–144. doi: 10.1007/s12519-008-0028-4. [DOI] [PubMed] [Google Scholar]
- 9.Bedi SS, Smith P, Hetz RA, Xue H, Cox CS. Immunomagnetic enrichment and flow cytometric characterization of mouse microglia. J Neurosci Methods. 2013;219(1):176–182. doi: 10.1016/j.jneumeth.2013.07.017. [DOI] [PMC free article] [PubMed] [Google Scholar]
- 10.Rawji KS, Mishra MK, Michaels NJ, Rivest S, Stys PK, Yong VW. Immunosenescence of microglia and macrophages: impact on the ageing central nervous system. Brain. 2016;139(3):653–661. doi: 10.1093/brain/awv395. [DOI] [PMC free article] [PubMed] [Google Scholar]
- 11.Matt SM, Johnson RW. Neuro-immune dysfunction during brain aging: new insights in microglial cell regulation. Curr Opin Pharmacol. 2016;26:96–101. doi: 10.1016/j.coph.2015.10.009. [DOI] [PMC free article] [PubMed] [Google Scholar]
- 12.Jin X, Ishii H, Bai Z, Itokazu T, Yamashita T. Temporal changes in cell marker expression and cellular infiltration in a controlled cortical impact model in adult male C57BL/6 mice. PLoS ONE. 2012;7(7):e41892. doi: 10.1371/journal.pone.0041892. [DOI] [PMC free article] [PubMed] [Google Scholar]
- 13.Zha J, Smith A, Andreansky S, Bracchi-Ricard V, Bethea JR. Chronic thoracic spinal cord injury impairs CD8+ T-cell function by up-regulating programmed cell death-1 expression. J Neuroinflammation. 2014;11:65. doi: 10.1186/1742-2094-11-65. [DOI] [PMC free article] [PubMed] [Google Scholar]
- 14.Cruse JM, Lewis RE, Roe DL, et al. Facilitation of immune function, healing of pressure ulcers, and nutritional status in spinal cord injury patients. Exp Mol Pathol. 2000;68(1):38–54. doi: 10.1006/exmp.1999.2292. [DOI] [PubMed] [Google Scholar]
- 15.Ajmo CT, Collier LA, Leonardo CC, et al. Blockade of adrenoreceptors inhibits the splenic response to stroke. Exp Neurol. 2009;218(1):47–55. doi: 10.1016/j.expneurol.2009.03.044. [DOI] [PMC free article] [PubMed] [Google Scholar]
- 16.Wong CH, Jenne CN, Lee WY, Léger C, Kubes P. Functional innervation of hepatic iNKT cells is immunosuppressive following stroke. Science. 2011;334(6052):101–105. doi: 10.1126/science.1210301. [DOI] [PubMed] [Google Scholar]
- 17.Dirnagl U, Klehmet J, Braun JS, et al. Stroke-induced immunodepression: experimental evidence and clinical relevance. Stroke. 2007;38(2 Suppl):770–773. doi: 10.1161/01.STR.0000251441.89665.bc. [DOI] [PubMed] [Google Scholar]
- 18.Seong SY, Matzinger P. Hydrophobicity: an ancient damage-associated molecular pattern that initiates innate immune responses. Nat Rev Immunol. 2004;4(6):469–478. doi: 10.1038/nri1372. [DOI] [PubMed] [Google Scholar]
- 19.Kim JB, Sig CJ, Yu YM, et al. HMGB1, a novel cytokine-like mediator linking acute neuronal death and delayed neuroinflammation in the postischemic brain. J Neurosci. 2006;26(24):6413–6421. doi: 10.1523/JNEUROSCI.3815-05.2006. [DOI] [PMC free article] [PubMed] [Google Scholar]
- 20.Kim JB, Lim CM, Yu YM, Lee JK. Induction and subcellular localization of high-mobility group box-1 (HMGB1) in the postischemic rat brain. J Neurosci Res. 2008;86(5):1125–1131. doi: 10.1002/jnr.21555. [DOI] [PubMed] [Google Scholar]
- 21.Muhammad S, Barakat W, Stoyanov S, et al. The HMGB1 receptor RAGE mediates ischemic brain damage. J Neurosci. 2008;28(46):12023–12031. doi: 10.1523/JNEUROSCI.2435-08.2008. [DOI] [PMC free article] [PubMed] [Google Scholar]
- 22.Jurányi Z, Sperlágh B, Vizi ES. Involvement of P2 purinoceptors and the nitric oxide pathway in [3H]purine outflow evoked by short-term hypoxia and hypoglycemia in rat hippocampal slices. Brain Res. 1999;823(1–2):183–190. doi: 10.1016/S0006-8993(99)01169-5. [DOI] [PubMed] [Google Scholar]
- 23.Latini S, Pedata F. Adenosine in the central nervous system: release mechanisms and extracellular concentrations. J Neurochem. 2001;79(3):463–484. doi: 10.1046/j.1471-4159.2001.00607.x. [DOI] [PubMed] [Google Scholar]
- 24.Zhang M, Li W, Niu G, Leak RK, Chen J, Zhang F. ATP induces mild hypothermia in rats but has a strikingly detrimental impact on focal cerebral ischemia. J Cereb Blood Flow Metab. 2013;33(1):e1–e10. doi: 10.1038/jcbfm.2012.146. [DOI] [PMC free article] [PubMed] [Google Scholar]
- 25.Foerch C, Singer OC, Neumann-Haefelin T, de Rochemont RdM, Steinmetz H, Sitzer M. Evaluation of serum S100B as a surrogate marker for long-term outcome and infarct volume in acute middle cerebral artery infarction. Arch Neurol. 2005;62(7):1130–1134. doi: 10.1001/archneur.62.7.1130. [DOI] [PubMed] [Google Scholar]
- 26.Mori T, Tan J, Arendash GW, Koyama N, Nojima Y, Town T. Overexpression of human S100B exacerbates brain damage and periinfarct gliosis after permanent focal ischemia. Stroke. 2008;39(7):2114–2121. doi: 10.1161/STROKEAHA.107.503821. [DOI] [PMC free article] [PubMed] [Google Scholar]
- 27.Borovikova LV, Ivanova S, Zhang M, et al. Vagus nerve stimulation attenuates the systemic inflammatory response to endotoxin. Nature. 2000;405(6785):458–462. doi: 10.1038/35013070. [DOI] [PubMed] [Google Scholar]
- 28.Prass K, Braun JS, Dirnagl U, Meisel C, Meisel A. Stroke propagates bacterial aspiration to pneumonia in a model of cerebral ischemia. Stroke. 2006;37(10):2607–2612. doi: 10.1161/01.STR.0000240409.68739.2b. [DOI] [PubMed] [Google Scholar]
- 29.Hazeldine J, Lord JM, Belli A. Traumatic brain injury and peripheral immune suppression: primer and prospectus. Front Neurol. 2015;6:235. doi: 10.3389/fneur.2015.00235. [DOI] [PMC free article] [PubMed] [Google Scholar]


