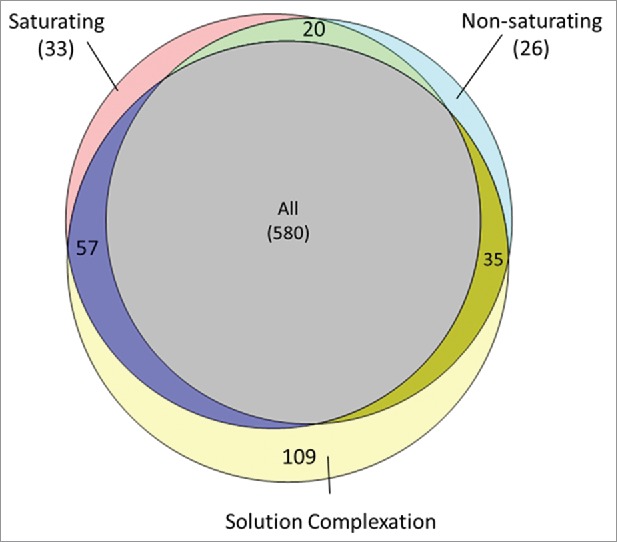
Figure 2.

Distribution of HCP identifications among the saturating, non-saturating and solution complexation groups. HCP identification was highly similar between the saturating and non-saturating conditions with few unique identifications to either group (< 4%). Solution complexation before bead addition yielded unique HCP identifications compared with the direct bead binding methods (∼13%).
